Introduction to GRID4EU Large-Scale Demonstration of Advanced Smart Grid Solutions in Europe
|
|
|
- Lee Beasley
- 5 years ago
- Views:
Transcription


1 Introduction to GRID4EU Large-Scale Demonstration of Advanced Smart Grid Solutions in Europe Yokohama, March 8 th, 2016 Rémy GARAUDE VERDIER GRID4EU Coordinator ERDF
2 Global agenda GRID4EU presentation Zoom on Demos To stay connected to GRID4EU 2
3 GRID4EU, a leading European project finished 9 days ago! Project led by 6 Electricity Distribution System Operators - covering altogether more than 50% of metered electricity customers in Europe Overall 27 partners from various horizons (utilities, manufacturers, universities and research institutes) Duration: 51 months from November 2011 to January 2016 Total eligible costs: 54M - requested EC Grant 25.5M Project Coordinator Technical Director Chairman of General Assembly 3

4 6 Demonstrators 27 Partners 4

5 6 innovation drivers 5

6 tested by 6 Demonstrators with different boundary conditions 6
7 to foster synergies and common work Distributed Energy Resources (DER) Active Demand Storage Innovative Power Management at MV level Innovative Power Management at LV level Micro-grid (Islanding) Climate Moderate Continental Cold & Stormy Continental / Oceanic Mild Mediterranean Dry Mediterranean Cold Continental Population Density Semi-urban Urban Urban Rural Semi-urban Warm & stormy Mediterranean Semi-urban / urban 7
8 Global agenda GRID4EU presentation Zoom on Demos To stay connected to GRID4EU 8


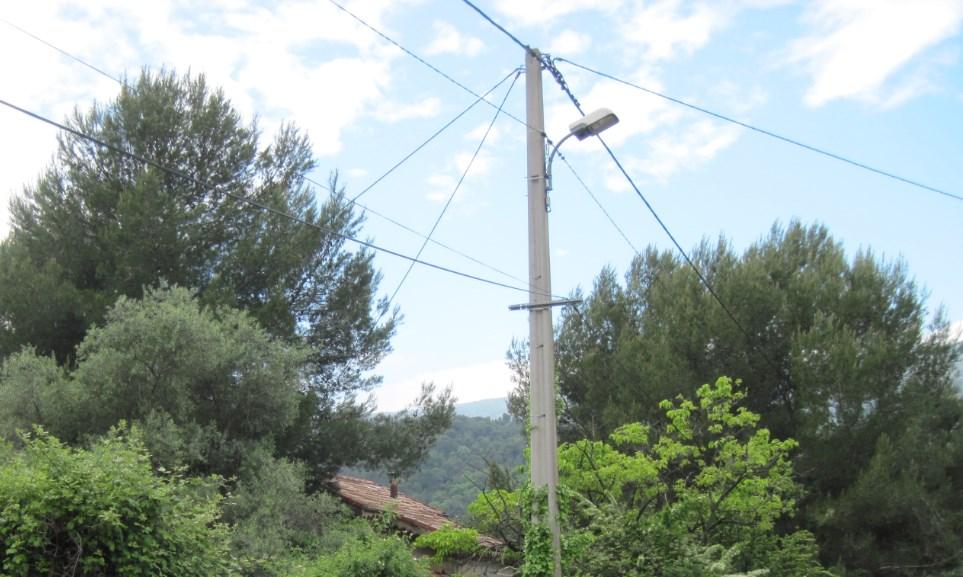
9 Zoom on the French DEMO A smart grid pilot testing and validating massive integration of Distributed Energy Resources (DER) and electricity storage Location In Carros near Nice, France Led by Other partners involved 4 Use Cases Optimize massive PV integration on the distribution grid Test islanding on a low voltage district Test a 3,5 MW load management in winter Give the customer a new role within the grid: prosumer Main figures 4 years project 30M budget 300 participating clients 1, 3 MW grid storage 80 kw residential storage 2 to 3 MWp installed PV capacity 9
 from")

10 Summer use case flexibilities two offers Solar bonus (additional off-peak hours) from 12:00 am to 4:00 pm on «solar days» Electric Hot Water Tank operated by Linky smart meter 10
11 00:00 00:50 01:40 02:30 03:20 04:10 05:00 05:50 06:40 07:30 08:20 09:10 10:00 10:50 11:40 12:30 13:20 14:10 15:00 15:50 16:40 17:30 18:20 19:10 20:00 20:50 21:40 22:30 23:20 Watt Solar bonus shifts + 20% more when PV generation is high Average load curve on a solar day for 36 clients with solar bonus offer considered from June 1 st 2015 to July 31 st 2015 (W) % consumption between 12 am and 4 pm compared to a reference day (0.6 kwh) results was 12% (0.4 kwh) Solar day Reference day (weekend and holidays excluded) Jours de sollicitation Jours sans sollicitation hors dimanches et jours fériés Source: EDF R&D 11
12 00:00 00:40 01:20 02:00 02:40 03:20 04:00 04:40 05:20 06:00 06:40 07:20 08:00 08:40 09:20 10:00 10:40 11:20 12:00 12:40 13:20 14:00 14:40 15:20 16:00 16:40 17:20 18:00 18:40 19:20 20:00 20:40 21:20 22:00 22:40 23:20 Watt The hot water tank offer shifts +56% more when PV generation is high Average load curve on a solar day for 18 clients with hot water tank (cascade version) considered from June 1 st 2015 to July 31 st 2015 (W) Hot water tank is switched on in cascade : at 12:00, 13:00, 14:00 and 15:00 for 1 to 4 hours +56% consumption between 12 am to 4 pm compared to a reference day (2,4 kwh). Solar bonus is also present Solar Jours de day sollicitation (19,20,24/06 : et and 24/06 1,24,25,31/07/2015 ; 01, 25 et Reference day (weekend and holidays excluded) Jours sans sollicitation hors dimanches et jours fériés Source: EDF R&D 12
13 13


14 The hot water tank offer shifts +56% more when PV generation is high Source: EDF R&D
15 Key factors of success for efficient residential flexibilities Recruit a lot of customers in the grid area where you want to balance consumption and PV generation (more than 50%) Identify new controllable loads, with higher storage capacity Behavior : kwh Hot water tank : + 2 kwh Residential battery : + 4 to 10 kwh (4 kwh tested in Nice Grid) Electric Vehicle : up to 20 kwh (not tested in Nice Grid) Enlarge the optimization area (Primary Substation minimum), to reduce the dispersion of the forecasts and the results Control the individual PV generation with self-consumption or self-storage, even when the prosumer is absent 15

16 Zoom on the Swedish DEMO Validate that the control of LV distribution networks using AMR events allows for more distributed generation while improving customer power quality Location In Uppsala, Sweden Other partners involved Led by Objectives in Demo 2: - Identify blackouts in the LV network and at customer sites - Improved Power Quality by monitoring Technical scope = Harmonize two technologies: Intelligent equipment in 100 Secondary Substations GPRS AMM Technology Smart Meters 3 ph 3 ph + 16
17 Zoom on the German DEMO Demonstrate that European MV networks can use the concept of autonomous, selforganising nodes to serve the need of both the DSO and the served clients Location In the municipality of Reken, North-Rhine Westphalia, Germany Led by Partners involved Objectives Multi-agent system as an industrial solution for network operation, thus allowing: Integration of an increasing number of decentralized energy resources (windmills, solar panels ) in the medium and low voltage networks Achieving higher reliability, shorter recovery times after grid failures Avoiding unknown overloads Fulfilling the needs of surveillance and remote-control in MV-networks 17
18 Zoom on the Spanish DEMO Enhance the observability and control of the low and medium voltage distribution networks building on a multi-layer solution for smart metering implementation Location In Castellón, Spain Other partners involved Objectives Usage of intelligent meters information for better knowledge of the network status (immediate knowledge of outages, of electrical magnitudes out of limits, of power quality) Monitoring the LV lines at the Secondary Substations (SS), to evaluate overloads, unbalances, etc. (nowadays they are not monitored) Evaluate losses (technical and non-technical) by comparing SS totals with the accumulated of the customers, hour per hour Reinforce high-voltage (HV) network control by monitoring electrical magnitudes and implementing effective fault detection and automatic restoration Give customers better information of their consumption, and inform them about the network situation (ex. disturbances) 18

 and power flow control in the MV grid MV network Hosting")
19 Zoom on the Italian DEMO Increase the Medium Voltage (MV) network's hosting capacity for Distributed Energy Resources (DER, in particular solar), introducing Active Control and Demand Response of MV generators, controllable loads and storage Location In the area of Forli, Emilia Romagna Cesena, Italy Other partners involved Develop new procedures for avoiding unsafe and unsecure islanding operation Enable the dispatching of the renewable generation in the MV grid Test and assess the usage of a storage device for optimized Network Operation and Energy Management Implement Voltage Control (at all nodes) and power flow control in the MV grid MV network Hosting Capacity 19
20 Zoom on the Czech DEMO Demonstrate that existing distribution networks having smart metering and CHP Units can be upgraded to allow automatic islanding while ensuring enough power supply Location In Vrchlabí, Czech Republic Other partners involved Objectives Demonstrate that existing distribution networks having smart metering and CHP units can be upgraded to allow for islanding while ensuring enough power provision full smart meters deployment, including launching of an information customers web portal installation of generation capacity of 1,2 MW in DER (CHP units) automation of the existing MV and LV grid running of island operations ensuring sufficient power supply to the area during the island operations 20
21 Global agenda GRID4EU presentation Zoom on Demojstrators To stay connected to GRID4EU 21
22 To discover all GRID4EU Final Results Subscribe to the GRID4EU newsletter: Follow us on social media: Follow on Twitter: twitter.com/grid4eu Join on LinkedIn: Next step: GRID4EU FINAL REPORT to be published! 22


23 Thank you for your attention! Visit our website: All public deliverables are available on the GRID4EU Website: 23