Large-Scale Sediment Retention Device Testing Representing Exposure to Post-Construction Sediment Load. FLEXSTORM PC Inlet Filters
|
|
|
- Eustace Thomas
- 5 years ago
- Views:
Transcription
1 Large-Scale Sediment Retention Device Testing Representing Exposure to Post-Construction Sediment Load of FLEXSTORM PC Inlet Filters November 2009 Submitted to: Inlet & Pipe Protection, Inc W. 111 th St., Unit A Naperville, IL Attn: Mr. Jamie Ringenbach Submitted by: TRI/Environmental, Inc Bee Caves Road Austin, TX C. Joel Sprague Project Manager 9063 Bee Caves Road Austin, TX (512) FAX TEST
2 November 24, 2009 Mr. Jamie Ringenbach Inlet & Pipe Protection, Inc W. 111 th St., Unit A Naperville, IL jr@inletfilters.net Subject: Sediment Retention Device Testing of FLEXSTORM PC Inlet Filter Representing Post-Construction Sediment Load (Log # ) Dear Mr. Ringenbach: This letter report presents large-scale sediment retention device tests performed on the FLEXSTORM PC sediment bag, a 2-ply geotextile with a nonwoven inner liner and woven outer layer. Sediment retention effectiveness and removal rate based on total suspended solids (TSS) testing of effluent grab samples and captured sediment measurements are reported. The data were developed for sediment-laden runoff from a simulated 100-ft long, 3:1 slope exposed to varying flow rates into an area inlet. A post-construction sediment concentration condition was simulated using OK-110 silica sand in clean water. Generated results were used to develop the following effectiveness percentages: Product Tested FLEXSTORM PC Sediment Bag Sediment Load 1750 mg/l using OK-110 Silica Sand and Clean Water Ave Flow Rate GPM TSS Removal Soil Retention Efficiency % 98.96% % 99.25% % 98.80% TRI is pleased to present this final report. The data presented herein appears to be consistent with commonly reported values. Please feel free to call if we can answer any questions or provide any additional information. Sincerely, C. Joel Sprague, P.E. Senior Engineer Geosynthetics Services Division Cc: Sam Allen, Jarrett Nelson - TRI 9063 Bee Caves Road Austin, TX (512) FAX TEST
3 Page 1 LARGE-SCALE SEDIMENT RETENTION DEVICE (SRD) TSS TESTING REPORT FLEXSTORM PC Inlet Filter TESTING EQUIPMENT AND PROCEDURES Overview of Test and Apparatus TRI/Environmental, Inc.'s (TRI's) large-scale sediment retention device (SRD) testing facility is located at the Denver Downs Research Farm in Anderson, SC. Testing oversight is provided by C. Joel Sprague, P.E. Large-scale testing was performed to simulate post-construction sediment-laden runoff flowing to an area inlet at varying flow rates. Effluent grab samples were taken at intervals for laboratory total suspended solids (TSS) testing. Additionally, the sediment collected in the SRD was measured. The results were compared to the calculated amount of sediment in the upstream flow over time to quantify the effectiveness of the SRD in retaining those sediments and confirm sediment retention rates. This test method is full-scale and therefore, appropriate as an indication of product performance, for general comparison of product capabilities, and for assessment of product installation techniques. For this testing, a simulated area inlet comprised of a lined wooden box section and 24 diameter inlet opening was used to position the SRD in a representative condition. This facilitates multiple test repetitions during a single day of testing. The test apparatus is shown in Figure 1. Sediment Retention Device (SRD) The following table describes the tested SRD. Table 1. Tested FLEXSTORM PC Sediment Bag Fabric Component Description Inner Liner NonWoven Outer Layer Woven Polypropylene AOS, sieve Water Flow Rate, gpm/ft Tested Bag Capacity, ft 3 ~ 2.1
 installation used a simulated area inlet comprised of a wooden box section and inlet")


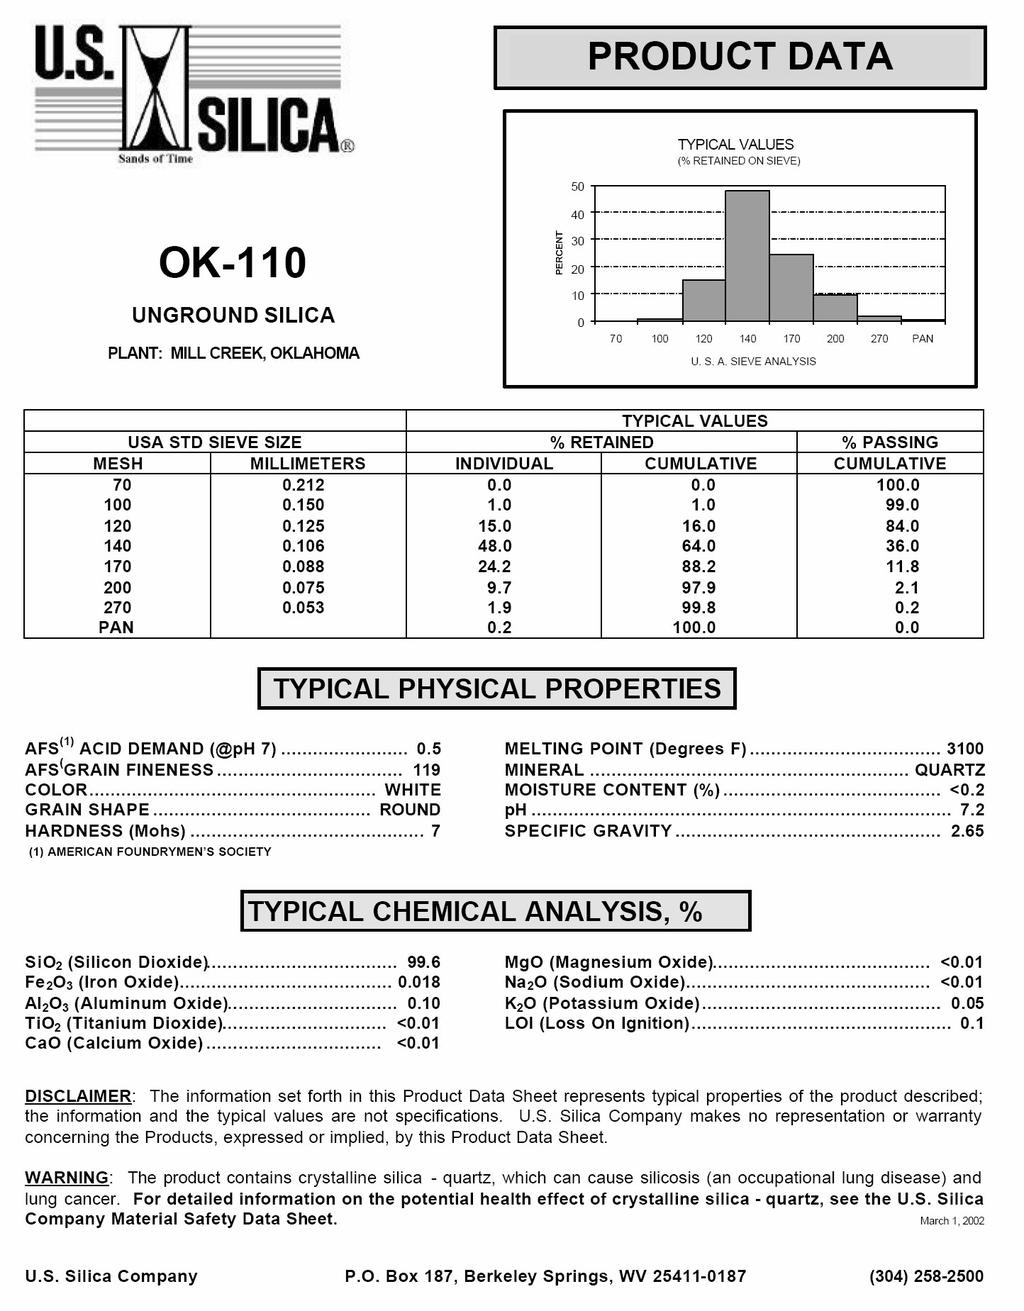
4 Page 2 Test Soil The test soil used is OK-110 Silica Sand by US Silica - See Appendix A for Product Data. Test Preparation SRD Installation The Sediment Retention Device (SRD) installation used a simulated area inlet comprised of a wooden box section and inlet opening to position the Inlet Filter Bags in a representative condition. Mixing Sediment-Laden Runoff - Sediment-laden runoff was created by combining water and soil in the mixing tank and agitating during the test lb of water and 14 lbs of sand were combined to create the sediment-laden runoff at a sediment concentration of 1750 mg/l. This concentration was determined to be consistent with post-construction conditions. Controlling Flow - Flow was controlled by opening a valve to release water through an outlet pipe leading to the area inlet. Weight change in water leaving the hopper over time was used to confirm average flow rates. Three tests were performed at low, medium, and high flow rates. A new bag was used at the start of each test. TEST SETUP As noted, the submitted SRD installation used a simulated area inlet comprised of a wooden box section and 24 diameter inlet opening to position the FLEXSTORM PC in a representative field condition. Sediment laden flow was introduced through a pipe from the mixing tank as shown in Figure 1. Inside View of Hopper Agitator Hopper With Outlet Pipe Leading To Area Inlet Area Inlet Simulated Showing Influent Discharge From Pipe Figure 1. Test set-up, including mixing tank and wooden box with simulated area inlet.


5 Page 3 Test Procedure Releasing and Collecting Sediment-Laden Runoff - The sediment-laden water was discharged at average flow rates of 23, 48, and 70 gallons per minute, respectively, over the three tests. effluent grab samples were collected throughout the tests and weight of water and sediment discharged was recorded at regular intervals. Retention observations and associated times were recorded during the test. EFFLUENT GRAB SAMPLES TAKEN HERE GRAB SAMPLE CONTAINERS CAPTURED SEDIMENT Figure 2. Collection of Sediments and Test Sampling.
6 Page 4 TEST RESULTS Laboratory TSS analysis results of the effluent grab samples are shown in Table 2 below along with the percent removal rates. Total sediment and associated runoff measured during the testing are the supporting data used to confirm the performance of the product tested in addition to the measured TSS in the effluent grab samples. The sediment captured was compared to the calculated sediment discharged to quantify the soil retention effectiveness and the removal rate of the SRD. Table 2. Measures of Effectiveness Sediment Load: Calculated Sediment Concentration (mg/l): Run: A B C 14 lbs sand lbs water Flow Rate (lb/min): Flow Rate (gal/min): Product Tested: FlexStorm PC FlexStorm PC FlexStorm PC No. Time, min mg/l % Removal No. Time, min 1750 mg/l % Removal No. Time, min mg/l % Removal Samples (downstream): A1E % B1E % C1E % *Average TSS Removal Rate (%): A2E % B2E % C2E % A3E % B3E % C3E % A4E % B4E % C4E % A5E % B5E % 3.25 A6E % B6E % % 99.32% 98.89% Calculated Water In (lbs): Calculated Soil In (lbs): Soil Captured + Bag (lbs): Estimated Bag Wt. (lbs): Net Sediment Captured (lbs): Soil Retention Effectiveness (%): 98.70% 99.27% 98.88% Total Estimated Soil In (lbs): 9.23 Tot Sediment Captured (lbs): 9.14 Total Soil Retention Effectiveness (%): 99.01% *TSS Removal was measured in accordance with SM 2540D
7 APPENDIX A: OK-110 Silica Sand Product Data FlexStorm PC Inlet Filter Testing Appendix
8 Appendix
9 APPENDIX B LABORATORY QUALIFICATIONS FlexStorm PC Inlet Filter Testing Appendix
10 Appendix Testing Expertise TRI/Environmental (TRI) is a leading, accredited geosynthetic, plastic pipe, and erosion and sediment control product testing laboratory. TRI s large-scale erosion and sediment control testing facility in the upstate of South Carolina at the Denver Downs Research Farm (DDRF) is focused on full-scale erosion and sediment control performance tests. Technical Oversight Joel Sprague, P.E., TRI s Senior Engineer provides technical oversight of all of TRI s erosion and sediment control testing and can be contacted at: Mr. C. Joel Sprague, Senior Engineer PO Box 9192, Greenville, SC Ph: 864/ ; Fax 864/ ; jsprague@tri-env.com Mr. Sprague has been involved with the design of erosion and sediment control systems and the research, development, and application of erosion and sediment control products/materials for many years. He was the lead consultant in the development of bench-scale testing procedures for the Erosion Control Technology Council. Mr. Sprague has authored numerous technical papers on his research and is readily available to assist clients with their research and testing needs. Operations Management Sam Allen, TRI s Division Vice President provides operational management of all TRI laboratories and can be contacted at: Mr. Sam Allen, Vice President & Program Manager 9063 Bee Caves Road Austin, TX Ph: 512/ ; Fax: 512/ ; sallen@tri-env.com Mr. Allen pioneered the laboratory index testing of rolled erosion control products (RECPs) and has been actively involved in the development and standardization of testing protocol and apparatus for more than 10 years. He set up and oversees TRI s erosion and sediment control testing laboratories. His oversight responsibilities include test coordination, reporting, and failure resolution associated with the National Transportation Product Evaluation Program (NTPEP) for RECPs. Subcontract Laboratory Sample Testing TRI/Environmental (TRI) subcontracts with leading, accredited analytical laboratories for some sample testing. Total Suspended Solids (TSS) testing and Oil and Grease (TPH/HEM) testing are performed by: Shealy Environmental Services, Inc. 106 Vantage Point Drive West Columbia, SC Ph: 803/ ; Fax: 803/