So, Is the Chesapeake Bay. Yet After Going on The Bay Pollution Diet?
|
|
|
- Wendy Richardson
- 5 years ago
- Views:
Transcription


1 So, Is the Chesapeake Bay Watershed Losing Weight Yet After Going on The Bay Pollution Diet? Rich Batiuk Associate Director for Science Chesapeake Bay Program Office U.S. Environmental Protection Agency October 11, 2012 Pennsylvania State Section of the 2012 Annual Conference 1 of 25
2 Is Jenny Craig happy with us watershed residents? Pennsylvania State Section of the 2012 Annual Conference 2 of 25


3 Bay TMDL Level Approximately 278 million pounds of nitrogen during the 2010 water year. Bay TMDL Level Approximately 16 million pounds in the 2010 water year. Pennsylvania State Section of the 2012 Annual Conference 3 of 25


4 Most visible trends are decreases in the extent of early and mid summer no oxygen conditions Decreasing trends in water clarity have our Bay scientists questioning the causes Pennsylvania State Section of the 2012 Annual Conference 4 of 25


5 Long term increases in Bay grasses keep hitting glass ceiling lack of improving clarity, hotter summers Stream health is mostly very poor or poor Excellent Good Fair Poor Very Poor 42% 13% 12% 18% 15% Pennsylvania State Section of the 2012 Annual Conference 5 of 25


6 Average of total CB watershed condition is fair 3% 0% 6% 14% 5% GOOD FAIR POOR VERY POOR NO RATING 25% 47% The Chesapeake Bay TMDL Pennsylvania State Section of the 2012 Annual Conference 6 of 25


7 Pollution Diet for Each Tidal Water Segment Chesapeake Bay Airshed Model Chesapeake Bay Land Change Model Chesapeake Bay Scenario Builder Chesapeake Bay Watershed Model Chesapeake Bay Water Quality and Sediment Transport Model Chesapeake Bay Filter Feeder Model Pennsylvania State Section of the 2012 Annual Conference 7 of 25


8 Relative Effect of a Pound of Pollution on Bay Water Quality Pennsylvania State Section of the 2012 Annual Conference 8 of 25
 7 6 5 4")


9 Major River Basin by Jurisdiction Relative Impact on Bay WQ 8 Relative effectiveness (Riverine * Estuarine Delivery) UpES, MD UpES, DE MidES, MD Susq, MD LowES, MD Wsh, MD UpES, PA LowES, DE Susq, PA PxtB, MD EshVA, VA PotB, DC MidES, DE PotA, DC PotB, MD PotB, VA Susq, NY RapB, VA PotA, MD YrkB, VA PotA, VA Wsh, PA PotA, WV PotA, PA PxtA, MD JmsB, VA RapA, VA YrkA, VA JmsA, VA JmsA, WV Pollution Diet by State by River Pennsylvania State Section of the 2012 Annual Conference 9 of 25


10 Year So, Is the Chesapeake Bay Watershed Losing Weight Yet After Going on the Bay Pollution Diet? Chesapeake Bay TMDL Based on 7 Watershed Implementation Plans How is This TMDL Different? 1. Watershed Implementation Plans identify nutrient and sediment targets that meet water quality standards. 2. Chesapeake Bay TMDL establishes allocations for point and nonpoint sources to meet water quality standards Part of Broader Accountability Process 3. 2 Year Milestones with programmatic and pollutant reduction commitments in place by Federal Actions if insufficient Watershed Implementation Plans or 2 year milestones Pennsylvania State Section of the 2012 Annual Conference 10 of 25
11 We are Making Progress! Simulated Nitrogen Loads Delivered to the Bay by Jurisdiction 400 Simulated Nitrogen Loads Delivered to the Bay by Jurisdiction* (million pounds/year) EPA: Atmospheric Deposition to Tidal Water (to be reduced to 15.7 million lbs/yr under Clean Air Act) EPA: Atmospheric Deposition to Watershed (to be reduced under Clean Air Act) District of Columbia 200 Delaware 150 West Virginia 100 Virginia 50 Maryland Interim Target 2025 Planning Target Pennsylvania New York *Loads simulated using version of Watershed Model and wastewater discharge data reported by Bay jurisdictions.. Pennsylvania State Section of the 2012 Annual Conference 11 of 25
12 Simulated Nitrogen Loads Delivered to the Bay by Source Simulated Nitrogen Loads Delivered to the Bay by Source* (million pounds/year) Atmospheric Deposition to Tidal Water 300 Atmospheric Deposition to Watershed (to be reduced under Clean Air Act) 250 Forest + Non Tidal Water Atmospheric Deposition Septic 100 Wastewater + Combined Sewer Overflow 50 Urban Runoff *Loads simulated using version of Watershed Model and wastewater discharge data reported by Bay jurisdictions. Agriculture Simulated Phosphorus Loads Delivered to the Bay by Jurisdiction Simulated Phosphorus Loads Delivered to the Bay by Jurisdiction* (million pounds/year) District of Columbia Delaware West Virginia Virginia 10 Maryland Pennsylvania 5 New York Interim Target 2025 Planning Target *Loads simulated using version of Watershed Model and wastewater discharge data reported by Bay jurisdictions. Pennsylvania State Section of the 2012 Annual Conference 12 of 25
13 Simulated Phosphorus Loads Delivered to the Bay by Source Simulated Phosphorus Loads Delivered to the Bay by Source* (million pounds/year) Forest + Non Tidal Water Atmospheric Deposition 20 Wastewater + Combined Sewer Overflow 15 Urban Runoff 10 Agriculture *Loads simulated using version of Watershed Model and wastewater discharge data reported by Bay jurisdictions. Nitrogen Loads to the Bay 2011 by Source Forest + Non- Tidal Water Atmospheric Deposition 19% Septic 3% Wastewater + Combined Sewer Overflow 18% Urban Stormwater 16% Agriculture 44% Pennsylvania State Section of the 2012 Annual Conference 13 of 25
14 Atmospheric Deposition (including livestock & fertilized soil emissions, mobile+utility +industry, natural sources) 31% Septic 3% Nitrogen Loads to the Bay by Root Source Manure 15% Fertilizer 27% Wastewater + Combined Sewer Overflow 18% Legume Fixation 6% PA Nitrogen Loads to the Bay 2011 by Source Septic 2% Wastewater + Combined Sewer Overflow 10% Forest + Non- Tidal Water Atmospheric Deposition 20% Urban Stormwater 15% Agriculture 53% Pennsylvania State Section of the 2012 Annual Conference 14 of 25
15 Phosphorus Loads to the Bay 2011 by Source Forest 9% Wastewater t + Combined Sewer Overflow 17% Urban Stormwater 17% Agriculture 57% Phosphorus Loads to the Bay Natural (wildlife, forest, etc.) 8% Wastewater + Combined Sewer Overflow 17% by Root Source Manure 37% Impervious Urban, Extractive, Construction 13% Fertilizer 25% Pennsylvania State Section of the 2012 Annual Conference 15 of 25


16 PA Phosphorus Loads to the Bay 2011 by Source Forest 9% Wastewater + Combined Sewer Overflow 21% Urban Stormwater 16% Agriculture 54% Watershed population has more than doubled since 1950 Pennsylvania State Section of the 2012 Annual Conference 16 of 25


17 Chesapeake Bay Watershed Monitoring Network 120 stations in 2012 Started with 31 Long-term ( ) water quality monitoring stations in the Chesapeake Bay Watershed 9 River Input Stations 22 Upstream Stations Pennsylvania State Section of the 2012 Annual Conference 17 of 25
 down 2 up 8 not significant")
 down 4 up 5 not")

18 Flow-adjusted Total Nitrogen Trends at 31 sites (68%) down 2 up 8 not significant Flow-adjusted Total Phosphorus Trends at 31 sites (71%) down 4 up 5 not significant 13 down sites exceed 50% reduction Pennsylvania State Section of the 2012 Annual Conference 18 of 25

 14 not sig.")


19 Flow-adjusted Total Sediment Trends at 31 sites down 7 up (5>50%) 14 not sig. (45%) Photo credit: NASA MODIS, Sept. 13, 2011 Pennsylvania State Section of the 2012 Annual Conference 19 of 25


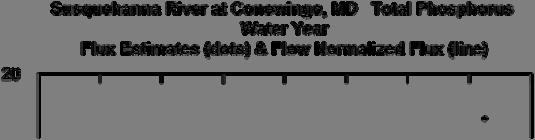
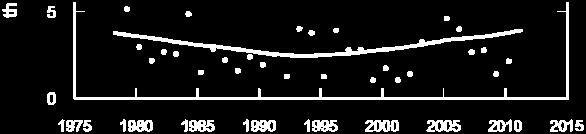
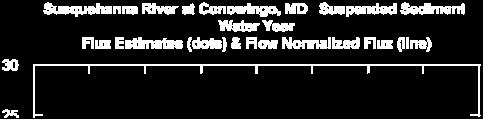
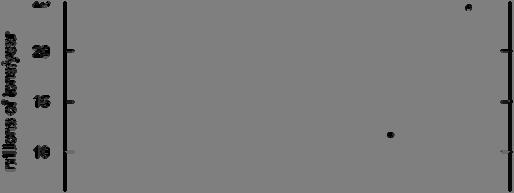
20 ty rcent of capacit Per Source: Langland, 2009, USGS Pennsylvania State Section of the 2012 Annual Conference 20 of 25


21 Pennsylvania State Section of the 2012 Annual Conference 21 of 25


22 Potential impacts when Conowingo reaches capacity Change since 1996 Predicted change when reservoirs filled TN -3% +2% TP +55% +70% SS +97% +250% Pennsylvania State Section of the 2012 Annual Conference 22 of 25
23 Pennsylvania s Milestones Numeric Reduction Commitments by Jurisdiction Jurisdiction Nitrogen (lbs) Phosphorus (lbs) Sediment (lbs) DC 394,069 9,130 DE 48,149 42,702 18,731,484 MD 790, , ,079 NY + 433, ,988 16, 397,577 PA 6,328, , ,112,700 VA 5,714, , ,460,819 WV 58,613 69, ,733,105 EPA Tidal Deposition EPA Non tidal deposition 2,5000, ,000 Pennsylvania State Section of the 2012 Annual Conference 23 of 25
24 Challenges and Opportunities Susquehanna Dams Over 40, farms Hundreds of medium to small size wastewater treatment facilities Stormwater regulated and unregulated Local flooding We are willing to bear our share of the burden if the effort is based on good science and equitably shared. Pennsylvania State Section of the 2012 Annual Conference 24 of 25


25 Questions Rich Batiuk Pennsylvania State Section of the 2012 Annual Conference 25 of 25