Introduction Climate Futures
|
|
|
- Silvia Armstrong
- 5 years ago
- Views:
Transcription

1 Introduction Climate Futures Climate Futures approach to the provision of regional climate projection information Jack Katzfey Acknowledgements: Penny Whetton, Kevin Hennessy, John Clarke, David Kent
2 Outline Climate projections and impact assessment Typical climate projections A new approach: climate futures Conclusions Activity
3 Climate Projections Climate projections are used in a variety of impact assessments The level of detail depends on the objectives of the decision-makers, e.g. less detail is required for general awareness-raising than designing a new road No one size fits all, so climate projections need to be purpose-built 3 Presentation title Presenter name

4 Risk Assessment Risk = consequence x likelihood A number of climate risk assessment and management frameworks exist Important to consider a range Worst Case Most Likely CSIRO & BoM (2007)
5 Typical Climate Projections Projections are often given for individual climate variables, such as rainfall, for selected years and emissions scenarios Projections from different climate models tend to be mixed together and expressed as an average change with a range of uncertainty, e.g. 2 C (1-3 C) temperature and 10% (-5%-15%) rainfall
 % Rainfall change: (-15 to +10) % Radiation -2 % 0 +2%")
6 Typical Climate Projections Radiation: (-1.2 to +1.8) % Rainfall change: (-15 to +10) % Radiation -2 % 0 +2% Rainfall -20 % %
7 Internally Consistent Projections Detailed risk assessments need projections with internally consistent data for multiple climate variables Projections based on individual climate models have internal consistency There will be up to 40 global climate models and 8 high resolution models available. Each simulation represents a plausible projection Too much information! How can we simplify communication and data delivery?
8 Individual Climate Model Issues Substantial differences between climate models in simulated future regional climate Rapid growth in the number of potentially relevant GCM (and downscaled) results, emission scenarios, etc Desire for simplicity: e.g. many users want to use a few as possible future climate scenarios in impact assessments Much interest in model evaluation and selection
9 Model evaluation is not the answer The poorest models can be identified, but not the best Furthermore, less likely, but plausible, simulated future climates may be highly relevant in adaptation studies robust decision making (Lempert & Schlesinger, 2000, Dessai 2009) How else we can reduce complexity?
10 A new approach: Climate Futures Group the projections into a set of climate futures, e.g. Warmer, wetter (9 models = 50%) Warmer, drier (4 models = 22%) Hotter, drier (2 models) Hotter, much drier (1 model) Warmer, much drier (1 models) Hotter, wetter (1 models) Changes in temperature and rainfall are often strongly linked to changes in extreme weather events as well as humidity, sunshine and evaporation
11 The Climate Futures Approach Each dot represents the change in temperature and rainfall from 1 climate model Rainfall change (%) C warmer -20% to +30% change in rainfall A lot of possibilities How can we simplify this information? Warming ( C) Climate Futures Framework
12 Classifying projected changes: towards Climate Futures Warmer Hotter 8 out of 18 models give a warmer climate Rainfall change (%) out of 18 models give a hotter climate Warming ( C) Climate Futures Framework
13 Classifying projected changes: towards Climate Futures Rainfall change (%) Much wetter Wetter Drier -20 Much drier out of 18 models give a much wetter climate 6 out of 18 models give a wetter climate 2 out of 18 models give a much drier climate -30 Warming ( C) Climate Futures Framework
14 Classifying projected changes: towards Climate Futures Much wetter Warmer Hotter 3 out of 18 models give a hotter and much wetter climate Rainfall change (%) Wetter Drier -20 Much drier 7 out of 18 models give a warmer and much wetter climate etc -30 Warming ( C) Climate Futures Framework
15 The Climate Futures Approach
16 A new approach: Climate Futures Scientists work with decision-makers to identify climate futures of most relevance to their risk assessment, e.g. the biggest negative / positive impact the least impact the most likely future (or medium impact) Each climate future has an estimated likelihood Within in each climate future, select a representative climate model then use projections from that model in risk assessment don t need to use all models
17 Climate Futures: Terminology Most Likely Climate Future: The climate future that contains the greatest number of models Best Case Climate Future: Decided with decision-makers best impact on the system being investigated Worst Case Climate Future: Decided with decision-makers largest negative impact on the system being investigated
18 Classifying future climates Projected climate change 40 P T
19 Classifying future climates Projected climate change 40 P T Worst Case Most Likely Best Case
20 Classifying future climates Projected climate change 40 GCM RCM GCM GCM GCM GCM P GCM T Worst Case Most Likely Best Case
21 Classifying future climates Projected climate change 40 RCM GCM GCM GCM GCM GCM P GCM T Worst Case Most Likely Best Case Warmer Drier Just Warmer Warmer Wetter
22 Conclusions Detailed risk assessments need projections from individual climate models to ensure internal consistency across multiple climate variables Using all climate models is very resource intensive Need to simplify communication and data delivery No one size fits all, so climate projections need to be purpose-built
23 Activities Activity 2.1 Presentation Activity 2.2 Presentation Activity 3 Design Your Own!
24 Terminology Key Climate Futures Best Case Climate Future: Decided with decision-makers best impact on the system being investigated Worst Case Climate Future: Decided with decisionmakers largest negative impact on the system being investigated Most Likely Climate Future: The climate future that contains the greatest number of models but there are some rules
25 Most Likely Rules Most Likely climate future 1. Must contain at least 33% (⅓) of the total models 2. Must contain at least 10% more models than the next most likely climate future
26 Most Likely Rules Most Likely climate future Rule 1: Must contain at least 33% (⅓) of the models
27 Most Likely Rules = 9 out of 18 models or 50% of Models Most Likely climate future Rule 1: Must contain at least 33% (⅓) of the models 1. Add adjacent cell with next highest No of models 2. If total more than 33% a) The Most Likely is the two combined

28 Most Likely Rules = 9 out of 18 models or 50% of Models How would you describe this? Hotter and Little Change to Drier 9 of 18 models (50%) = moderate likelihood
29 Most Likely Rules = 11 out of 17 models or 65% of Models Most Likely climate future Rule 2: Must contain at least 10% more models 1. Combined total must have 10+% more than next most likely future

 = moderate")
30 Most Likely Rules = 11 out of 17 models or 65% of Models How would you describe this? Warmer to Hotter and Little Change in rainfall 11 of 17 models (65%) = moderate likelihood
31 Activities Activity 2.1 Presentation Activity 2.2 Water Availability Presentation Activity 3 Design Your Own!
32 Hypothetical Case Study: Rainfall Capture and Storage Projections for impact assessment of rainfall capture and storage in 2050 under low and high emissions Key variables (in order of priority) 1. Mean rainfall 2. Evaporation 3. Surface temperature 4. Humidity Climate Futures Framework
33 Hypothetical Case Study: Rainfall Capture, Most Likely
34 Hypothetical Case Study: Rainfall Capture, Worst Case Driest (least rainfall) and hottest (greatest evaporation) Greatest investment in new infrastructure Very low likelihood
35 Hypothetical Case Study: Rainfall Capture, Best Case Wettest (least evap.) Least investment in new infrastructure Very low likelihood
36 Hypothetical Case Study: Rainfall Capture Most Likely Best case Worst case
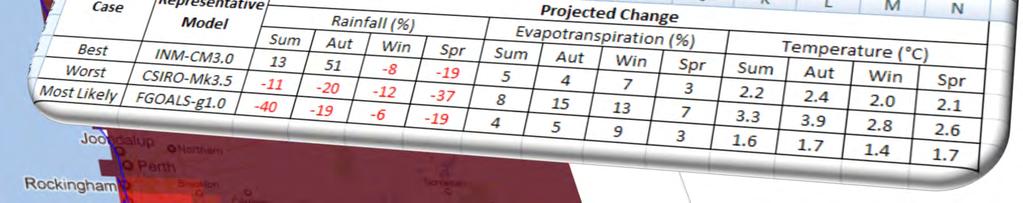
37 Hypothetical Case Study: Rainfall Capture Summary Case Climate Future Likelihood Representative Model Best Hotter & Wetter Very Low INM-CM3.0 Worst Most Likely Much Hotter & Much Drier Hotter & Much Drier Very Low Moderate CSIRO-Mk3.5 FGOALS-g1.0


38 Hypothetical Case Study: Rainfall Capture Climate Futures Framework
39 Activity 3 Water Availability 1. Select relevant climate futures 2. Select a model to represent each future Case Climate Future Likelihood Best Worst Most Likely Representative Model
40 Thank you! CMAR/CAF