National Performance of High Recycled Mixtures
|
|
|
- Raymond Pearson
- 5 years ago
- Views:
Transcription


1 National Performance of High Recycled Mixtures

2 Outline Trends in RAP and RAS usage and practices Motivations for higher recycled contents Barriers to higher recycled contents Research and future directions 2
3 Estimates of RAP Usage NAPA surveys estimate that the national average RAP content increased from 16.2% in 2009 to 20.4% in RAP contents tend to be higher in commercial projects compared to government projects. RAP usage varies considerably from state to state. 3

4 Average RAP contents by state NAPA IS 138,

5 Motivations for Higher RAP Contents Environmental & Sustainability benefits Economic savings 5


6 Conservation of Materials At an average RAP content of 20%, we conserve over 66 million tons of aggregate and 9 million barrels of asphalt each year. 6

7 The average RAP content in Japan is 47% 7

8 $900 Unmodified Paving Grade Asphalt and Crude Oil Prices 160 $ Asphalt Price Per Ton $700 $600 $500 $400 $300 $200 PG unmodified WTI Crude Oil ($/barrel) $100 Crude Oil (WTI) 20 $0 JAN 02 MAY 02 SEP 02 JAN 03 MAY 03 SEP 03 JAN 04 MAY 04 SEP 04 JAN 05 MAY 05 SEP 05 JAN 06 MAY 06 SEP 06 JAN 07 MAY 07 SEP 07 JAN 08 MAY 08 SEPT 08 JAN 09 MAY 09 SEPT 09 JAN 10 MAY10 SEPT 10 JAN 11 MAY 11 SEPT 11 JAN 12 MAY 12 SEP 12 JAN 13 MAY 13 SEP 13 JAN 14 MAY 14 SEP 14 JAN 15 MAY 15 SEP 15 0
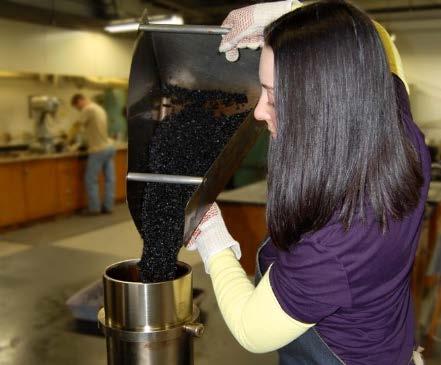
9 Current RAP Practices In most (not all) places across the USA Project millings become property of contractor Urban contractors have excess supplies of RAP Processing options for RAP no additional processing for single source milling stockpiles blending & crushing: multiple source stockpiles fractionating: RAP contents >30% 9
10 Reasons why Contractors use less RAP than allowed Availability of RAP Requirement to use a softer virgin binder Limited availability and/or tankage issue Requirement to recover and Test RAP binder Ability to control the quality of the mix Moisture Amount of material passing no. 200 sieve Workability RAP variability 10
11 Barriers to Higher RAP Contents History and Perceptions Performance of high RAP content pavements Concerns about quality and consistency of RAP Technology Limitations Current mix design system Relies on VMA & therefore aggregate bulk specific gravities Does not adequately consider composite binder properties Need reliable performance tests 11


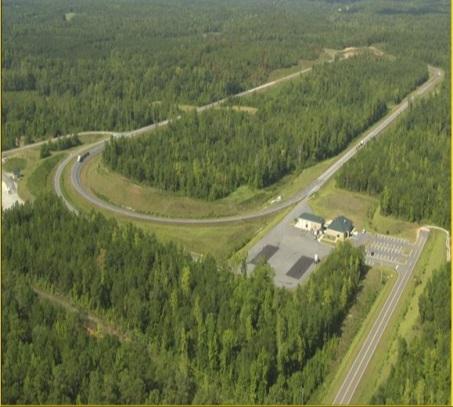
12 LTPP SPS-5 pavement sections 18 U.S. states and Canadian provinces Eight 500 ft. test sections Rehabilitated sections compared 2 vs 5 overlay thickness RAP (30%) vs virgin mixes Milled vs unmilled surface preparation Projects range in age from 6 to 17 yrs 12

13 SPS-5 Project Locations 13 13
14 ANOVA: Rutting Main Effects Plot for Rutting Fitted Means Milling Thickness 7.0 Mean Rut Depths (mm) N Mix Type Y 50 Time RAP Virgin
15 ANOVA: Fatigue Cracking Main Effects Plot for Fatigue Cracking Fitted Means Milling Thickness (mm) Mean Fatigue Cracking (m^2) N Mix Type Y 50 Time RAP Virgin
16 ANOVA: Transverse Cracking Mean Transverse (No. of Cracks/Section) Main Effects Plot for Transverse Cracking Fitted Means N RAP Milling Mix Type Y Virgin 1 50 Thickness (mm) Time
17 ANOVA: International Roughness Index Main Effects Plot for IRI Fitted Means Milling Thickness (mm) Mean IRI (m/km) N RAP Mix Type Y Virgin 1 50 Time
18 Conclusions on LTPP SPS-5 Based on a long-term performance analysis of a large number of projects across North America Pavements using 30% RAP performed well, and in most cases, perform equal or better than virgin pavements Transverse and fatigue cracking were observed at higher percentages in pavements with RAP compared to pavements with all virgin materials. Higher percentages cracking did not impact overlay lives Mix designs on several projects indicate high dust contents and low asphalt contents for RAP mixes. 18
19 Barriers to Higher RAP Contents History and Perceptions Performance of high RAP content pavements Concerns about quality and consistency of RAP Technology Limitations Current mix design system Relies on VMA & therefore aggregate bulk specific gravities Does not adequately consider composite binder properties Need for reliable performance tests 19
20 NCAT Research on Using Recycled Materials NCHRP 9-46: high RAP content mix design Lab studies on how to improve cracking resistance for mixes containing RAP and RAS NCHRP 9-53: Combining RAS & WMA Test Track experiments in 3 rd, 4 th, 5 th, and 6 th cycles High RAP contents RAS GTR


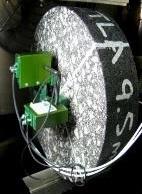
21 RAP Aggregate Bulk Specific Gravity Method 1: Recover aggregate using a solvent extraction, then conduct AASHTO T84 and T85 on the fine and course fractions like any other aggregate. Method 2: Recover aggregate by the ignition method, then conduct AASHTO T84 and T85 on the fine and course fractions like any other aggregate. 21
22 RAP Aggregate Bulk Specific Gravity Method 3: Estimated G sb from G mm & P ba 1. Determine G mm (w/ dryback) of RAP sample 2. Calculate G se using Eq. 1: G se ( RAP) = Equation G mm( RAP) P b ( RAP) P b ( RAP) G b 3. Estimate the absorbed asphalt, P ba, based on historical values for the plant location. 4. Calculate G sb using Eq. 2: G sb ( RAP) = P Equation 2 ba G G se ( RAP) 100 G se( RAP) b
23 Recommendations RAP Aggregate Gsb One method of determining RAP aggregate Gsb will not work for all material types. Agencies should evaluate options to find the best method for their materials. The method that gives the lowest Gsb will result in the lowest mix VMA. This is desirable since it will lead to higher asphalt contents and better durability. 23


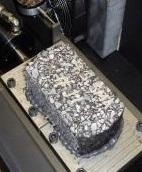
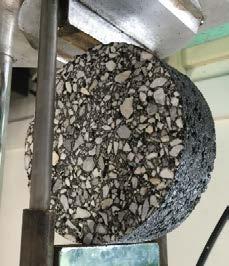
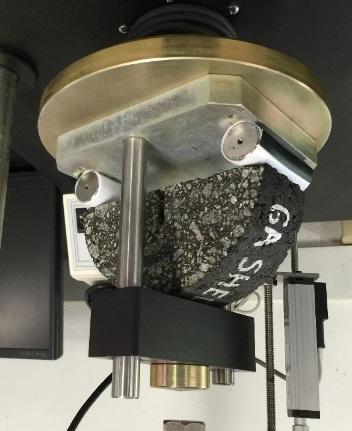
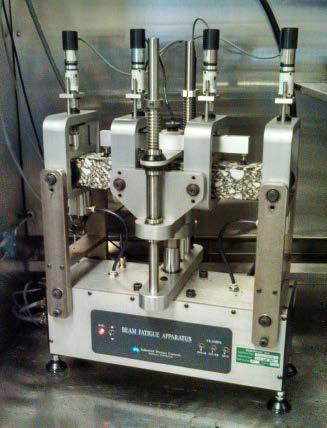
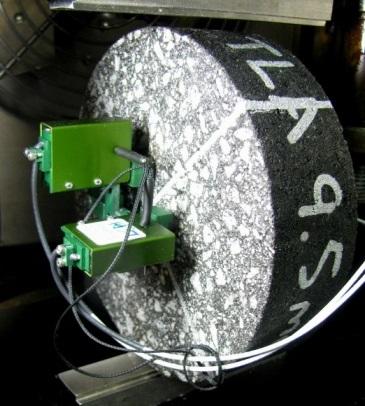
24 Some Tests for Assessing Cracking Resistance BBF SCB-LA I-FIT OT-TX OT-NCAT SVECD DCT Energy Ratio Nflex Factor Cantabro 24

25 NCAT Test Track 2006: Moderate and High RAP Content Surface Mixes Mixes with 20% and 45% RAP performed very well 30 million ESALS over 8 years Minor differences in cracking support the use of softer binder for high RAP content mixes Lab Tests: Bending Beam Fatigue, Energy Ratio, Texas Overlay Tester Best correlation with top-down cracking in sections was IDT Creep Rate 25

26 NCAT Test Track 2009: Virgin versus 50% High RAP Content All Layers Mixes with and without WMA All sections performed very well 50% HMA section no distress through 20 million ESALS Lab Tests: BBF, Overlay Tester, SVECD Best correlation with observed fatigue cracking was OT results extrapolated to measured strain level 26


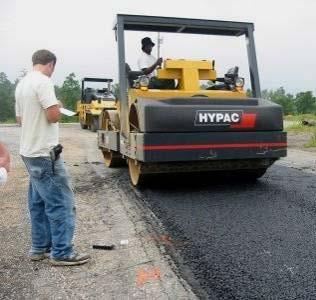
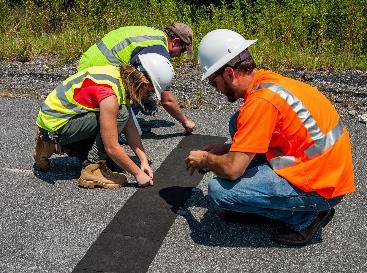
27 Cold Central Plant Recycling Sponsored by Virginia DOT Processed RAP 2% foamed asphalt and 1% cement Serves as base layer with overlays of 4 inches and 6 inches Objective: quantify the structural contribution (empirical and M-E) Performance has been outstanding no distress 11 MESALs and counting 27

28 NCAT Test Track 2015: Cracking Group Experiment: Top-Down Focus 7 surface mixes with a range of expected cracking resistance Lab Tests: I-FIT, SCB-LTRC, Overlay Test, Energy Ratio, & others 28


29 2016 MnROAD Thermal Cracking Experiment


30 Recycled Asphalt Shingles Usage Percentage, % DOTs Other Agencies Commercial & Residential Hansen and Copeland, Annual Asphalt Pavement Industry Survey on Recycled Materials and Warm-Mix Asphalt Usage:


31 Recycling Asphalt Shingles Currently used in about 37 states, but routinely for state DOT projects in only about a dozen states Typically 3 to 5% RAS by weight of mix Field performance has been mixed Mix design approaches continue to evolve 31

32 Performance of Mixes with RAS Virgin Mix PG SBS Virgin Mix PG GTR 20% RAP Mix PG SBS 20% RAP + 5% RAS PG SBS 32
33 Research and future directions Validation of mix cracking tests Balanced mix designs will replace volumetric-based mix designs Rejuvenator formulations will mature Much higher RAP content asphalt mixtures Cold recycled 100% RAP (with some minor additives) as base layer for heavy traffic roads and as a primary structural layer in light traffic pavements. 33
34 Thank You! 34