Network Design Analysis
|
|
|
- Meryl Sanders
- 5 years ago
- Views:
Transcription
1 Network Design Analysis Contract (Grant) # PGA Task 2.3 presented to Air Improvement Resources Technical Committee presented by Lyle Hufstetler Natural Resources Transportation Specialist March 6, 2017 The preparation of this report was financed through grants from the State of Texas through the Texas Commission on Environmental Quality. The content, finding, opinions and conclusions are the work of the authors and do not necessarily represent findings, opinions or conclusions of the TCEQ.
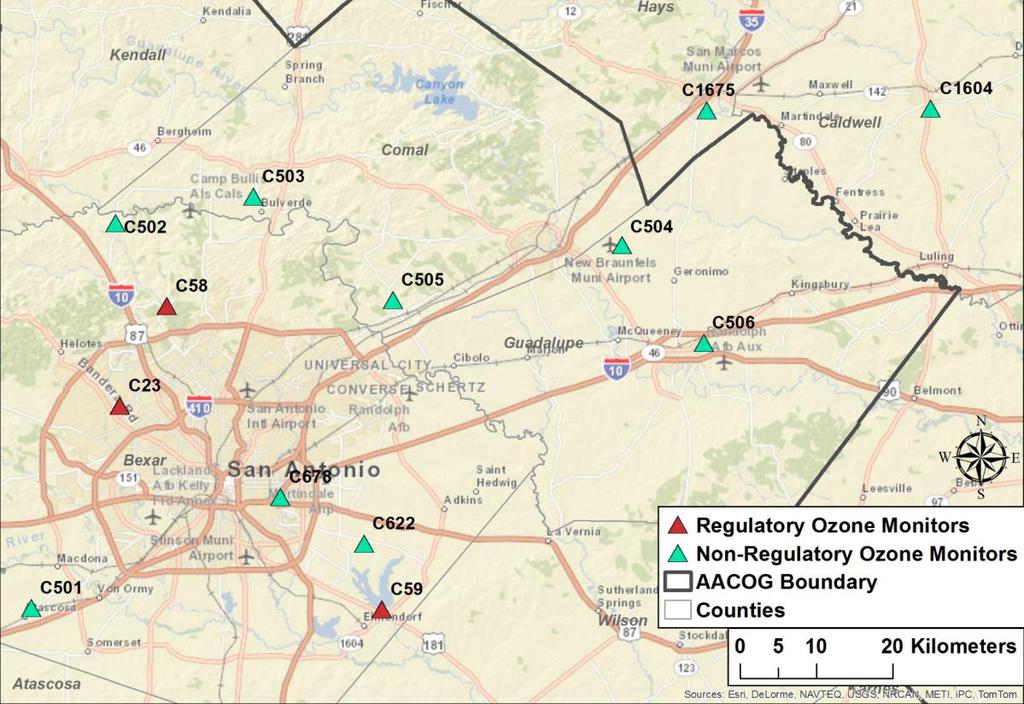
2 Provides an assessment of the current monitoring network Identifies redundancies among monitors Identifies gaps in monitor coverage Ensures network fulfills monitoring goals established by EPA, TCEQ, and AACOG This network analysis focuses on ozone, NO X, VOC, and meteorological monitoring networks EPA has defined three types of analysis for network assessments Site-by-site Bottom-up Network Optimization This is the first formal network assessment conducted by AACOG
3
4 R-squared (R 2 ) is a measure of correlation between pairs of data. Its value represents the proportion of variance in the dependent variable that is reduced by taking into account the independent variable. Values may range from 0 to 1. Monitor pairs that are highly correlated (R 2 closer to 1) may be considered redundant in the context of the network as a whole. Monitor pairs that are not highly correlated (R 2 closer to 0) tend to provide more unique data. Monitor Average R- squared Rank C C C C C C C C C C C

5 June 2006 Episode June 2012 Episode


6 CPS Energy Calaveras Power Plants Alamo Cement San Miguel Power Plant

7 Site conditions at CAMS 502 are no longer suitable for air monitoring. This monitor will be relocated as close as possible to its current location.
8 Task Additional Monitoring QAPP has been approved by TCEQ. AACOG is working with the City of San Antonio, San Antonio Water System, and CPS Energy to secure sites for a new ozone monitor in western Bexar County and the relocation of CAMS 502 in far northwestern Bexar County. Other options for potential sites include schools, airports, fire stations, and other municipal facilities. At this time, the AACOG additional monitoring budget only provides for one new ozone monitor. An Ozone Monitoring Subcommittee has been established, whose members will help guide the siting and implementation of the new ozone monitor, as well as the relocation of CAMS 502. TCEQ is working with various university researchers on an extensive meteorological and ozone monitoring project in May and June involving a sodar, with plans to locate it at Eisenhower Park. AACOG is interested in purchasing the sodar from TCEQ after the project is completed.
9 Why I JOINED AACOG
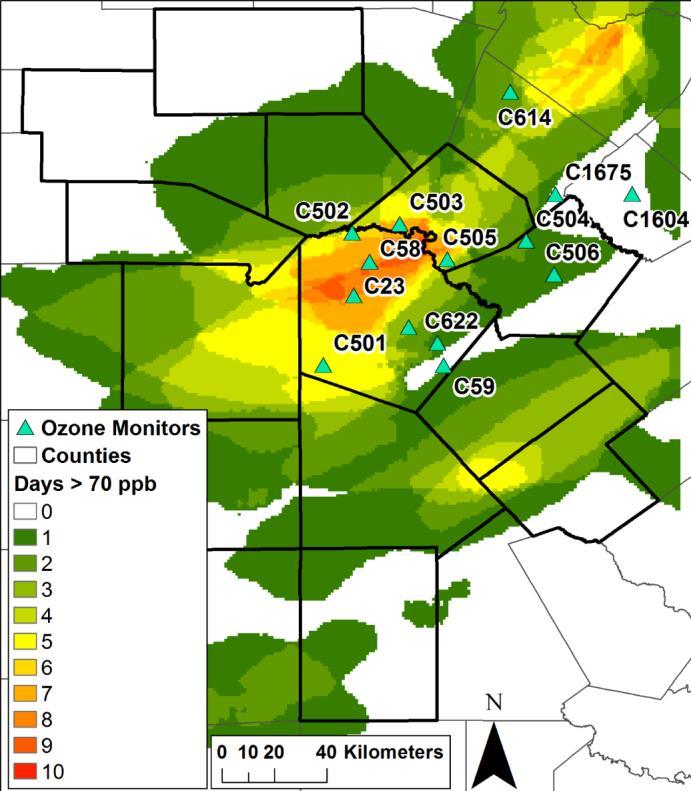
10 Types of Monitoring Sites Record the highest concentrations expected to occur in the area Measure typical concentrations in areas of high population density Determine the impact of significant sources or source categories on air quality Determine general background concentration levels Determine the extent of regional pollutant transport among populated areas Measure air pollution impacts on visibility, vegetation damage, or other welfare impacts EPA and TCEQ Monitoring Goals Provide air pollution data to the general public in a timely manner Support compliance with ambient air quality standards and emissions strategy development Support for air pollution research studies States must conduct network assessments every five years AACOG Monitoring Goals Augment existing regulatory monitoring network Assess population exposure to pollution levels Photochemical model performance verification Facilitate public awareness of ozone levels and associated health risks

11 Number of Parameters Monitored Trend Impacts (Duration of Operation) Measured Concentrations Area and Population Served Monitor-to-Monitor Correlation Monitor Average Correlation Correlation Score Rank CAMS CAMS CAMS CAMS CAMS CAMS CAMS CAMS CAMS CAMS CAMS

12 Back Trajectory Analysis Photochemical Modeling
13 Removal Bias Monitor 6/4/2013 7/4/2013 7/5/2013 9/25/2013 5/10/2014 7/23/2014 8/14/2014 C C C C C C C C Monitor 9/30/2014 8/3/2015 8/27/2015 8/28/2015 8/29/2015 Average Rank C C C C C C C C