Changes in the Ozone Standard: What will the impact be? February 9, 2016 Sara G. Smith
|
|
|
- Marion Crawford
- 5 years ago
- Views:
Transcription
1 Changes in the Ozone Standard: What will the impact be? February 9, 2016 Sara G. Smith What is Ozone? Ozone is a colorless, odorless gas composed of three oxygen atoms joined together. Most oxygen in the air is formed of two oxygen atoms connected together. It is both naturally occurring and created by man-made forces. It can be both beneficial and detrimental depending on where it is. Ozone in the stratosphere protects the earth from UV rays. Ozone close to earth is a main ingredient of smog and can be detrimental to breathing and plant life. Depletion of the ozone layer in the stratosphere has slowed, due to the change in chemicals found to deplete the ozone layer. Ozone close to earth is formed when nitrogen oxides (referred to as NOx) and volatile organic compounds (VOCs) chemically react in the presence of sunlight. It is not a gas that is emitted. Therefore, control of ozone close to earth can only be accomplished by controlling the constituents that create it. Prominent sources of NOx and VOC include electric utilities, industrial facilities, motor vehicle exhaust, gasoline vapors, and chemical solvents. Ozone negative impacts caused by breathing high levels can include chest pain, coughing, throat irritation, worsening of existing health problems like bronchitis, emphysema, and asthma. Ozone forms predominantly in hot weather, which is also a time when more people are outdoors and exposed to increased levels of ozone. What are National Ambient Air Quality Standards? The Clean Air Act requires EPA to establish national standards or National Ambient Air Quality Standards (NAAQS) for pollutants considered harmful to health and the environment. There are only six principal pollutants governed by the NAAQS: carbon monoxide, lead, nitrogen dioxide, ozone, particles, and sulfur dioxide.
2 As described by the Supreme Court in Whitman Administrator of EPA v. American Trucking Associations Inc. et al., (2001), Section 109(a) of the Clean Air Act (CAA), as added, 84 Stat. 1679, and amended, 42 U. S. C. 7409(a), the CAA requires the Administrator of the EPA to promulgate NAAQS for each air pollutant for which "air quality criteria" have been issued under 108, 42 U. S. C Once a NAAQS has been promulgated, the Administrator must review the standard (and the criteria on which it is based) "at five-year intervals" and make "such revisions... as may be appropriate." CAA 109(d)(1), 42 U. S. C. 7409(d)(1). In general, EPA reviews the NAAQS every five years, often making no changes. Once a standard has been set, the Clean Air Act requires states to develop plans to attain and maintain these standards. This is the SIP or state implementation plan. If a state does not adopt a SIP that meets the approval of EPA, the state may then be regulated under a Federal Implementation Plan or a FIP. Beginning in 1971, the standard was set at 0.80 parts per million, thirty years later the standard dropped to 0.75 parts per million in 2008 and further reduced to 0.70 ppm in While this does not seem like a large reduction, the impact is significant.
3 History of the National Ambient Air Quality Standards for Ozone During the Period Primary/ Rule/Decision Indicator (1) Averaging Level Time (2) Form FR 8186 Apr 30, FR 8202 Feb 8, FR Mar 9, FR Jul 18, FR Mar 27, FR Oct 26, 2015 Total photochemical oxidants 1 hour Not to be exceeded 0.08 ppm more than one hour per year Attainment is defined when the expected number of days per Final O3 1 hour calendar year, with 0.12 ppm maximum hourly average concentration greater than 0.12 ppm, is equal to or less than 1 EPA decided that revisions to the standards were not warranted at the time (1) O3 = ozone (2) Units of measure are in parts per million (ppm). O3 8 hours Annual fourth-highest daily maximum 8 hour 0.08 ppm average concentration, averaged over 3 years Annual fourth-highest O3 8 hours daily maximum 8 hour ppm average concentration, averaged over 3 years Annual fourth-highest O3 8 hours daily maximum 8 hour ppm average concentration, averaged over 3 years
4 Litigation following the final rule Immediately upon the publication of the final rule in October 2015, several lawsuits were filed challenging the new standard. Murray Energy Corporation, D.C. Cir. No (PFR filed Oct. 26, 2015), filed first, followed quickly by Arizona, Arkansas, New Mexico, North Dakota, and Oklahoma, D.C. Cir. No (PFR filed Oct. 27, 2015). On November 4, the D.C. Circuit Court consolidated the two cases. Additional filings were made by Texas, the U.S. Chamber of Commerce and the National Association of Manufacturers, among others. Also in November, a group of environmental and health organizations petitioned to intervene on behalf of EPA. This group included the American Lung Association, the Sierra Club, National Resources Defense Council and Physicians for Social Responsibility. The 60 day filing period ended in late December- 2015, just as the rule became effective. The cases are expected to revolve around the health effects of ozone and the difficulty or impossibility of achieving attainment with a standard that approaches background levels of ozone in many areas of the country. EPA has maintained that the only consideration it can take into account is the health effect of ozone. In making this claim, EPA relies on Whitman, Administrator of EPA v. American Trucking Associations, Inc., et al., (2001) No In American Trucking, the Court found that because the Clean Air Act often explicitly allows EPA to consider implementation costs in setting regulations, but does not do so in Section 109(b), it must be interpreted that costs are not to be considered. Development of a SIP With the new standard, states begin the process of developing a new SIP. This is a long process that begins with establishing a period of data to be reviewed and evaluated. It is likely that new designations will not be available until 2017 and will be based on data from 2014 through Based on that data set, areas that are nonattainment or at risk are identified and a package
5 of responses is drafted which is expected to result in attainment over a period of years. These actions can include significantly more stringent air permit limits for facilities within a nonattainment area. That means if a facility has a permit renewal, wants to expand and must revise their permit to reflect increased production, new or different equipment or processes, or if a new industry is located in a nonattainment area, the permit requirements will be substantially more difficult than at present. What will the impact be in business in Kentucky, when will be feel the change? Under the 2008 standard of ppm, portions of northern Kentucky as part of the Cincinnati area are considered out of attainment. With the standard dropping to ppm, many other areas are expected to be designated as threatened or non-attainment. Areas around Louisville, Henderson, Owensboro, Paducah, and Calvert City may be impacted. Nashville will likely be included. Because ozone is created from a number of constituent emissions, proximity to large transportation corridors can be a deciding factor. Of course proximity to large transportation corridors is also an attractive asset to industry and business. Because the data that will be evaluated is in some cases not in existence yet, it is hard to accurately determine the final list. There are a number of vivid maps predicting the impact of this new standard. The following map was prepared by API to predict impacted counties. According to API, areas in red are rural counties or counties within a metro area that have at least one monitor that currently violates a 0.70 ppm standard. The orange areas don t have monitors, but because there are violating monitors nearby it s reasonable to conclude that those areas could likely violate a 0.70 ppm standard.
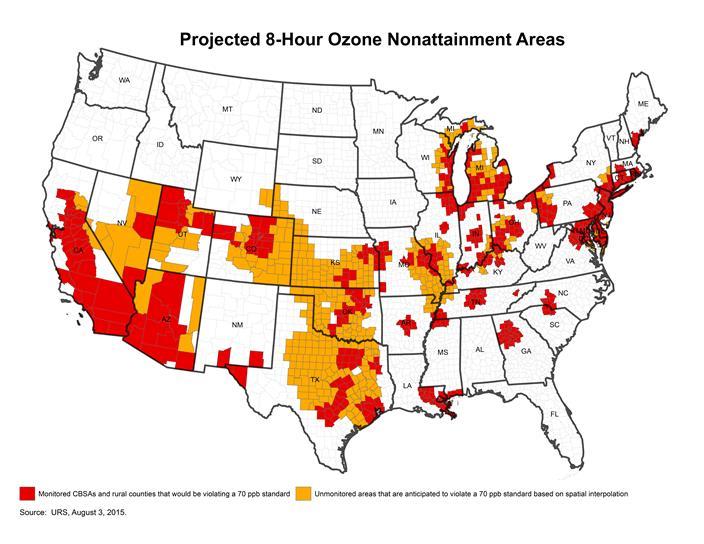
6

7 By contrast, the following map reflects the counties that are considered to be out of attainment or at risk under the prior standard of ppm. This map depicts EPA s final designation of ozone nonattainment areas under the 2008 standard. While we do not know which counties will be designated nonattainment, we do know that facilities can be impacted by stricter regulations and emission standards even if they are not within a nonattainment area. If the permitting authority believes that a facility may be contributing to a nonattainment area, it can and has required operating limits, lower emission levels, addition of new control equipment, and in one case the construction of a substantially taller stack at an enormous cost to the affected business.