Southern New Mexico Ozone Modeling Study Summary of Results: Tasks 9 and 10
|
|
|
- Louise Owen
- 5 years ago
- Views:
Transcription


1 Summary of Results: Tasks 9 and 10 Ramboll-Environ (RE) University of North Carolina (UNC-IE) June 3, 2016
2 SNMOS Background and Objectives The southern Doña Ana County region has the highest ozone levels of any area in New Mexico The southern Doña Ana County area is within 95% of the federal standard for ozone The New Mexico Air Quality Control Act requires the New Mexico Environment Department to develop a plan for reducing ozone levels in areas that are within 95% of the ozone standard The first step towards developing the plan is to understand the causes of high ozone in Doña Ana County SNMOS objectives: Study the factors contributing to high ozone in Doña Ana County Investigate future emissions scenarios that will produce attainment of the ozone standard 2
3 Overview of Approach SNMOS builds off of the Western Air Quality Study (WAQS) WAQS 2011 modeling platform: WRF/SMOKE/CAMx Adjustments to the meteorology and modeling domains to optimize for southern New Mexico Modeling 2011 New Mexico ozone season: May 1 August 31 Modeling Plan Prepare base year emission inventories Run WRF/SMOKE/CAMx for 2011 base year Evaluate 2011 base year model against observations, refine model if needed Prepare future year emission inventories for 2025 Run SMOKE/CAMx for future year Modeled Attainment Test Emissions sensitivity/control runs Source apportionment to diagnose causes of high ozone in Doña Ana County Reporting 3
4 SNMOS Tasks Completed Task 1: 2011 WRF 36/12/4 km with 4 km focus on Dona Ana/El Paso/Juarez and Work Plan (11/30/15) Task 2: 2011 update Permian Basin O&G (11/30/15) Task 3: 2011 update of Juarez and nearby Mexico EI, 2020 Mexico emissions update (11/30/15) Task 4: SMOKE current 2011 NEI for 4 km domain (2/29/16) Task 5: Gridded 2011 biogenic, fires, wind-blown dust, lightning emissions for 4 km domain (2/29/16) Task 6: Develop km CAMx database and perform base case (2/29/16) Task 7: 2011 MPE and sensitivity modeling for Dona Ana County (4/30/16) Task 8: SMOKE current FY US EI and FY Mexico emissions update (4/30/16) This Deliverable Period (May 31, 2016) Task 9: FY 12/4-km CAMx simulation Task 10: FY ozone projections (MATS) Pending Task 11: FY emissions sensitivity/controls Task 12: FY 4 km source apportionment run Task 13: Air Quality Technical Support Document (AQTSD) 4
5 Task 9: Future Year Air Quality Modeling Ramboll-Environ (RE) University of North Carolina (UNC-IE) June 3, 2016
6 Task 9: Objectives and Deliverables Objective Carry out SNMOS 2025 Base Case CAMx modeling (Completed 5/1/2016) Deliverables PowerPoint presentation on future year air quality modeling (Completed 5/31/2016) Tasks Run CAMx /4 km case with same as final 2011 CAMx modeling Compare 2011 and 2015 CAMx results at Doña Ana monitors Prepare PowerPoint 6
7 CAMx Air Quality Modeling CAMx configured as in SNMOS Base11b Modeling ozone, PM, N and S deposition CAMx v6.20* CB6r2 chemical mechanism, EBI solver Zhang dry deposition scheme WRF meteorology NAM ICBC with Multi-scale Kain-Fritsch WRFCAMx v4.4* with CMAQ-like Kv CAMx run for April August, 2025 (2011 dates) Emissions Primarily from EPA NEI2011 v6.2 modeling platform 2025 projection 2020 WAQS oil and gas projections Biogenic, lightning, fires, and sea salt constant at 2011 levels SNMOS Task 3 deliverable for Mexico future year EI details SNMOS Task 7 deliverable for US future year EI details * April release of CAMx v6.30 not used in this study to remain consistent with Base11b 7
8 CAMx Modeling Domains and Boundary Conditions 3SAQS 36 km grid 3D output fields used as BCs for the Dona Ana 12 km grid 12/4 km grids run in 2-way nested mode 3SAQS 36 km BCs 8
9 Task 9: Future Year CAMx Results Predicted ozone concentrations decrease in 2025 relative to 2011 Reductions in onroad mobile NOx emissions appear to be driving the ozone reductions Results Tileplots: 2011, 2025, and O 3, NOx, VOC Comparison of CAMx with emissions differences MDA8 O3 time series comparisons at Doña Ana County monitors 9


10 CAMx 12-km Monthly Max O June July Aug 10


11 CAMx 4-km Monthly Max O June July Aug 11


12 CAMx Difference in Monthly Max O km 12-km June July Aug 12


13 CAMx June Air Quality and Emissions: Diff Monthly Max O3 Diff Monthly Max NOx Diff Monthly Max VOC Emissions Diff Monthly Max NOx Diff Monthly Max TOG 13


14 CAMx June Air Quality and Emissions: Diff Monthly Max Emissions NOx: All Sectors TOG: All Sectors Diff Monthly Max O3 NOx: US Onroad Mobile TOG: Mexico Mobile 14


15 CAMx July Air Quality and Emissions: Diff Monthly Max O3 Diff Monthly Max NOx Diff Monthly Max VOC Emissions Diff Monthly Max NOx Diff Monthly Max TOG 15


16 Doña Ana County Monitors No. Site ID Start Year End Year Name present 750 N. SOLANO DRIVE present CHAPARRAL present LA UNION present SANTA TERESA present DESERT VIEW present SUNLAND PARK LAS CRUCES WELL STATION #41;HOLMAN ROAD HOLIDAY INN Active in 2011 Inactive in
17 CAMx 4-km Timeseries: Solano MDA8 (ppb) Obs Base11b Base2025a Absolute Bias (ppb) 17
")
")
18 CAMx 4-km Timeseries: Chaparral MDA8 (ppb) Obs Base11b Base2025a Absolute Bias (ppb) 18
")
")
19 CAMx 4-km Timeseries: La Uñion MDA8 (ppb) Obs Base11b Base2025a Absolute Bias (ppb) 19
 Obs Base11b Base2025a")
20 CAMx 4-km Timeseries: Sta. Teresa MDA8 (ppb) Obs Base11b Base2025a Absolute Bias (ppb) 20
 21")
21 CAMx 4-km Timeseries: Desert View MDA8 (ppb) Obs Base11b Base2025a Absolute Bias (ppb) 21
22 CAMx 4-km Timeseries: Sunland Park MDA8 (ppb) Obs Base11b Base2025a Absolute Bias (ppb) 22


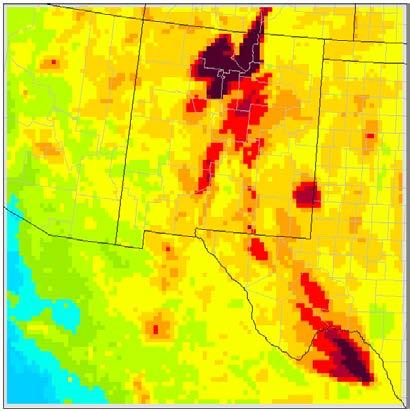
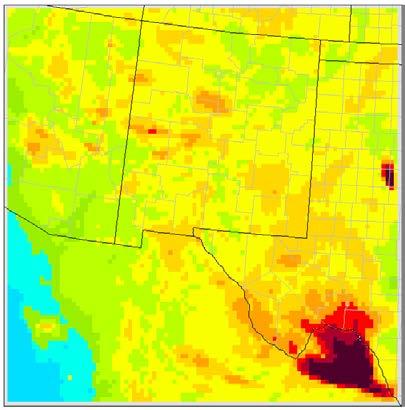
23 June 22, 2011 Model Performance Daily Maximum 1-hour O


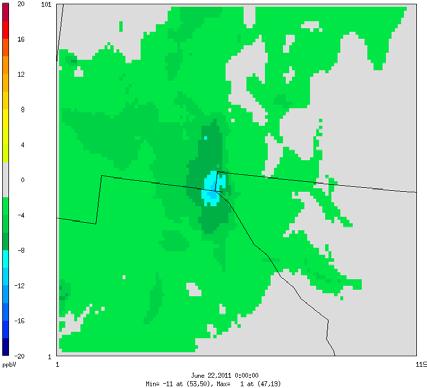
24 June 22, 2011 Model Performance Daily Maximum 1-hour O3 and NOx Differences 2011 Daily Max O Daily Max O Daily Max NOx [NOx] Reductions 24


25 August 5, 2011 Model Performance Daily Maximum 1-hour O


26 August 5, 2011 Model Performance Meteorology Drivers Daily Max O Daily Max NOx 2011 Daily Max O3 [NOx] Reductions Too DRY Winds are Too CALM 2025 Daily Max O3 Too HOT Wind Direction is Good 26


27 June 7, 2011 Model Performance Fire Emissions Impacts on Modeled Daily Maximum O
28 Task 9 Summary Onroad mobile NOx and VOC emissions are driving the majority of the anthropogenic emissions changes NOx emissions changes are generally associated with the monthly max O3 changes Finer temporal and spatial scale differences require further investigation Differences plots between 2011 and 2025 highlight influence of anthropogenic emissions changes (natural held constant) Errors in the base model predictions are influenced by fires and meteorology 28
29 Task 10: Future Year Ozone Projections University of North Carolina (UNC-IE) Ramboll-Environ (RE) June 3, 2016
30 Task 10 Objectives and Deliverables Objective Conduct a model attainment test to estimate future design values (DVFs), relative response factors (RRFs), and unmonitored area analysis (UAA) for SNMOS 12 and 4-km modeling domains Deliverables Power Point Presentation on future year ozone projections (Completed 5/31/2016) Tasks Use the EPA Modeled Attainment Test Software (MATS) version to estimate DVFs and RRFs using EPA default MATS configuration (Completed 5/19/2016) Use MATS to estimate DVFs and RRFs using top 10 high performing (bias < 10%) days at each monitor (Completed 5/31/2016) Create plots of current DVs, DVFs, RRFs, and UAA (Completed 5/31/2016) Prepare a Power Point presentation on attainment test results (Completed 5/31/2016) 30
31 Attainment Test Definitions Current Design Value (DVC) A statistic that describes the air quality status of a given location relative to the level of the National Ambient Air Quality Standards (NAAQS). Relative Response Factor (RRF) Ratio of future year modeled concentration predicted near a monitor (averaged over multiple days) to the base year modeled concentration (averaged over the same days) Future Design Value (DVF) DVF i = DVC i * RRF i for monitor site i Unmonitored Area Analysis (UAA) Model adjusted baseline monitor values in each grid cell. MATS identifies the "neighbor" monitors for each grid cell, it adjusts the monitor values to account for the modeled spatial gradient, and then calculates an inverse-distance-weighted average of the monitor values. 31
32 Model Attainment Test Software (MATS) EPA software for estimating future year attainment (design values) at monitors RRFs EPA configuration from December 2014 Attainment Modeling Guidance used for SNMOS 3x3 matrix of model cells around monitor for both 12 and 4km domains Inverse distance weighting for interpolation Three DVs over 5 years ( ) RRFs based on top 10 modeled MDA8 ozone days 60 ppb threshold with minimum 5 days above threshold required to include a monitor in the DVF and RRF calculation 32
33 Model Attainment Test Software (MATS) Attainment Test Steps Step 1: Calculate DVC for each site For ozone, DV is the three-year average of the 4 th highest daily maximum 8- hr average O3 (MDA8 4 ) DV 2011 = (MDA8 4, MDA8 4, MDA8 4,2011 )/3 Weighted 5-year average of design values centered on the inventory year DVC 2011 = (DV DV DV 2013 )/3 Step 2: Find top 10 model days surrounding each site Find ten days with highest modeled MDA8 in a 3x3 matrix of cells surrounding each monitor Only days with MDA8 >= 60 ppb are used Step 3: Calculate RRF for each site Average base and future MDA8 for the eligible (top 10) days RRF = MDA8 f,avg /MDA8 b,avg Step 4: Calculate DVF for each site DVF = RRF * DVC
34 Model Attainment Test Software (MATS) Unmonitored Area Analysis (UAA) Interpolate DVCs to each grid cell in the 4 km and 12 km domains Use Voronoi Nearest Neighbor Uses modeled 2011 concentration gradients in the interpolation Use modeled RRFs in each grid cell to develop spatial distribution of 2025 DVFs UAA future year projections have more uncertainties than monitor-based projections
35 SNMOS MATS 12-km Domain Results DVC (2011) DVF (2025) RRF (2025/2011) Exceeds Oct 2015 ozone NAAQS 71.0 ppb 35


36 SNMOS MATS 12-km Domain Results Unmonitored Area Analysis DVC (2011) DVF (2025) 4-km Exceeds Oct 2015 ozone NAAQS 71.0 ppb 36
37 SNMOS MATS 12-km Domain Results New Mexico Counties Site ID DVC DVF RRF County Site Name Bernalillo 4700A SAN MATEO NE (2ZM) Bernalillo 6000 ANDERSON AVENUE SE Bernalillo 5100 MONTANO BLVD NW Bernalillo 201 PROSPERITY SW Bernalillo Bernalillo 1.4 MILES WSW INTERSECTION TRAMWAY Bernalillo 9819A SECOND STREET NW Dona Ana LA UNION Dona Ana SUNLAND PARK Dona Ana LAS CRUCES WELL STATION #41;HOLMAN ROAD Dona Ana CHAPARRAL Dona Ana DESERT VIEW Dona Ana SANTA TERESA Dona Ana 750 N.SOLANO DRIVE Dona Ana HOLIDAY INN Eddy HOLLAND ST;SE OF WATER TANK;CARLSBAD;NM Grant CHINO BLVD NR HURLEY PARK; HURLEY;NM Lea 2320 N. JEFFERSON ST; HOBBS; NEW MEXICO Luna 310 AIRPORT ROAD; DEMING; NM Sandoval HIGHWAY DEPT. YARD NEAR BERNALILLO Sandoval 040 TRADING POST ROAD San Juan 162 HWAY 544; BLOOMFIELD NM San Juan 423 HWAY 539; BLANCO NM San Juan USBR SHIPROCK SUBSTATION (FARMINGTON) Santa Fe 2001 Aviation Drive, Santa Fe Valencia 1000 W. MAIN ST; LOS LUNAS; NM
38 SNMOS MATS 4-km Domain Results DVC (2011) DVF (2025) RRF (2025/2011) 38
39 SNMOS MATS 4-km Domain Results Unmonitored Area Analysis DVC (2011) DVF (2025) Exceeds Oct 2015 ozone NAAQS 71.0 ppb 39
 DVF (2025) Model")

40 SNMOS MATS 4-km Domain Results Unmonitored Area Analysis DVC (2011) DVF (2025) Model Concentration Gradient Spatial Interpolation Spatial Interpolation with Observations Only 40
41 SNMOS MATS 4-km Domain Results Site ID DVC DVF RRF County Site Name Dona Ana LA UNION Dona Ana SUNLAND PARK Dona Ana LAS CRUCES WELL STATION #41;HOLMAN ROAD Dona Ana CHAPARRAL Dona Ana DESERT VIEW Dona Ana SANTA TERESA Dona Ana 750 N.SOLANO DRIVE Dona Ana HOLIDAY INN Eddy HOLLAND ST;SE OF WATER TANK;CARLSBAD;NM Grant CHINO BLVD NR HURLEY PARK; HURLEY;NM Luna 310 AIRPORT ROAD; DEMING; NM El Paso IVANHOE; IVANHOE FIRE STATION El Paso RIM RD. NEAR HAWTHORNE NEXT TO UT POLICE El Paso 800 S. SAN MARCIAL STREET El Paso 650 R.E. THOMASON LOOP El Paso 201 S. NEVAREZ RD El Paso 5050 A YVETTE DRIVE 41
42 MATS Sensitivity Configurations Use the 4-km domain to test how different MATS configurations change the DVF and RRF results Spatial Matrix Experiment (7x7) Maximum concentration from a matrix of modeled grid cells surrounding a monitor is used in the DVF calculation Current EPA guidance is a 3x3 matrix (9 cells) Experiment uses a 7x7 matrix (49 cells, previous EPA guidance) Temporal Averaging Experiment (5 days) DVFs and RRFs calculated from top X modeled MDA8 ozone days Current EPA guidance is top 10 days Experiment uses top 5 days 42
43 DVF RRF SNMOS MATS 4-km Domain Sensitivity Results Base (3x3 10-days) 7x7 10-days 3x3 5-days Note the scales are adjusted to highlight the changes between the runs 43
44 SNMOS MATS 4-km Domain Sensitivity Results Future Design Values DVF DVF DVF % Diff % Diff Site ID DVC (Base) (7x7) (5 days) (Base 7x7) (Base 5 days) Site Name % -1.03% LA UNION % 0.33% SUNLAND PARK % -1.64% CHAPARRAL % -0.92% DESERT VIEW % 0.16% SANTA TERESA % 0.51% 750 N.SOLANO DRIVE Relative Response Factors RRF RRF RRF % Diff % Diff Site ID DVC (Base) (7x7) (5 days) (Base 7x7) (Base 5 days) Site Name % -1.07% LA UNION % 0.36% SUNLAND PARK % -1.64% CHAPARRAL % -1.05% DESERT VIEW % 0.14% SANTA TERESA % 0.44% 750 N.SOLANO DRIVE 44
45 Model Attainment Test Software (MATS) Alternative attainment test uses only top 10 MDA8 ozone days with bias <= 10% Different days for each monitor Requires a separate MATS run for each monitor Only conducted for monitors in Dona Ana county and for the 4-km simulation See supplemental materials for all data used for this test Example for Top 2 MDA8 ozone days at Dona Ana county monitors with bias < 10% La Union Sunland Park Chaparral Date OBS MOD BIAS BIAS% Date OBS MOD BIAS BIAS% Date OBS MOD BIAS BIAS% 7/28/ % 6/22/ % 8/6/ % 7/29/ % 7/7/ % 6/15/ % Desert View Santa Teresa Solano Date OBS MOD BIAS BIAS% Date OBS MOD BIAS BIAS% Date OBS MOD BIAS BIAS% 6/22/ % 6/22/ % 8/6/ % 7/8/ % 8/27/ % 8/5/ % 45
46 SNMOS Alternative MATS 4-km Domain Results DVC (2011) DVF (2025) RRF (2025/2011) Site ID DVC DVF (Base) DVF (Bias < 10%) RRF (Base) RRF (Bias < 10%) Site Name LA UNION SUNLAND PARK CHAPARRAL DESERT VIEW SANTA TERESA N.SOLANO DRIVE 46

47 SNMOS MATS 4-km Domain Design Value Interpolation Linear interpolation of the 4-km domain SNMOS MATS (3x3, 10 day average) results to years between 2011 and Dona Ana County 4km DVFs Site Name LA UNION SUNLAND PARK CHAPARRAL DESERT VIEW SANTA TERESA SOLANO 47
48 SNMOS MATS 4-km Domain Design Value Interpolation RRF DVF 48
49 Task 10 Summary MATS projects DVFs for all active Doña County monitors to be below the hr standard (70 ppb). Unmonitored area analysis shows that all but a few cells in the 4-km domain (northern Grant Co.) will be in attainment in MATS configuration sensitivities produced little impact on the DVF predictions The O 3 bias filtering changed the DVF predictions by upto a few percent, but did not impact future year attainment status Linear interpolation of the MATS DVs does not follow the EPA reported DVs. The 2011 DV is an historically low value relative to the surrounding years and skews the interpolation. 49
50 Next Steps Tasks to be Completed by August 15, 2016 Task 1: 2011 WRF 36/12/4 km with 4 km focus on Dona Ana/El Paso/Juarez and Work Plan (Completed) Task 2: 2011 update Permian Basin O&G (Completed) Task 3: 2011 update of Juarez and nearby Mexico EI, 2020 Mexico emissions update (Completed) Task 4: SMOKE current 2011 NEI for 4 km domain (2/29/16) Task 5: Gridded 2011 biogenic, fires, wind-blown dust, lightning emissions for 4 km domain (2/29/16) Task 6: Develop km CAMx database and perform base case (2/29/16) Task 7: 2011 MPE and sensitivity modeling for Dona Ana County (4/30/16) Task 8: SMOKE current FY US EI and FY Mexico emissions update (4/30/16) Task 9: FY 4 km CAMx simulation (5/31/16) Task 10: FY ozone projections (MATS) (5/31/16) Task 11: FY emissions sensitivity/controls (8/15/16) Task 12: FY 4 km source apportionment run (9/15/16) Task 13: Air Quality Technical Support Document (11/18/16) 50
51 Task 11: Future year emissions sensitivity/control modeling Objectives Conduct future year emissions sensitivities to evaluate the impacts of emissions reductions on attainment of the ozone NAAQS. Deliverables Power Point presentation on future year emissions sensitivity modeling. (8/15/2016) Tasks Coordinate with NMED to implement current and future emissions control programs in the model. Use MATS to estimate future year design values and RRFs for the emissions sensitivity simulations. Task 11 sensitivity study ideas Impacts of on-road mobile projections Fire inventory El Paso, TX/Ciudad Juarez NOx emissions Zero all Mexico anthropogenic NOx emission 51
52 Supplementary Materials 52
53 Monitored and 4-km CAMx Results All Days & Bias < 10% Days La Union ( ) Top 10 Modeled All Days Top 10 Modeled Bias < 10% Date OBS MOD BIAS BIAS% Date OBS MOD BIAS BIAS% 8/7/ % 7/28/ % 8/2/ % 7/29/ % 7/23/ % 8/21/ % 7/25/ % 8/3/ % 8/5/ % 5/25/ % 7/21/ % 8/19/ % 8/4/ % 5/24/ % 7/8/ % 7/12/ % 6/22/ % 8/20/ % 6/27/ % 7/13/ % Top 10 AQS Observed Values Top 10 CAMx Modeled Values 53
54 Monitored and 4-km CAMx Results All Days & Bias < 10% Days Sunland Park ( ) Top 10 Modeled All Days Top 10 Modeled Bias < 10% Date OBS MOD BIAS BIAS% Date OBS MOD BIAS BIAS% 8/5/ % 6/22/ % 8/7/ % 7/7/ % 7/21/ % 7/28/ % 8/30/ % 8/27/ % 7/25/ % 8/2/ % 8/4/ % 6/15/ % 8/29/ % 6/26/ % 7/9/ % 8/22/ % 8/28/ % 6/27/ % 6/22/ % 8/8/ % Top 10 AQS Observed Values Top 10 CAMx Modeled Values 54
55 Monitored and 4-km CAMx Results All Days & Bias < 10% Days Chaparral ( ) Top 10 Modeled All Days Top 10 Modeled Bias < 10% Date OBS MOD BIAS BIAS% Date OBS MOD BIAS BIAS% 8/5/ % 8/6/ % 8/29/ % 6/15/ % 7/26/ % 7/28/ % 7/27/ % 6/23/ % 7/22/ % 8/9/ % 8/4/ % 8/19/ % 7/25/ % 5/26/ % 7/21/ % 6/4/ % 8/7/ % 8/20/ % 8/16/ % 6/5/ % Top 10 AQS Observed Values Top 10 CAMx Modeled Values 55
56 Monitored and 4-km CAMx Results All Days & Bias < 10% Days Desert View ( ) Top 10 Modeled All Days Top 10 Modeled Bias < 10% Date OBS MOD BIAS BIAS% Date OBS MOD BIAS BIAS% 8/5/ % 6/22/ % 8/7/ % 7/8/ % 7/21/ % 8/28/ % 8/4/ % 7/28/ % 6/22/ % 8/18/ % 7/9/ % 8/27/ % 7/20/ % 8/6/ % 7/25/ % 8/2/ % 7/8/ % 6/26/ % 8/30/ % 8/22/ % Top 10 AQS Observed Values Top 10 CAMx Modeled Values 56
57 Monitored and 4-km CAMx Results All Days & Bias < 10% Days Santa Teresa ( ) Top 10 Modeled All Days Top 10 Modeled Bias < 10% Date OBS MOD BIAS BIAS% Date OBS MOD BIAS BIAS% 8/4/ % 6/22/ % 8/7/ % 8/27/ % 8/5/ % 8/22/ % 7/7/ % 8/23/ % 7/8/ % 8/18/ % 6/22/ % 8/6/ % 7/9/ % 6/26/ % 7/28/ % 7/29/ % 7/25/ % 7/10/ % 8/26/ % 8/3/ % Top 10 AQS Observed Values Top 10 CAMx Modeled Values 57
58 Monitored and 4-km CAMx Results All Days & Bias < 10% Days Solano ( ) Top 10 Modeled All Days Top 10 Modeled Bias < 10% Date OBS MOD BIAS BIAS% Date OBS MOD BIAS BIAS% 8/7/ % 8/6/ % 7/25/ % 8/5/ % 8/28/ % 8/27/ % 8/6/ % 7/27/ % 8/4/ % 6/15/ % 8/5/ % 6/27/ % 7/21/ % 6/22/ % 7/23/ % 7/28/ % 7/7/ % 7/29/ % 8/27/ % 8/8/ % Top 10 AQS Observed Values Top 10 CAMx Modeled Values 58