Conventional and Unconventional Oil and Gas
|
|
|
- Catherine Sutton
- 5 years ago
- Views:
Transcription
1 Conventional and Unconventional Oil and Gas What is changing in the world? Iain Bartholomew, Subsurface Director Siccar Point Energy
2 Discussion outline 1. Conventional oil and gas - E&P life-cycle - How it all works - Business risk: scale and exposure 2. Unconventional oil and gas - What is it and how does it work? - North American story - What about the UK? 3. What s happening today? 2
3 Conventional oil and gas resources 3
4 The exploration and production life-cycle of a conventional field North Sea offshore 350 million barrel oil field example 4

5 The exploration and production life-cycle of a conventional field North Sea offshore 350 million barrel oil field example 5


6 Huge sensitivity to performance and price North Sea offshore 350 million barrel oil field example 6

7 Sustainable production is the goal for E&P companies 7


8 How it all works under the ground 8

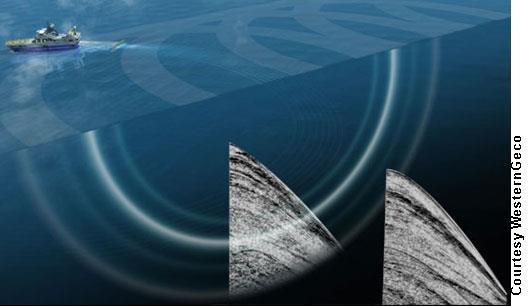
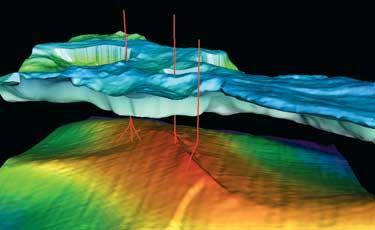
9 How it all works exploration to appraisal 9

10 How it all works development to production 10

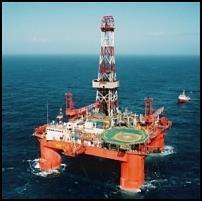
11 Lots of development options Typical structures Land rig Fixed platform Jack-up Semi-submersible Floating production and storage facility Floating Platform 11
 - Willing to take a risk!")
12 Risks in E&P Technical Market (including infrastructure) Political Security Price Mitigation - Technological innovation - Balanced portfolio - Partnerships - Understanding of potential outcomes - Risked valuations (including EMV calculation) - Willing to take a risk!! 12
13 Unconventional oil and gas resources 13


14 Conventional versus unconventional oil and gas 1 5 bcf per well bcf per well 14
 Hydrocarbon content and maturity - High TOC good - but high TOC is usually ductile rock (not good) Depth (> 5000 feet) Energy")

15 Geology is key to unconventional success Frackability - Brittleness is good (quartz content) - Clay is bad - Fracture barriers (good or bad) Hydrocarbon content and maturity - High TOC good - but high TOC is usually ductile rock (not good) Depth (> 5000 feet) Energy for production - Pressure (small over-pressure is good) Structural complexity (simple is good) - Understanding of regional stress important Pictures are from the Utica shale, Canada (A primer for understanding Canadian shale gas, National Energy Board, Canada, 2009) 15
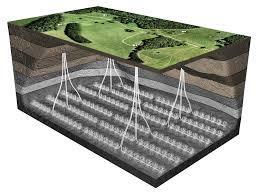
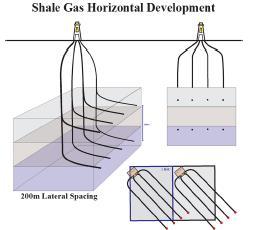
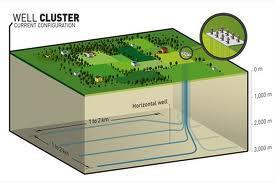
16 Shale exploitation techniques 16

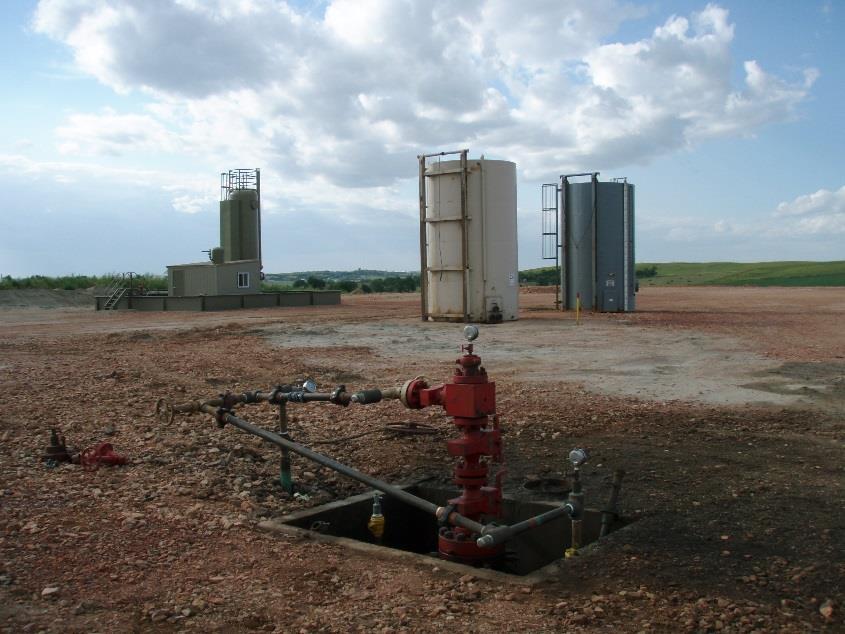
17 Shale well operations 17
 Peak gas rates range from 0 5 mmcfpd Single wells produce 2.5 4.")
18 Huge variation in a single play: Eg: Haynesville (US) Peak Gas Rate (MMcfpd/1,000ft, 30 Day Average) Average cumulative production per well (bcf) Peak gas rates range from 0 5 mmcfpd Single wells produce bcf during their life Data from drillinginfo database 18
19 Unconventional oil and gas resources: the US story 19
 46 TCF produced to end 2013; 665 TCF remaining technically recoverable* Current domestic US demand *")
20 The US shale gas revolution Dependency on shale gas to meet demand 45% of gas production in US is now from shale In 2013 US gas consumption was 26 TCF. 26 TCF was produced (12 TCF from shale) 46 TCF produced to end 2013; 665 TCF remaining technically recoverable* Current domestic US demand * 20
 In 2013 US oil consumption was 18.")
21 closely followed by oil from shale >50% of oil production in US is now from shale (~5.2 million barrels per day) In 2013 US oil consumption was 18.9 million barrels per day 58 billion barrels remaining technically recoverable* 21
22 The US shale story Big tax incentives early on - Federal Tax Section 29 nonconventional fuels production tax credit (on tight wells drilled between ) Lots of experimentation early on - Antrim Shale: first development in 1965: 1,200 wells drilled in tax credit period (natural fractures) 3.3 TCF produced to date - Barnett Shale: 275 vertical wells drilled in tax credit period. Slick water frac breakthrough in Horizontal development drilling starts in Experimentation continues in fracking 13 TCF produced to date Technological breakthroughs - Horizontal drilling - Hydraulic fracturing 22

23 US shale: scale of operations Huge scale of operation - 1,600 land rigs in operation in US - 36,000 wells drilled in 2013 Over 30,000 wells are currently on production from shales. - For oil on average each well produces 315 barrels oil per day - For gas on average each well produces 1.6 million standard cubic feet per day Very high level of drilling must continue in order to sustain production as individual wells only have 1-5 year economic life No. of horizontal wells drilled per year ~23,000 horizontal wells in 2013 Typical oil production from a single Bakken well 23
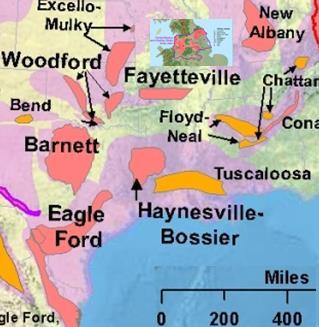
24 Where does it all come from? 64 key shale plays 28 are pure shale 36 are hybrid Huge variation in liquids content 24


25 BUT only a few plays have production 6 shale plays are bulk of production* 126 TCF and 2.4 billion barrels already produced by end 2013* These plays alone have potential to still produce 800 TCF and 13 billion barrels * Includes Bakken which is a hybrid play 25

26 So why does it work in the US? From a presentation by: 26

27 Canada? Huge resources but needs LNG export 27
 Getting shale gas working")
28 The UK: setting the scene Source: IoD report (2014) Getting shale gas working 28

29 UK US area comparison 29

30 UK: how do we compare? Very small areas compared to North America Structurally complex basins Much thicker shale sequences and therefore volumes could still be interesting BGS/DECC estimate ~1,300 TCF GIIP for Bowland (P50) - BUT??? recovery factor and commerciality In the UK we are still very much in the EXPLORATION stage we will have to wait and see From Andrews (2013) The Carboniferous Bowland Shale gas study: geology and resources estimation. BGS/DECC 30

31 World rankings for shale resources 31
32 Today s uncertain world 32


33 Oil price a global commodity 33


34 Gas price not yet global UK NBP $US/mmBTU 34

35 ANY QUESTIONS? 35