Assessing Soil Biological Activity as an Indicator of Soil Health
|
|
|
- Drusilla Nelson
- 5 years ago
- Views:
Transcription


1 Assessing Soil Biological Activity as an Indicator of Soil Health Alan Franzluebbers Ecologist, Raleigh NC


2 The problem N 2 O $ Fossil-fuel energy
 Might assume the difference would be from inorganic fertilizer input -")
3 The reality Relative Yield (fraction) Assume 200 bu/a corn - grain with 1.5% N = 168 lb N/a - stover with 1.0% N = 112 lb N/a - total N need is 280 lb N/a From 412 samples in NC - inorganic N = lb N/a (0-12 depth) Might assume the difference would be from inorganic fertilizer input - organic N = lb N/a Available Nitrogen (kg ha -1 )


4 Fertilizer >. Surface-soil inorganic N Deepprofile residual inorganic N Surface 1 depth 2 depth 3 depth 4 depth Nitrogen availability to crops Mineralizable nitrogen a.ka. biologically active nitrogen Loss mechanisms Runoff Leaching Volatilization Denitrification Additional inputs Biological N fixation Compost Precipitation / dust Irrigation water Limits to availability Soil temperature Soil moisture Root accessibility Binding to clays Binding to organic matter


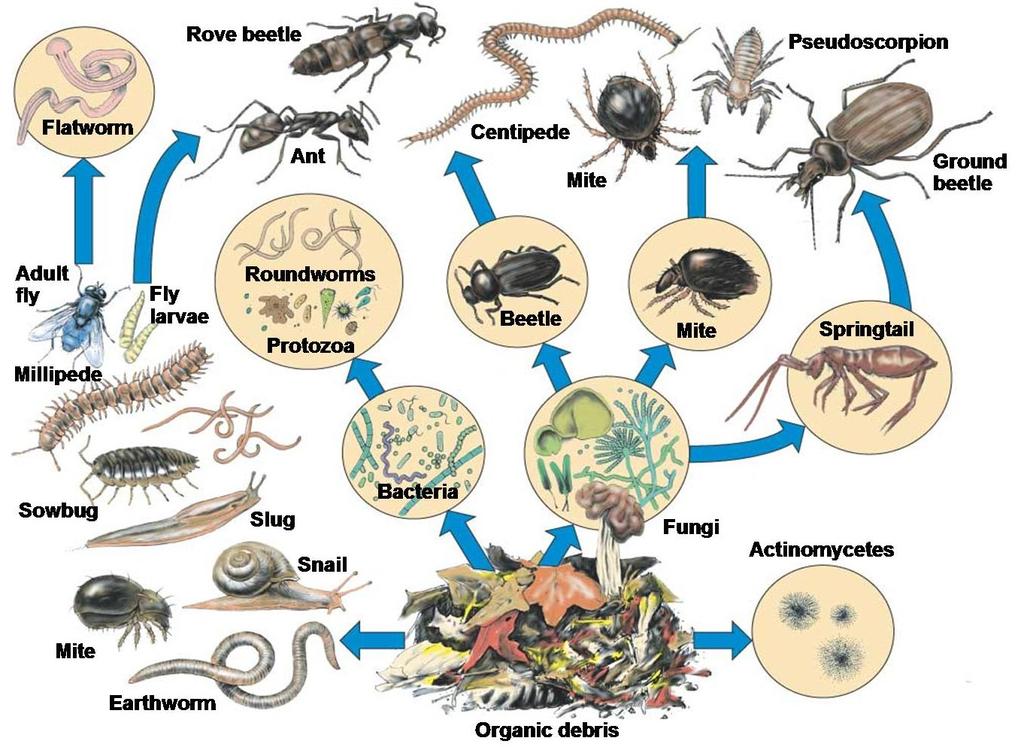
5 What is soil biology
6
7 Surface residues important Fueling soil biological activity Roots important

8 What do soil organisms need? Suitable habitat Something to hold onto Water Oxygen Balanced ph Carbon sources to consume Access to nutrients
9 Fractions of soil organic carbon Total Organic C Particulate Organic C SMBC CMIN } Resistant }Slow Plant Residue C}Active


10 Nitrogen and carbon mineralization have a complex relationship in the short-term Soil microbial activity biologically sequesters N into organic matter
 Hayed bermudagrass 0 250 500 750 1000 Soil Organic Carbon Accumulation (lb C / acre / year) Franzluebbers and Stuedemann (2010) Soil Sci. Soc. Am. J.")
11 Soil organic C and N are closely associated in the long- term 100 Soil Organic Nitrogen Accumulation (lb N / acre / year) Grazed lightly to moderately Unharvested grass (CRP) Hayed bermudagrass Soil Organic Carbon Accumulation (lb C / acre / year) Franzluebbers and Stuedemann (2010) Soil Sci. Soc. Am. J. 74:
 Soil Sci. Soc. Am. J.")
12 most farm fields will be in some steady-state condition due to family-farm management Thus, balancing the short- and longterm effects Franzluebbers et al. (1995) Soil Sci. Soc. Am. J. 59:
13 Soil process relationships Franzluebbers et al. (1999) Soil Sci. Soc. Am. J. 64:
14 The flush of CO 2 following rewetting of dried soil 500 Cumulative Carbon Mineralization (mg. kg -1 soil) cm depth cm depth cm depth Days of Incubation

15 reveals the soil s underlying biological and sustainable yield possible to reduce nutrient inputs and improve yield sustainability
 Variable Watkinsville GA Columbia MO Mandan ND Scottsbluff NE Brookings SD Flush of CO 2 10 11 14 16 10 CMIN 0-24 d 8 19 10 19 10 SMBC")
16 Preliminary results all sites Treatment F value Variable Watkinsville GA Columbia MO Mandan ND Scottsbluff NE Brookings SD Flush of CO CMIN 0-24 d SMBC POXC Protein Coefficient of variation (CV, %) Variable Watkinsville GA Columbia MO Mandan ND Scottsbluff NE Brookings SD Flush of CO CMIN 0-24 d SMBC POXC Protein
17 The flush of CO 2 following rewetting of dried soil Some key considerations 400 Representative sample of field of influence 300 Defined soil depth Cumulative Carbon Mineralization (mg. kg -1 soil) 500 Oven-dried sample (55200 C, 3 d) Sieved coarsely to < mm Rewetted to 50% WFPS Accurate determination of CO 2 alkali trap / titration cm depth cm depth cm depth Days of Incubation
18 The flush of CO 2 is an indicator of soil microbial activity Basal Soil Respiration (mg CO 2 -C. kg -1 soil. d -1 ) BSR = * Flush r 2 = Flush of CO 2 following Rewetting of Dried Soil (mg CO 2 -C. kg -1 soil) 0-3 d Data from Franzluebbers et al. (2007) Soil Till. Res. 96:
19 The flush of CO 2 relates well to soil microbial biomass C SMBC = * Flush r 2 = 0.76 Soil Microbial Biomass C (mg. kg -1 soil) Georgia Kansas Michigan Flush of CO 2 following Rewetting of Dried Soil (mg CO 2 -C. kg -1 soil) 0-3 d Data from Jangid et al. (2008, 2010, 2011) Soil Biol. Biochem. 40: ; 42: ; 43:

20 The flush of CO 2 shows association with N availability Net Nitrogen Mineralization (mg. kg -1 ) 0-24 d Across all soil textures NMIN = *Flush r 2 =0.80, n= From multiple locations and depths within 61 different fields throughout North Carolina <20% clay content NMIN = *Flush r 2 =0.63, n= % clay content NMIN = *Flush r 2 =0.83, n=172 >30% clay content NMIN = *Flush r 2 =0.79, n= Flush of CO 2 following Rewetting of Dried Soil (mg CO 2 -C. kg -1 soil) 0-3 d Data from M.R. Pershing (2016) NC State thesis
21 Idealized response to nitrogen Relative Yield (fraction) Accounting for Farm profit Sites with 0.0 low N availability and high N fertilizer response Goal of enlarging the biologically active N pool without causing N leakage Available Nitrogen (kg (kg N ha -1-1 ) Inorganic nitrogen Surface soil Residual in profile Sites with high N availability and low N fertilizer response Environmental impact Organic nitrogen Long-term stable Biologically active
22 Not all fields have the same available N Relative Yield (fraction) Available Nitrogen (kg ha -1 ) Accounting for Inorganic nitrogen Surface soil Residual in profile Organic nitrogen Long-term stable Biologically active


23 Consider this evidence Plant N uptake in semi-controlled greenhouse experiments
24 Plant dry matter production in minor relationship with total organic C 8 Plant Dry Matter Production (mg DM. g -1 soil) Soil from 30 sites in NC + VA (0-10, 10-20, cm depths each) Pershing (2016) NC State University MS thesis DM = (TOC) r 2 = Total Organic Carbon (g C. kg -1 soil)
25 Plant dry matter production with no relationship to humic matter Plant Dry Matter Production (mg DM. g -1 soil) DM = (HM) r 2 = 0.00 Soil from 30 sites in NC + VA (0-10, 10-20, cm depths each) Pershing (2016) NC State University MS thesis Humic Matter (g. 100 g -1 soil) from NCDA lab
26 Plant dry matter production in moderate relationship with residual inorganic N 8 Plant Dry Matter Production (mg DM. g -1 soil) DM = (RIN) r 2 = 0.33 Soil from 30 sites in NC + VA (0-10, 10-20, cm depths each) Pershing (2016) NC State University MS thesis Residual Inorganic Nitrogen (mg NH 4 -N + NO 3 -N. kg -1 soil)
27 Plant dry matter production in strong relationship with net N mineralization 8 Plant Dry Matter Production (mg DM. g -1 soil) DM = (NMIN) r 2 = 0.76 Soil from 30 sites in NC + VA (0-10, 10-20, cm depths each) Pershing (2016) NC State University MS thesis Net N Mineralization (mg N. kg -1 soil) 0-24 d
28 Plant N uptake in strong relationship with plant available N 200 Plant Nitrogen Uptake (mg N. kg -1 soil) PNU = (PAN) r 2 = Soil from 30 sites in NC + VA (0-10, 10-20, cm depths each) Plant Available Nitrogen (residual inorganic + mineralizable) (mg N. kg -1 soil) 0-24 d Pershing (2016) NC State University MS thesis
29 The flush of CO 2 in strong relationship with plant available N Flush of CO 2 Following Rewetting of Dried Soil (mg C. kg -1 soil) 0-3 d Flush CO 2 = (PAN) r 2 = 0.88 Soil from 30 sites in NC + VA (0-10, 10-20, cm depths each) Pershing (2016) NC State University MS thesis Plant Available Nitrogen (residual inorganic + mineralizable) (mg N. kg -1 soil) 0-24 d
 Pershing (2016) NC State University MS")
30 Plant N uptake in strong relationship with the flush of CO 2 Plant Nitrogen Uptake (mg N. kg -1 soil) PNU = (Flush) r 2 = Flush of CO 2 Following Rewetting of Dried Soil Soil from 30 sites in NC + VA (0-10, 10-20, cm depths each) Pershing (2016) NC State University MS thesis (mg CO 2 -C. kg -1 soil) 0-3 d

31 Field calibration to N requirements - Corn grain and silage in North Carolina and Virginia Example of 3 strips fertilized with 0, 69, and 125 kg N ha -1 at sidedress
32 Location of corn N trials
 Bulk density, particle size, total C-N, microbial biomass C,")
33 Soil sampling - 8 cores from each of 4 replicate locations Soil analyses Flush of CO 2, net nitrogen mineralization Routine soil testing for ph, P, K, other elements (NC Dept Agric) Bulk density, particle size, total C-N, microbial biomass C, inorganic N
 South field (biological) 1140 32-row strips of each sidedress N")
34 Rockingham Co VA 2016MD Rep 1 Rep 2 Rep 3 Rep N 0 N 140 N 140 N 0 N 70 N North field (conventional) South field (biological) row strips of each sidedress N rate
35 Cost-return scenarios Condition Threshold return needed (lb grain/lb N) Low N ($0.50/lb N) and high grain ($5.60/bu) 5 Low N ($0.50/lb N) and low grain ($2.80/bu) 10 High N ($1.00/lb N) and high grain ($5.60/bu) 10 High N ($1.00/lb N) and low grain ($2.80/bu) 20
36 Rockingham Co VA 2016MD North field (conventional) Optimum N (lb N/a) Corn Grain Yield (bu/a) Nitrogen Rate (lb N/a) (at sidedress) Average Rep Threshold L M H
37 Rockingham Co VA 2016MD South field (biologicals) Corn Grain Yield (bu/a) Optimum N (lb N/a) Nitrogen Rate (lb N/a) (at sidedress) Average Rep Threshold L M H
38 Yield data from across farms in NC and VA 1.0 Relative Corn Grain Yield without Sidedress N (fraction) r 2 = 0.64 n = Flush of CO 2 (mg CO 2 -C. kg -1 soil) 0-3 d Total of 36 fields in NC + VA
39 Similarity in yield response between both grain and silage 1.0 Relative Corn Yield without Sidedress N (fraction) r 2 = 0.64 n = Flush of CO 2 (mg CO 2 -C. kg -1 soil) 0-3 d Total of 32 grain fields in NC + VA and 11 silage fields in VA
40 Adjustment of N per bushel of grain Sidedress Nitrogen Required to Achieve Optimum Corn Grain Yield (lb N/bu grain) NR = * Flush r 2 = 0.29 n = Flush of CO 2 (mg CO 2 -C. kg -1 soil) 0-3 d Total of 36 fields in NC + VA
41 Adjustment of N per ton of silage Sidedress Nitrogen Required to Achieve Optimum Corn Silage Yield (lb N/ton silage) N = * Flush r 2 = 0.44 n = Flush of CO 2 (mg CO 2 -C. kg -1 soil) 0-3 d Total of 11 fields in VA

42 Preliminary analysis for recommendation domain Sidedress Nitrogen Required to Achieve Optimum Corn Grain Yield (lb N/bu grain) NR = * Flush r 2 = 0.29 n = Flush of CO 2 (mg CO 2 -C. kg -1 soil) 0-3 d Very Low Low High Medium Very High Soil-Test Biological Activity

43 Wheat grain evaluations in North Carolina - 5 sites in 2015, 4 sites in 2016, and 10 sites in 2017
44 Location of wheat N trials

45 Wheat yield response in NC 1.0 Relative Wheat Dry Matter Yield without N fertilizer compared with 135 kg N ha -1 (fraction) * Flush Relative Yield = 1.14 * e r 2 = Flush of CO 2 following Rewetting of Dried Soil Total of 9 fields in western NC (mg CO 2 -C kg -1 soil) 0-3 days

46 Autumn stockpiling of tall fescue - 19 sites in 2015 and 35 sites in 2016

47 Location of tall fescue N trials
48 Tall fescue nitrogen trials 250 NMIN = * Flush Net Nitrogen Mineralization (mg. kg -1 soil) 0-24 d r 2 = Flush of CO 2 following Rewetting of Dried Soil (mg CO 2 -C. kg -1 soil) 0-3 d Pehim-Limbu et al. (unpublished data)
 2000 1000 0 0 50 100 150 Nitrogen Fertilizer Rate (kg N. ha -1 ) Pehim-Limbu et al.")
49 Assessm Tall fescue ent ofnitrogen availability trials in fa l stockpiled An example from site near Butner NC 3000 Forage Dry Matter 15% moisture (kg. ha -1 ) Nitrogen Fertilizer Rate (kg N. ha -1 ) Pehim-Limbu et al. (unpublished data)
50 Cost-return scenarios Condition Threshold return needed (lb forage/lb N) Low N ($0.50/lb N) and high hay ($200/ton) 5 Low N ($0.50/lb N) and low hay ($100/ton) 10 High N ($1.00/lb N) and high hay ($200/ton) 10 High N ($1.00/lb N) and low hay ($100/ton) 20
51 Tall fescue nitrogen trials 30 Tall Fescue Yield Response to Initial Dose of N (kg DM. kg -1 N) r 2 = Soil-Test Biological Activity (mg CO 2 -C. kg -1 soil) 0-3 d Pehim-Limbu et al. (unpublished data)
52 Tall fescue nitrogen trials 40 Tall Fescue Yield Response to Initial Dose of N (kg DM. kg -1 N) Composite analysis of 19 sites in 2015/16 Mean + standard deviation at each site Strenth of fit of means (r 2 = 0.80) Coefficient of variation Flush of CO 2 = % Yield response = % Soil-Test Biological Activity (mg CO 2 -C. kg -1 soil) 0-3 d Pehim-Limbu et al. (unpublished data)
53 Tall fescue nitrogen trials 150 Nitrogen Rate to Achieve Optimum Yield (kg N. ha -1 ) ( * Flush) NR = * e r 2 = 0.26, n = Flush of CO 2 following Rewetting of Dried Soil (mg CO 2 -C. kg -1 soil) 0-3 d
54 Tall fescue nitrogen trials Soil-test biological Nitrogen fertilizer to activity achieve optimum yield (mg CO 2 -C kg -1 soil 3 d -1 ) (lb N/a) < >
55 The flush of CO 2 as a predictive soil test Relative Yield (fraction) Farm profit Sites with 0.0 low N availability and high N fertilizer response Goal of enlarging the biologically active N pool without causing N leakage Flush Available of CONitrogen (kg ha -1 2 (mg. kg -1 soil) 0-3 ) d Sites with high N availability and low N fertilizer response Environmental impact A working hypothesis
56 Incubating soil in sealed jar with alkali to absorb CO 2 Components o 1-L canning jar with lid o Two 60-mL graduated bottles with 50 g soil wetted to 50% WFPS (***) o One 30-mL screw-cap vial containing 10 ml of 1 M NaOH to absorb CO 2 o One 25-mL vial containing 10 ml water to maintain humidity *** One bottle pre-incubated for 10 days prior to CHCl 3 fumigation to estimate soil microbial biomass C One bottle incubated for 24 days to determine cumulative C and N mineralization


57 Soil biological activity is a key indicator for productivity and environmental quality The flush of CO 2 possesses many qualities of a robust soil test Rapid Inexpensive Reproducible Suitable for a wide range of soils Correlating to nutrient needs of crops