Renewables: The True Costs. Michael Taylor Senior Analyst
|
|
|
- Andrew Burke
- 5 years ago
- Views:
Transcription
1 Renewables: The True Costs Michael Taylor Senior Analyst

2 The energy transition Must be accelerated But lack of reliable cost data from trusted source Robust data and facts can have a real impact 2
3 Renewable cost analysis at IRENA Fills an important gap in knowledge World-class database of costs Cutting edge analysis, not just data More products and analysis coming Costing Alliance deepens engagement


4 IRENA Costing Analysis Products
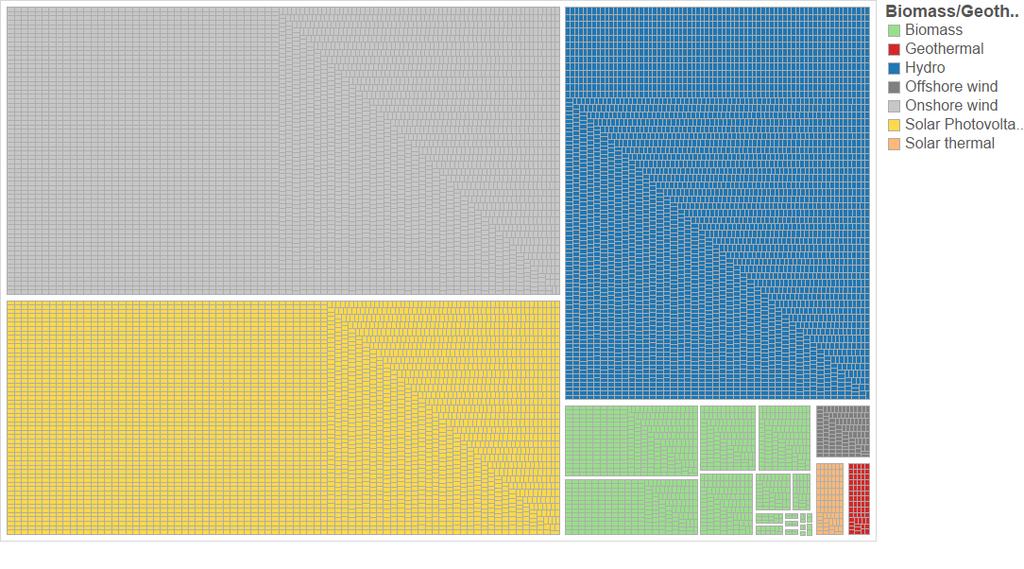
5 THE IRENA RENEWABLE COST DATABASE 5
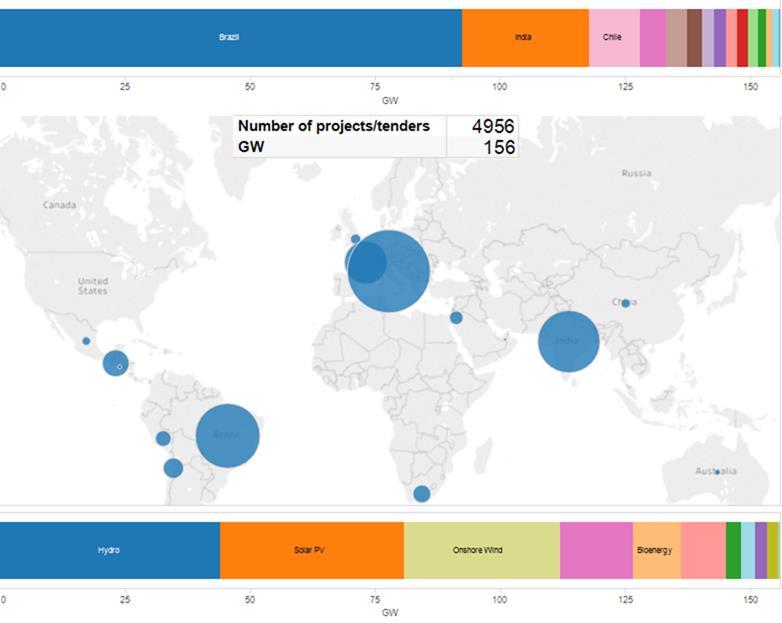
6 IRENA s database: Scope and coverage Power: utility-scale projects for LCOE 1 million small-scale solar PV Smaller dataset on biofuels/evs Stationary applications to be added in 2016/2017 Power: database concentrated in non-oecd as more publicly available information
7 Power generation cost and PPA databases 7
8 Renewable Power Generation Costs in 2016 JANUARY 2015

9 Highlights The relentless improvement in competiveness continues Renewables competing head-to-head with fossil fuels Future cost reductions will be more challenging, policy driven

10 Renewables: Highly competitive for new capacity Traditional renewables highly competitive Cost reductions for wind and solar, make them increasingly competitive Each circle represents one project, centre of circle is LCOE value on Y axis, diameter is size of project. Year is year commissioned. Cost rise for average hydro projects, geo & biomass data needs more work

11 Solar PV module prices in 2015/16 11

12 Solar PV utility-scale projects Technology improvements and cost reductions = Falling LCOEs 12

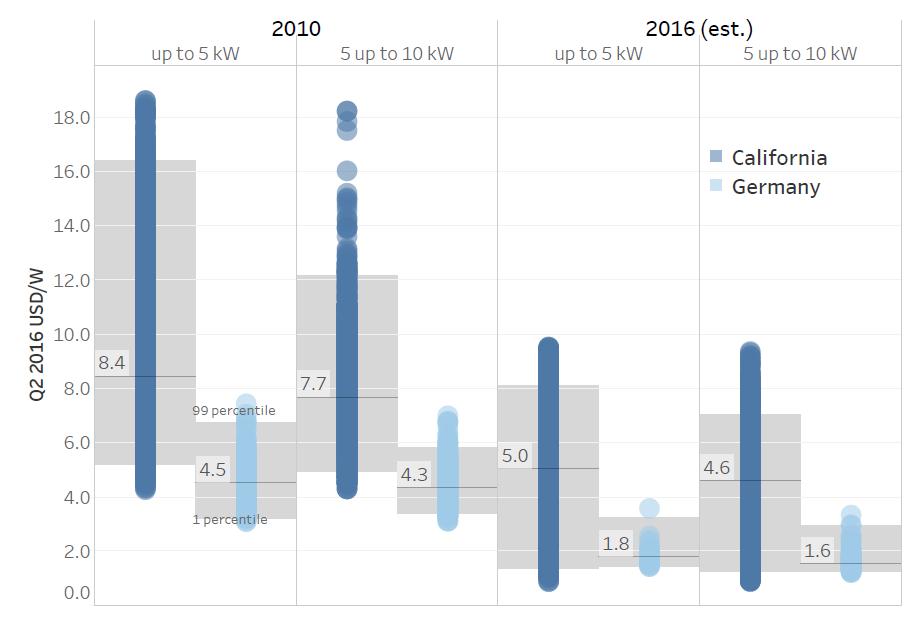
13 Residential solar PV: Average cost differentials 13

14 NEW OPPORTUNITIES UNLOCKED 14

15 Solar PV Costs in Africa Africa has a need for power: Solar resources make PV an excellent fit ~600 million lack access But poor understanding of costs today Data collection challenging, but encouraging results Some markets relatively competitive Very small SHS cost structures are challenging Regional deep-dives necessary for greater clarity
 annualized costs, by country (IRENA) Cost of utility scale projects continue to fall In all sub-saharan countries, off-grid, SHS can compete with")
16 Solar PV costs in Africa: Utility-scale and SHS Operating and proposed utility scale solar PV project installed costs in Africa, (IRENA) Annual off-grid household expenditure on lighting and mobile phone charging compared to SHS (<1kW) annualized costs, by country (IRENA) Cost of utility scale projects continue to fall In all sub-saharan countries, off-grid, SHS can compete with current lighting costs 16


17 The Power to Change Cost Reduction Potentials for Solar and Wind 17

18 Costs will continue to fall for solar and wind power technologies to 2025 Large cost differentials Continued technology innovation Growing scale of markets Policy framework critical to unlocking largest savings Cost reduction drivers are changing
19 Solar PV: Installed system costs to 2025 Large average cost reduction potential BoS dominates potential Will require action by policy makers
20 Solar PV: BoS costs Detailed breakdown of solar PV BoS costs by country, 2015 Source: IRENA Renewable Cost Database The range of BoS costs between costs groups is very large, but BoS costs also present the greatest opportunities for reduction potential

21 Solar PV LCOE to 2025 Highly dependent on BoS convergence scenario

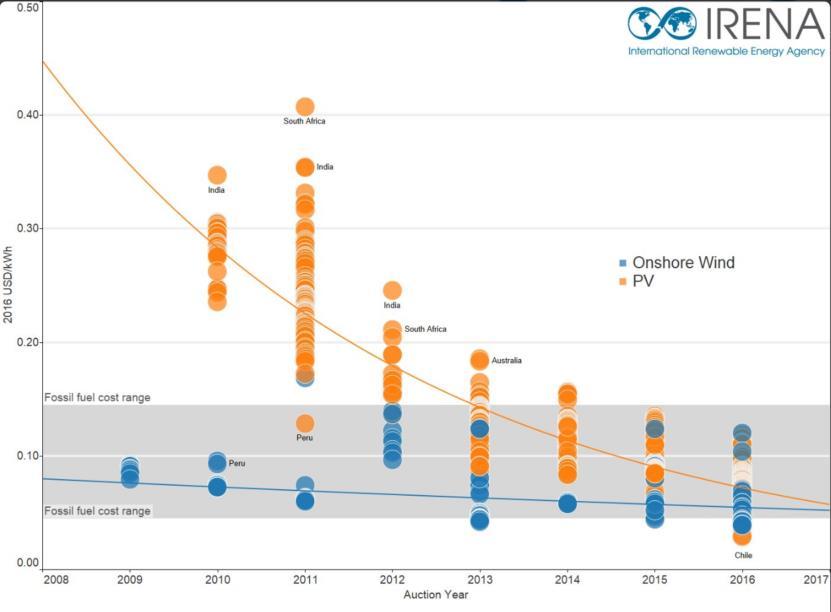
22 Tender and PPA results Dramatic convergence of solar PV and onshore wind to same LCOE range But some of these projects are boundary projects, difficult to replicate for solar PV 22
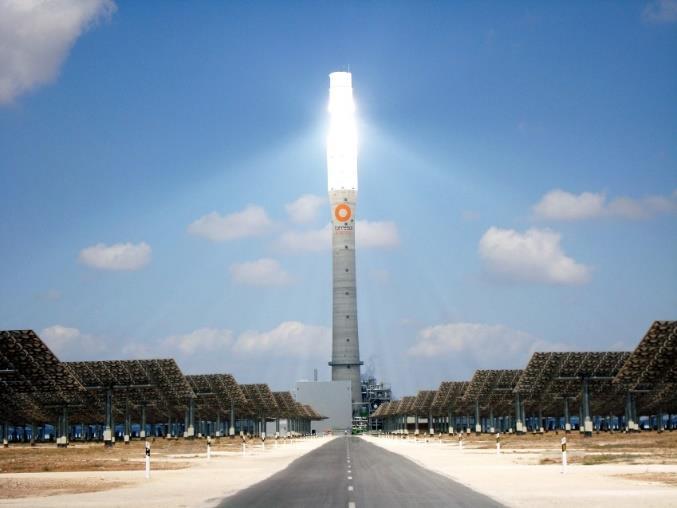
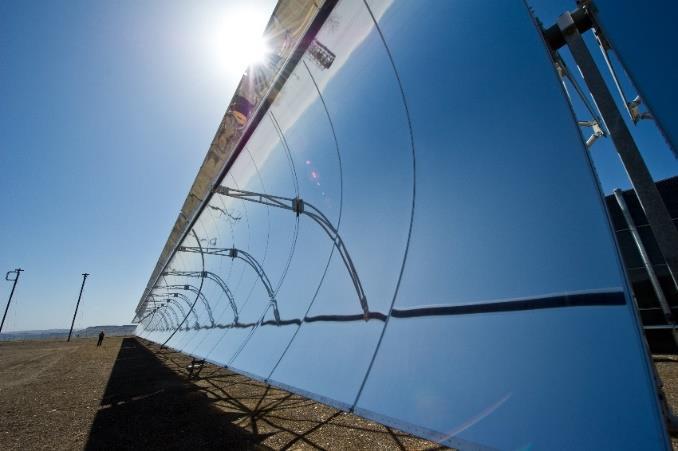
23 CONCENTRATING SOLAR POWER 23
 USD 5550/kW to USD 3800/kW 2025 ST -35% CAPEX (15-25) USD 5450/kW to USD 3600/kW Indirect EPC costs + Owner s costs also")
24 Concentrating solar power Deployment in its infancy! CAPEX could decline by one-third by 2025 PT -31% CAPEX (15-25) USD 5550/kW to USD 3800/kW 2025 ST -35% CAPEX (15-25) USD 5450/kW to USD 3600/kW Indirect EPC costs + Owner s costs also major contributors to reduction potential Plant Efficiency: 15% currently to 17% by 2025 Plant Efficiency: 15.5% currently to 18% by 2025
25 CSP: LCOE reduction potential For PTCs, major drivers are an increase in the temperature level enabled by the switchover to molten salt as the HTF which accounts for about 13% of the total LCOE reduction. The second important cost driver is the reduction of solar field costs. For STs, the largest single driver for LCOE reductions is related to gains in the EPC experience. The indirect EPC cost alone is expected to contribute about one-fifth to the overall LCOE reduction potential of towers.
26 CSP: LCOE development to 2025 The levelised cost of electricity of PTC and ST technologies, 2015 and 2025 In 2015, both trough and tower technologies were in the same LCOE range of about USD 0.15 to USD 0.19/kWh. By 2025, the LCOE range could decline to USD 0.09 to USD 0.12/kWh for troughs and USD 0.08 to USD 0.11/kWh for towers.
27 Upcoming cost analysis: Firm PV parity indicators Global wind learning curve Stationary applications Energy security Battery markets & costs to 2025 RE financing costs

28 Renewables are increasingly competitive The winners are customers, the environment and our future