Overview of the Ocean SAMP Climate Change Chapter
|
|
|
- Lynn Johnston
- 5 years ago
- Views:
Transcription

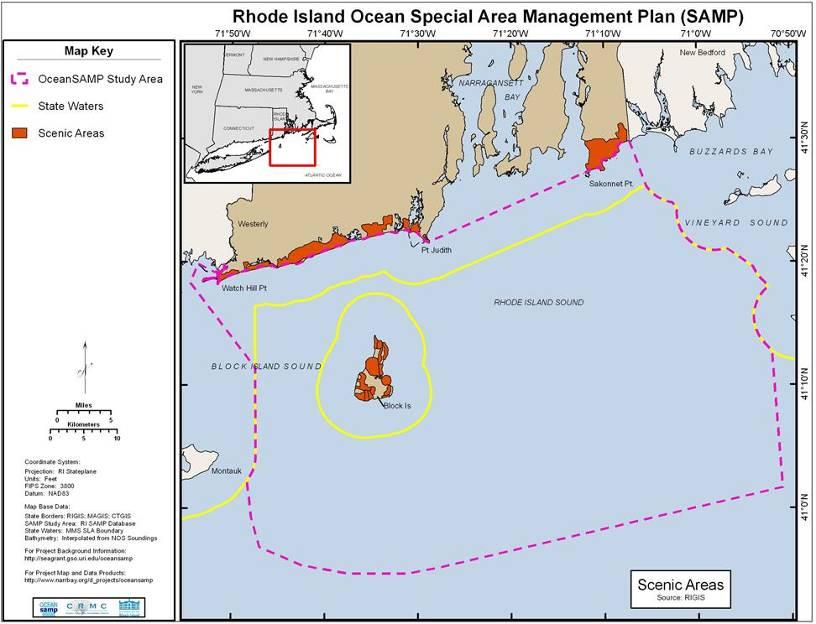
1 RI Ocean Special Area Management Plan Source: Providence Journal photos / Sandor Bodo Jim Tobey URI Coastal Resources Center Stakeholder Workshop April 6, 2010 Overview of the Ocean SAMP Climate Change Chapter

2 Methodology 1. Literature and data review 2. Workshops (Jan 5 and Feb 9) 3. Expert review and comments Acknowledgments Dawn Kotowicz Leanna Heffner Pam Rubinoff
3 Major Findings The effects of global climate change are already being witnessed globally, regionally and in Rhode Island and are projected to intensify in years to come Climate change affects many uses of the SAMP area The effects of global climate change should be considered when evaluating proposed future uses

4 Findings: Climate Change Trends and Projections Air temperature Ocean temperature Sea level rise Storminess Precipitation Ocean acidification
5

6 Carbon Dioxide CO 2 - Levels Insert figure
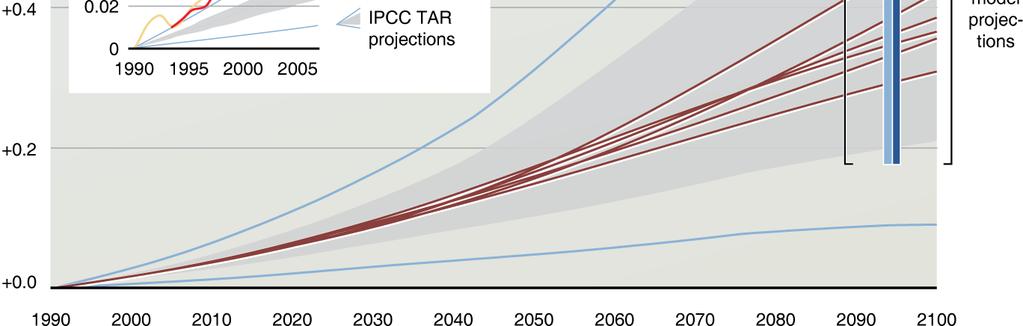
7 Observed Global Warming and Climate change projections Higher emissions Lower emissions Le Quéré et al. 2009

8 Air Temperature Annual Mean Temperature for Providence and TF Green Airport ( ) Projected mean increase by 2100 Global: F Northeast: 3-14 F Source: Pilson 2008 Air Temperature Trends 1961 to 2006 Increase of 0.3 C (0.6 F) per decade Source: NOAA 2009
 or southern Virginia (higher emissions scenario) Courtesy of the Union of Concerned Scientists")
9 Rhode Island climate migration By mid-century, summer in Rhode Island could feel like the typical summer in the Chesapeake Bay area (lower emissions scenario) or southern Virginia (higher emissions scenario) Courtesy of the Union of Concerned Scientists
10 Ocean Temperature Mean Surface Water Temperatures (Dec, Jan, Feb) West Passage, Narragansett Bay Sea surface temperatures in Narragansett Bay have risen 2.2 C C (4 F) since the 1960s Source: Nixon et al Ocean Depth Temperature Sea surface Bottom Lower emissions scenario (B1) 4-5 F ( C) 2 F (1.1 C) Higher emissions scenario (A1FI) 6-8 F ( C) 5-7 F ( C) Frumhoff et al. 2007


11 Sea Level Rise Sea level rise under accelerated ice melt

12 Sea Level Rise Simulation of 3 foot Sea Level Rise Providence, RI
13 Storminess
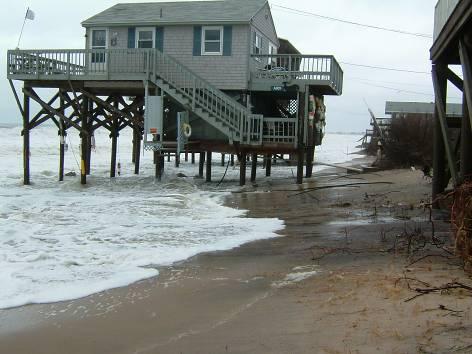
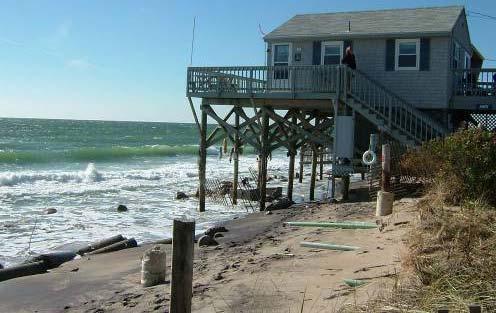
14 Increased Probability of Flooding

15 Changes in weather in the Northeast US Since 1900 precipitation has increased 5-10%, mostly falling as rain rather than snow More frequent extreme precipitation Fewer days with snow on ground Decreased snowfall Longer summers, shorter winters

16 Precipitation Decadal Trends in 1 inch Precipitation Events Red shows locations with increasing number of 1 inch precipitation events Spierre et al., 2008
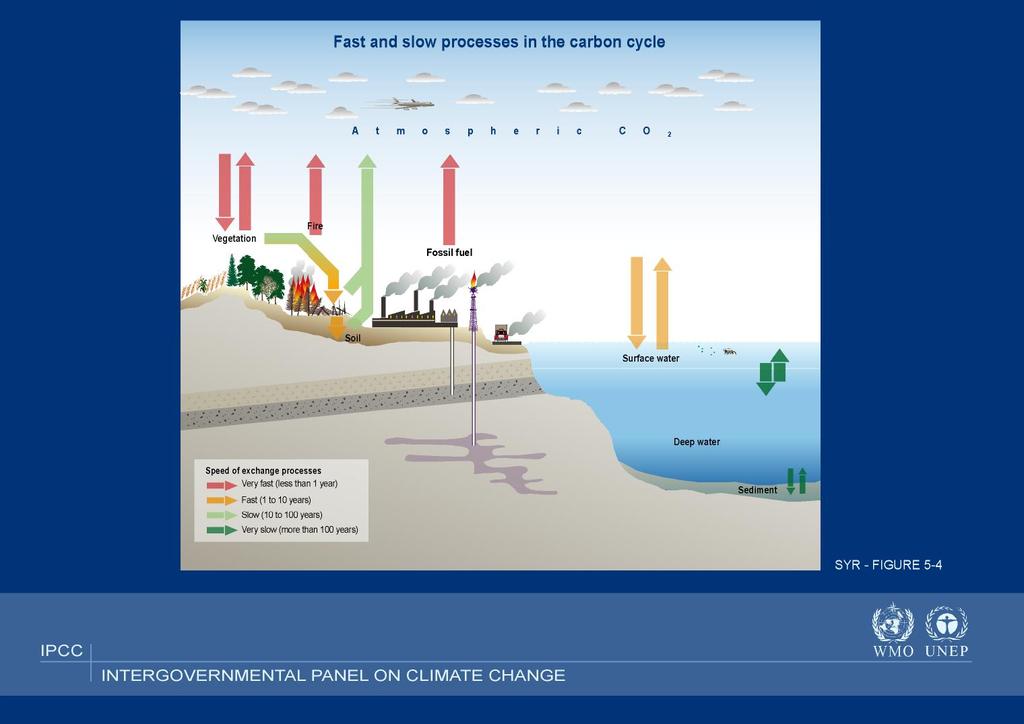
17 Ocean Acidification
18 Ocean Acidification Globally averaged marine surface atmospheric CO2 has increased 13.2% since This has resulted in a reduction of surface ocean seawater ph levels by 0.1 ph units The most recent IPCC report projects that by late century ph will drop 0.3 to 0.4 units from current levels With the exception of rare events, a change of this magnitude has not occurred in the last 300 million years
19 What does all this mean for the Ocean SAMP study area? Ecological impacts Marine ecology Fish and invertebrates Seabirds, marine mammals, sea turtles Human use impacts Marine transportation, navigation, and related infrastructure Recreation and tourism Renewable energy Historical and cultural assets Fisheries resources and uses Future uses
20 Ecological Impacts Changes in the distribution of fish Warmer water temperatures can lead to the spread of disease organisms and invasive species that cause harm to the ecosystem Harmful Algal Blooms (HABs)? Hypoxia (very little oxygen in the water column)? Reduced survival rate of marine animals that have shells or skeletons made of calcium carbonate


21 Fish and invertebrates moving North Species at the southern extent of their range in the Ocean SAMP study area: American lobster, Atlantic cod, silver hake Species at the northern extent of their range in the Ocean SAMP: black sea bass, butterfish, scup, summer flounder
22 Ratio of pelagic to demersal fish species caught in Northeast Fishery Science Center, Autumn Bottom Trawl Surveys


23 Threats to Survival of Whales, Seabirds and Sea Turtles Changes in abundance, timing and distribution of prey Loss of beach and salt marsh nesting habitat due to sea level rise and coastal retreat Loss of low-lying islands outside the Ocean SAMP that seabirds rely on


24 Impacts on Marine Transportation, Navigation and Related Infrastructure Extended shipping season and less problems with icing on vessels and infrastructure But, Greater damage from more intense storms Increased decay from increasingly acidic seas Higher risk of flooding with higher sea levels More exposure to intense storm events Source: LIN Television 2007 Source: NOAA 2009
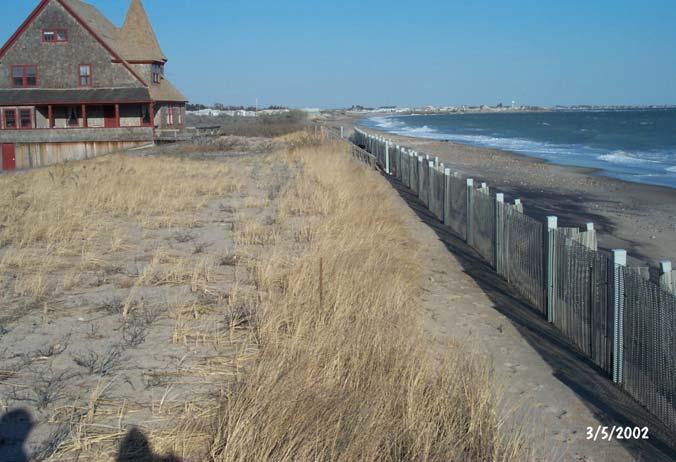
25 Impacts on Recreation and Tourism Longer summer season More opportunity for recreation activities Ibis in Misquamicut But Warmer water may introduce more algae and jellies Increased rainfall and runoff increase nutrients and pollutants entering the sea More beach closures, decreased water quality and red tide Barrier beaches, coastal lagoons and tidal salt flats vulnerable to increased erosion and loss of habitats Source: Flickr 2007 Misquamicut beach Source: Wikimedia Commons 2009


26 Climate Change Recommended Policies and Standards Review policies, plans and regulations related to the activities within CRMC jurisdiction of the Ocean SAMP Promote data collection and monitoring programs Assess vulnerability of key infrastructure to climate change projections Develop design standards that account for projected wind, storms, and waves Support public awareness and interpretation programs to increase public understanding of climate change Source: Lacoastpost 2009 Quonset Point Source: General Dynamics Electric Boat 2010
27 Thank you! For further information, see seagrant.gso.uri.edu/ oceansamp/ Jim Tobey: or