Oil and Gas 101: An Overview of Emissions from Upstream Oil and Gas Exploration and Production Sources
|
|
|
- Gwendolyn Paul
- 5 years ago
- Views:
Transcription

1 Oil and Gas 101: An Overview of Emissions from Upstream Oil and Gas Exploration and Production Sources Mike Pring, Eastern Research Group July 18, 2018
2 Training Overview Oil and gas production in the United States Upstream oil and gas emission sources EPA Nonpoint Emission Estimation Tool Data resources 7/18/2018 U.S. Environmental Protection Agency 2
3 Oil and Gas Production in the US Over 3 billion barrels of crude oil produced in 2016 ~50% increase since 2011 Down slightly from 2015 ~18% of production offshore (was 30% in 2010) Texas, North Dakota, California Over 28 trillion cubic feet of gas produced in 2016 ~30% increase since 2009 ~5% of production offshore Texas, Pennsylvania, Oklahoma Source: U.S. Energy Information Administration 7/18/2018 U.S. Environmental Protection Agency 3


4 US Onshore Crude Oil Production Source: U.S. Energy Information Administration 7/18/2018 U.S. Environmental Protection Agency 4

5 US Onshore Natural Gas Production Source: U.S. Energy Information Administration 7/18/2018 U.S. Environmental Protection Agency 5
6 Natural Gas, NGLs, Condensate, Oil Natural Gas (C1 primarily Methane) Natural Gas Liquids (C2 C4) Ethane, Propane, Butane Extracted at gas processing plants Wet gas Condensate (~C5+) Condenses out of gas stream at surface Crude Oil (mixture of heavier hydrocarbons) Distilled into gasoline, kerosene, diesel, jet fuel 7/18/2018 U.S. Environmental Protection Agency 6

7 Eagle Ford Shale Oil and Gas Well Map Source: U.S. Energy Information Administration 7/18/2018 U.S. Environmental Protection Agency 7

8 7/18/2018 U.S. Environmental Protection Agency 8
9 Upstream Oil and Gas Emission Sources 7/18/2018 U.S. Environmental Protection Agency 9
10 Upstream Oil and Gas Emission Sources Exploration Sources Drilling Rigs Hydraulic Fracturing Pumps Mud Degassing Well Completion Venting Production Sources Artificial Lift Engines Associated Gas Venting Coalbed Methane Dewatering Pump Engines Condensate Tanks Crude Oil Tanks Production Sources (continued) Dehydrators Fugitive Leaks Gas-Actuated Pneumatic Pumps Heaters Lateral Compressor Engines Liquids Unloading Hydrocarbon Liquids Loading Pneumatic Devices Produced Water Tanks Wellhead Compressor Engines 7/18/2018 U.S. Environmental Protection Agency 10
11 EPA Tool Estimation Methodologies Area (nonpoint) source methodologies Based on point source methodologies averaged over the population Scaled to the county level using activity factors (well counts, oil production, gas production) Refer to 2014 Nonpoint Oil and Gas Emission Estimation Tool Version 2.2 (June, 2017) for details 7/18/2018 U.S. Environmental Protection Agency 11
 ~2 4 weeks 7/18/2018 U.S.")
12 Exploration - Drilling Rigs Used to drill wellbore to target formation 2 primary rig types Mechanical Diesel-electric Powered by large, diesel engines (~1,000 1,500 HP) ~2 4 weeks 7/18/2018 U.S. Environmental Protection Agency 12
13 Drilling Rigs Emissions based on cumulative feet drilled Process characteristics needed to estimate emissions Engine size and type (HP) Operating hours (hr/spud) Emission factors from EPA's NONROAD model Methodology accounts for different types of rig configurations (mechanical and diesel-electric) 7/18/2018 U.S. Environmental Protection Agency 13
14 Mud Degassing Mud degassing refers to the process of off-gassing of entrained gas in the drilling mud once it is outside of the wellbore Drilling mud used to keep the drill bit cool, carry out drill cuttings, and maintain wellbore pressure to prevent formation fluids from entering wellbore Emissions based on total drilling days Emission factor derived from 1977 EPA report Atmospheric Emissions from Offshore Oil and Gas Development and Production 7/18/2018 U.S. Environmental Protection Agency 14


15 Hydraulic Fracturing Pumps 7/18/2018 U.S. Environmental Protection Agency 15
16 Hydraulic Fracturing Pumps Emissions based on number of fracture events Process characteristics needed to estimate emissions Engine size (HP) Number of engines Operating hours (hr/event) Emission factors from EPA's NONROAD model 7/18/2018 U.S. Environmental Protection Agency 16

17 Well Completion Venting Emissions generated as gas is vented prior to well being brought into production For fractured wells, emissions are generated as gas entrained in the flowback fluid is emitted through open vents at the top of flowback tanks Emissions from fractured wells regulated under NSPS OOOO and OOOOa 7/18/2018 U.S. Environmental Protection Agency 17
18 Well Completion Venting Emissions based on number of completion events Process characteristics needed to estimate emissions Volume of gas released per completion (MCF/event) Oil and gas Conventional and unconventional Gas composition Controls 7/18/2018 U.S. Environmental Protection Agency 18
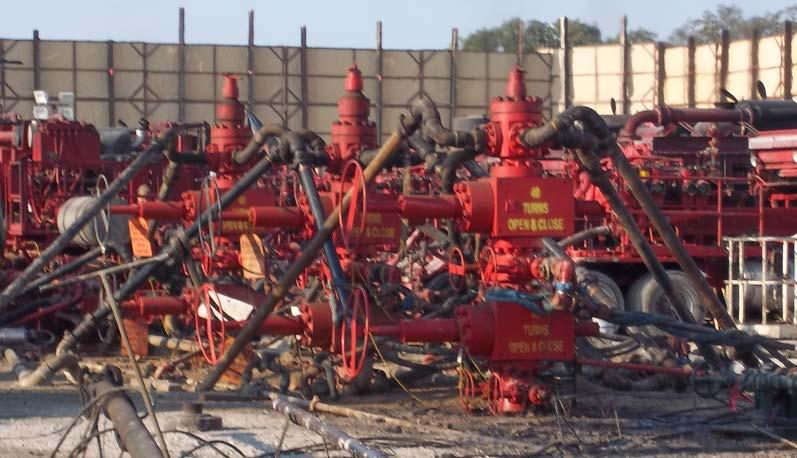
19 Production Sources Source : Texas Commission on Environmental Quality Air Permit Reference Guide APDG /18/2018 U.S. Environmental Protection Agency 19

20 Pumpjack engines Artificial Lift Engines Engines used to lift oil out of the well if there is not enough bottom hole pressure for the oil to flow to the surface Generally use casinghead gas if electricity not available 7/18/2018 U.S. Environmental Protection Agency 20
21 Artificial Lift Engines Emissions based on number of oil wells Process characteristics needed to estimate emissions Engine size (HP) Engine operating schedule (hr/yr) Fraction of oil wells with engines Emission factors from AP-42 Electric engines are common, accounted for in methodology 7/18/2018 U.S. Environmental Protection Agency 21

22 Associated Gas Venting Refers to the practice of venting gas produced at oil wells where the well is not connected to a gas sales pipeline May be flared (e.g. Bakken Shale) Emissions estimated based on Quantity of gas vented per barrel of oil production (MCF/bbl) Fraction of gas flared Composition of the vented gas 7/18/2018 U.S. Environmental Protection Agency 22

23 Coalbed Methane Dewatering Pump Engines 7/18/2018 U.S. Environmental Protection Agency 23
24 Coalbed Methane Dewatering Pump Engines New category added for 2017 Pumpjack engines similar to Artificial Lift Engines used to lift water out of the well Electric engines are common, otherwise use CBM gas No current default factors 7/18/2018 U.S. Environmental Protection Agency 24
25 Coalbed Methane Dewatering Pump Engines Emissions based on number of CBM wells Process characteristics needed to estimate emissions Engine size (HP) Engine operating schedule (hr/yr) Fraction of CBM wells with engines Emission factors from AP-42 Electric engines accounted for in methodology 7/18/2018 U.S. Environmental Protection Agency 25

26 Condensate Tanks 7/18/2018 U.S. Environmental Protection Agency 26
27 Condensate Tanks Emissions based on condensate production Emissions occur from flashing, working, and breathing losses Flashing losses are generally the largest component and occur when gases entrained in a liquid flash off as the pressure drops Emissions per barrel of condensate needed to estimate total county-level emissions (lb/bbl) Regulated under NSPS OOOO and OOOOa 7/18/2018 U.S. Environmental Protection Agency 27

28 Crude Oil Tanks Used to store crude oil at a well pad or central tank battery prior to transfer to a refinery Some oil fields pipe oil directly downstream and do not have tanks in the field accounted for in Tool Largest VOC source as calculated by the Tool Permian Basin Tank Battery Source: Google Earth 7/18/2018 U.S. Environmental Protection Agency 28
 Regulated under NSPS OOOO and OOOOa 7/18/2018 U.S. Environmental Protection Agency 29")
29 Crude Oil Tanks Emissions based on oil production Emissions occur from flashing, working, and breathing losses Emissions per barrel of crude oil needed to estimate total countylevel emissions (lb/bbl) Regulated under NSPS OOOO and OOOOa 7/18/2018 U.S. Environmental Protection Agency 29

30 Use glycol to remove water from gas stream to prevent corrosion or freezing issues downstream Small reboiler used to regenerate the glycol May be located at well pad, or at centrally located gathering station Dehydrators 7/18/2018 U.S. Environmental Protection Agency 30
31 Dehydrators Emissions generated from the still vent and the reboiler Emissions from the still vent based on gas production Emissions per throughput (lb/mmscf) Emissions from the reboiler based on gas well count Number of dehydrators per well Reboiler size (MMBtu/hr) and operating schedule (hr/yr) NESHAP HH and HHH may require controls 7/18/2018 U.S. Environmental Protection Agency 31

32 Fugitive Leaks Emissions of gas that escape through well site components such as connectors, flanges, and valves Source category only covers components located at the well pad Regulated under NSPS OOOOa 7/18/2018 U.S. Environmental Protection Agency 32
33 Fugitive Leaks Emissions based on well count Process characteristics needed to estimate emissions Counts of fugitive components by type per well Operating schedule (hr/yr) Composition of leaked gas Emission factors from Protocol for Equipment Leak Emission Estimates (EPA, 1995) 7/18/2018 U.S. Environmental Protection Agency 33

34 Gas-Actuated Pneumatic Pumps Small gas-driven plunger pumps used to provide a constant supply of chemicals or lubricants Commonly used in sites where electric power is unavailable Gas-actuated pumps vent by design 7/18/2018 U.S. Environmental Protection Agency 34
35 Gas-Actuated Pneumatic Pumps Emissions based on well counts Kimray pumps Chemical injection pumps (CIP) Certain pumps regulated under NSPS OOOOa Process characteristics needed to estimate emissions Count of pumps per well (oil, gas, CBM) Pump vent rate (SCF per throughput or day) Composition of vented gas 7/18/2018 U.S. Environmental Protection Agency 35
 Heaters 7/18/2018 U.S. Environmental Protection Agency 36")
36 Line heaters - used to maintain temperatures as pressure decreases to prevent formation of hydrates (Marcellus Shale) Heater treaters used to heat oil/water emulsions to aid in separation (Bakken Shale, Permian Basin) Heaters 7/18/2018 U.S. Environmental Protection Agency 36
37 Heaters Emissions based on the number of wells Heaters used as control devices regulated under NSPS OOOO and OOOOa Process characteristics needed to estimate emissions Number of heaters per well Heater size (MMBtu/hr) Operating schedule (hr/yr) H 2 S content (to estimate SO 2 ) 7/18/2018 U.S. Environmental Protection Agency 37
 Natural gas-fired Rich-burn or lean-burn 7/18/2018 U.S.")
38 Lateral Compressor Engines Large line engines May serve ~10 to 100 wells Used at gathering or booster stations (midstream) Natural gas-fired Rich-burn or lean-burn 7/18/2018 U.S. Environmental Protection Agency 38
39 Lateral Compressor Engines Emissions based on the number of gas wells Compressors regulated under NSPS OOOO and OOOOa Process characteristics needed to estimate emissions Number of gas wells served by a lateral engine Engine size (HP) Operating schedule (hr/yr) Control information 7/18/2018 U.S. Environmental Protection Agency 39
 7/18/2018 U.S.")
40 Liquids Unloading Used to remove accumulation of fluids in the wellbore Also known as well blowdowns May be controlled (flaring or plunger lifts) 7/18/2018 U.S. Environmental Protection Agency 40
41 Liquids Unloading Emissions based on the number of gas wells Process characteristics needed to estimate emissions Number of unloading events per well Volume of vented gas per liquids unloading event (MCF/event) Composition of vented gas Control information 7/18/2018 U.S. Environmental Protection Agency 41

42 Hydrocarbon Liquids Loading Emissions generated during transfer of liquids from tanks to trucks As with storage tank emissions, where liquids are piped directly downstream, no emissions from this category Accounted for in Tool 7/18/2018 U.S. Environmental Protection Agency 42
43 Hydrocarbon Liquids Loading Emissions based on oil and condensate production AP-42 loading loss equation used to estimate emissions Tank vapor composition needed to estimate VOC and HAP emissions 7/18/2018 U.S. Environmental Protection Agency 43
 2 nd largest VOC source as calculated by the Tool 7/18/2018 U.S. Environmental Protection Agency 44")
44 Pneumatic Devices Use high-pressure gas to produce mechanical motion (levers, switches) Largest CH 4 source under Subpart W and in the GHG EI (production sector) 2 nd largest VOC source as calculated by the Tool 7/18/2018 U.S. Environmental Protection Agency 44
45 Pneumatic Devices Emissions based on the number of wells Process characteristics needed to estimate emissions Number of devices per well Type of devices (high, low, and intermittent-bleed) Volume of vented gas per device (SCF/hr/device) Operating schedule (hr/yr) Composition of vented gas Regulated under NSPS OOOO and OOOOa 7/18/2018 U.S. Environmental Protection Agency 45
46 Produced Water Tanks Store water separated at the wellhead Emissions generated from working and breathing losses Water may be injected underground to maintain pressure (waterflooding) or for disposal Source : Texas Commission on Environmental Quality Air Permit Reference Guide APDG /18/2018 U.S. Environmental Protection Agency 46
47 Produced Water Tanks Emissions based on produced water production Emissions occur from working and breathing losses Process characteristics needed to estimate emissions Emissions per barrel of production (lb/bbl) Fraction of produced water directed to tanks Composition of the tank vapors 7/18/2018 U.S. Environmental Protection Agency 47

48 Wellhead Compressor Engines Provide energy to move produced gas downstream to gathering or boosting station Brought onsite as well pressure drops Utilize produced gas as fuel Largest NO x source as calculated by the Tool 7/18/2018 U.S. Environmental Protection Agency 48
49 Wellhead Compressor Engines Compressors regulated under NSPS OOOO and OOOOa Emissions based on the number of gas wells Process characteristics needed to estimate emissions Fraction of gas wells requiring compression Engine size (HP) Operating schedule (hr/yr) Control information 7/18/2018 U.S. Environmental Protection Agency 49
50 QUESTIONS? 7/18/2018 U.S. Environmental Protection Agency 50
51 Data Resources National Oil & Gas Committee Information Repository Existing Studies EPA Natural Gas STAR Program Industry Surveys State Permitting/Inventory Data 7/18/2018 U.S. Environmental Protection Agency 51
52 Existing Studies National Oil & Gas Committee Information Repository Texas Commission on Environmental Quality (TCEQ) t_ei.html Western Regional Air Partnership (WRAP) 7/18/2018 U.S. Environmental Protection Agency 52
53 Industry Surveys Send directly to industry, focused or broad Recent Industry Surveys/Examples CenSARA TCEQ WRAP 7/18/2018 U.S. Environmental Protection Agency 53
54 State Permitting/Inventory Data Permit Applications Annual Emissions Inventory Submittals Dehydrator Simulation Software Gas Research Institute (GRI) GLYCalc Model ProMax, Aspen HYSYS, etc. Storage Tank Simulation Software American Petroleum Institute (API) E&P TANKS ProMax, Aspen HYSYS, etc. 7/18/2018 U.S. Environmental Protection Agency 54
55 State Permitting/Inventory Data EPA (Cindy Beeler) Presentation GRI-GLYCalc and E&P TANK Example Applications 12/NationalOGEmissionWorkGroup_031215_GLYCalc_EPT ank4.pdf Data may be used to develop nonpoint factors GRI-GLYCalc - fugitive gas composition and dehydrator emission factors E&P TANK VOC and HAP emission factors 7/18/2018 U.S. Environmental Protection Agency 55
56 GRI-GLYCalc Gas Composition 7/18/2018 U.S. Environmental Protection Agency 56

57 GRI-GLYCalc Gas Composition 7/18/2018 U.S. Environmental Protection Agency 57
58 GRI-GLYCalc Dehydrator Emissions 7/18/2018 U.S. Environmental Protection Agency 58

59 E&P TANKS 7/18/2018 U.S. Environmental Protection Agency 59
60 EPA Gas Composition Calculator Gas composition data used in the Tool for the following source categories: Associated gas Condensate tanks Crude oil tanks Dehydrators Fugitives Gas-actuated pumps Liquids unloading Loading operations Mud degassing Pneumatic devices Produced water tanks Well completions 7/18/2018 U.S. Environmental Protection Agency 60
61 EPA Gas Composition Calculator Excel-based workbook README sheet with description/instructions Calculator sheets for each source category User provides gas composition Weight % or Volume % Calculator generates Tool basin factors 7/18/2018 U.S. Environmental Protection Agency 61
62 Questions? /18/2018 U.S. Environmental Protection Agency 62