Impact of Variable Generation on the Vermont Transmission Grid. Chris Root Vermont Electric Power Company, Inc.
|
|
|
- Janis Lawrence
- 5 years ago
- Views:
Transcription
1 Impact of Variable Generation on the Vermont Transmission Grid Chris Root Vermont Electric Power Company, Inc.
2 VELCO-managed assets 738 miles of transmission lines, 115kV to 450kV, predominantly wooden H-frame construction (57) 115kV circuits = 514 miles (10) 230 kv & 345 kv circuits = 200 miles (1) 450 kv DC circuit = 54 miles 14,000 acres of rights-of-way 55 substations, switching stations and terminal facilities Equipment that enables interconnected operations with Hydro-Québec 52-mile high-voltage direct current line through the Northeast Kingdom owned by Vermont Electric Transmission Company (VETCO) 1500 miles fiber optic communication networks that monitor and control the electric system and provide the backbone for most Vermonters high-speed data internet access 2 2
3 Topic: the changing nature of Vermont s transmission grid No large generation sources Renewable Resource Impacts System constraints Future System Concerns 3 3

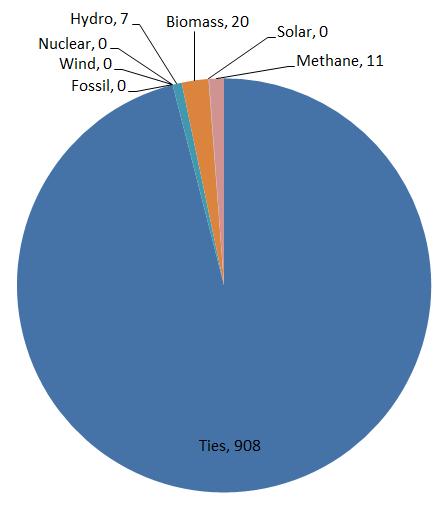
4 Vermont now imports close to half its power Type MW 2014 MW 2015 Fossil (fast start units) Winter Summer Hydro Wind Landfill gas 9 9 Biomass (wood) Nuclear Solar and other, e.g. methane ~100 and growing ~150 and growing TOTAL IN-STATE GENERATION % of 2014 hours VT was exporting power 84% of 2015 hours VT imported >400 MWs Vermont Peak Load is approximately 1000MW 4 4


5 2015 Vermont peak days 0 5 5
6 Impact of solar on VT load shape Load (MW) /30/2015 (Mon) 3/31/2015 (Tue) Cloud Cover Overcast Sunny High/Low ( F) Max Radiation (w/m^2) 41/26 42/ Overcast 2 weekdays with similar temperatures but large differences in cloud cover VELCO Load Curves (Overcast vs. Sunny Days) 3/30/2015 3/31/2015 Sunny 140 MW :00 1:00 2:00 3:00 4:00 5:00 6:00 7:00 8:00 9:00 10:00 11:00 12:00 Time 13:00 14:00 15:00 16:00 17:00 18:00 19:00 20:00 21:00 22:00 23:00 6 6
7 Solar impact on New England vs Vermont Peak solar day 4/13 Vermont s peak load reduction from solar is twice that of ISO-NE s VELCO vs. ISO-NE Load Curve 4/13/2015 (Tuesday) ISO-NE LOAD VELCO LOAD ISO-NE Δ = 687 MW (5%) Load (MW) VELCO Δ = 75 MW (10%) 600 Load (MW) :00 0:28 0:56 1:24 1:52 2:20 2:48 3:16 3:44 4:12 4:40 5:08 5:36 6:04 6:32 7:00 7:28 7:56 8:24 8:52 9:20 9:48 10:16 10:44 11:12 11:40 12:08 12:36 13:04 13:32 14:00 14:28 14:56 15:24 15:52 16:20 16:48 17:16 17:44 18:12 18:40 19:08 19:36 20:04 20:32 21:00 21:28 21:56 22:24 22:52 23:20 23:
8 ISO-NE draft 2016 cumulative PV forecast Nameplate Capacity, MW ac VT RI NH ME MA CT 0 Thru Forecast values include FCM Resources, non-fcm Energy Only Generators, and behind-the meter PV resources All values represent end-of-year installed capacities ISO-NE is working with stakeholders to determine the appropriate use of the forecast 8 8
9 Solar impacts on the grid Affects summer peaks; not a resource for winter peak Over 20% of peak load now PV, plus 15% of wind generation Increases operations complexity: 15% of operator time required to manage intermittent resources Requires critical grid management changes Voltage and frequency ride-through Visibility of generation to planners and operators Requires forecasting improvements May limit existing generation in constrained areas 9 9


10 Vermont Weather Analytics Center (VTWAC) Two-year, $16 million research undertaking to develop intellectual property using coupled data models and related software 2-year agreement/partnership with IBM 3 main goals: Increase grid reliability Lower weather event-related operational costs Optimize utilization of renewable generation resources 10 10
11 VTWAC Elements Vermont-specific version of IBM s Deep Thunder predictive weather model applies leading-edge analytics to in-state weather data to produce accurate weather forecasts up to 72 hours in advance and down to 2 km 2 Electric demand forecast model employs state usage data, coupled with Vermont-tailored Deep Thunder model, to increase state load forecast accuracy Renewable generation forecast model utilizes in-state data on renewable generation, coupled with a Vermont-tailored Deep Thunder model, to produce generation forecasts for solar and wind resources Stochastic bid model couples above electric demand and renewable generation forecast models to optimize value of Vermont s renewable generation, congestion and contingency analysis 11 11
 1 km 9 (i.e. DT) 12 12")
12 VTWAC Deep Thunder Forecast Observed radar on 5/27/14 Isolated supercell over Rutland that produced golf ball-sized hail, high wind gusts, and flash flooding Deep Thunder: Downscales WRF model to 1 km Horizontal Resolution: 13 km (i.e. GFS) 1 km 9 (i.e. DT) 12 12


13 VTWAC Severe Weather Precision DT Max Wind Gust Forecast GMP 1300 hrs 13 13

14 VTWAC Renewables Forecasting As renewable penetration increases, renewable forecasting accuracy becomes increasingly important Each point of forecasting accuracy translates into significant monetary value Accurate forecasts help with energy planning, energy balancing, dealing with intermittency, reducing transmission congestion, etc. IBM Research has developed a second generation renewable forecasting tool (R2) with unprecedented accuracy Results have shown unprecedented renewable forecasting accuracy 95% for utility scale solar, and 93% for wind Make use of Deep Thunder hyper-local hyper-accurate weather forecasting 14 14
15 15 15 VTWAC Solar Forecast Accuracy
")


16 Wind Generation Three wind farms in Vermont total 115 MW (13% of installed generation) Two of the wind farms are transmission constrained resulting in loss generation 13% of the time Working with three VT Utilities and ISO-NE to remove constraints Issue: Who pays? 16 16

17 17 17 Wind Impacts on Voltage
18 Voltage Control in Vermont is a Big Issue 5 Synchronous Condensers 4 Phase Shifting Transformers 1 STATCOM ± 100 MVAR 1 SVC (in licensing) Capacitor Banks Variable and Switched Reactors 1 switched (Vernon) 3 variable (2 at Coolidge and 1 at New Haven) 18 18
19 Summary VT Solar net metering at 15% of peak distribution demand Almost 25% PV when >100 kw plants added Peak Load is now after dark in summer Very little carbon based generation in state Voltage control is a significant issue Additional solar and wind resources are in licensing process (>125 MW) 19 19