Repurposing the Energy Infrastructure
|
|
|
- Penelope Norman
- 5 years ago
- Views:
Transcription
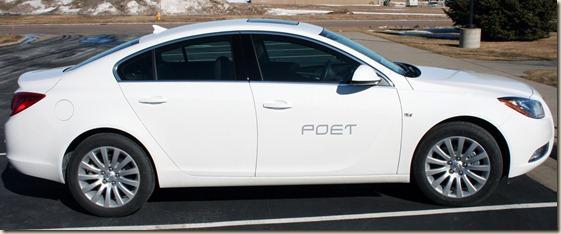
1 Repurposing the Energy Infrastructure Tuesday, May 3, 2011; 4:00 PM 5:15 PM Moderator: Joel Kurtzman, Senior Fellow; Executive Director, Center for a Sustainable Energy Future, Milken Institute Speakers: Frances Arnold, Dickinson Professor of Chemical Engineering and Biochemistry, California Institute of Technology, Co-Founder Gevo, Inc. Jeff Broin, Chairman and CEO, POET Karen Harbert, President and CEO, Institute for 21st Century Energy, U.S. Chamber of Commerce Steven (Mac) Heller, Executive Chairman, Coda Automotive Ally LaTourelle, Director of Government Affairs, Bio-Amber Inc.
2 Source: EIA High price of oil again?
3 Historic oil import displacement by Ethanol millions of barrels annually Source: Cardno ENTRIX


4 Natural gas Cleanest of the major fossil fuels


5 Transition to natural gas in transportation sector Sources: U.S. Energy Information Administration

6 Planned incorporation of biofuels resulting from Europe s Renewable Energy Roadmap 10% by 2020 bioethanol Source: European Commission
7 Biofuel mandates are ambitious European Union 10% of vehicle fuel to be derived from renewable sources by 2020 United States 9 billion gallons blended in 2008 (6% of vehicle fuel consumption) and 36 billion gallons of renewable fuel to be blended with gasoline by 2022 (26% of vehicle fuel if fuel consumption remains consistent) Source: Harvard Kennedy School of Government Biofuels and Sustainable Development.
8 Federal government s renewable fuel standard trajectory Billion gallons Total renewable fuel requirement Source: Energy Independence and Security Act of 2007.
9 World ethanol production 2008, 2009, and 2010 Country Millions of Gallons USA 9,000 10,600 13,000 Brazil 6,472 6,578 6,922 European Union 734 1,040 1,177 China Canada Other Colombia India Australia Total 17,245 19,530 22,670 With estimates for 23.4 billion gallons to be produced in 2011 Source: F.O. Lichts, Renewable Fuels Association.

10 Total cost of grid upgrades high and low estimates in three categories needing most upgrades $338 billion to $476 billion can result in benefits between $1.3 trillion and $2 trillion. Source: EPRI

11 EV Adoption EV market penetration (% of fleet) Electricity load increase (TWh) 1% 8 5% 41 10% 84 15% % % 840 Sources: Chart: McKinsey and Co., Map: Ford Motor Co. Ltd.
12 U.S. Electricity customers Load growth without increased EV adoption estimates Number of electric customers Load growth Residential 123,949, ,928,676 19,978,760 Commercial 17,377,219 20,178,151 2,800,932 Industrial 193, , ,942 Transportation Total 142,121, ,029,286 22,907,634 Does not consider EV load growth Source: EPRI


13 Fuel demands of transportation 6.5 million heavy duty trucks in U.S. fleet avg. 200,000 miles per year avg. 7.5 miles per gallon 2.3 million barrels of oil per day 250 million passenger cars in U.S. fleet avg. 10,000 miles per year avg. 20 miles per gallon 8.7 million barrels of oil per day-(cars, SUVs, & light trucks) Source: EIA, NRDC
14 Elements of the Smart Grid Higher functioning technology and infrastructure elements of the electricity delivery system beyond primary production transmission, substation, distribution, and customer interface Investment required to meet load growth and to correct deficiencies such as power flow bottlenecks and high-fault currents that damage critical equipment -- through equipment installation, upgrades and replacement. Investment needed to develop and deploy advanced technologies to achieve smart functionality of power delivery systems, and interface with distributed generation including renewable energy technologies.

15 Source: EIA Cost of delivered electricity by primary energy source

16 Sector share of U.S. energy consumption 2009 Sources: EIA.

17 Potential energy efficiency gains by sector and sector share of primary electricity production Source: EIA

18 Potential impact of efficiency on global energy demand Approximately 300 quadrillion Btu Source: WER/CERA
 Source: McKinsey & Company Residential Commercial")
19 Return on efficiency investment, by sector Present value of efficiency investments, $US billions cost of upfront efficiency investment energy savings ( ) Source: McKinsey & Company Residential Commercial Industrial

20 California emissions reduction goals California wishes to reduce emissions to 1990 levels by 2020 (426 MMt CO 2 e) Business as usual levels in 2020 are projected to be approximately 600 MMt CO 2 e Source: California Energy Commission


21 Synthetic Biology It is now possible to retrofit microorganisms to convert renewable resources to fuels and chemicals. Isobutanol Sugars Sugars Ethanol Genetic manipulations reprogram the cell to make new molecules.


22 Isobutanol: Multiple Feedstocks, One Gateway, Multiple Markets Today Feedstock Flexibility Retrofit Gateway Product Drop-in Chemicals Corn Future Sugar Cane Proprietary Platform: Yeast Isobutanol Drop-in Fuels Agricultural Residue Proprietary Separation Unit Wood
23 Petrochemical Industry Map Hydrocarbon Fuels Diesel Gasoline Jet Fuel Chemicals and Materials MTBE Polyethylene EDC Vinyl Chloride Poly(vinyl cloride) Ethylene Oxide Ethylene Glycol Polyester alpha-olefin Ethanol Isobutene Polyisobutylene Natural Gas Steam Cracking Olefins Ethylene Propylene Propylene Oxide Polyols Polypropylene Butylenes Acrylonitrile Polyacrylonitrile Butadiene Polybutadiene Pyrolysis Gasoline Cumene Phenol Acetone Butadiene-Styrene Polystyrene Ethyl Benzene Styrene ABS Methyl Methacrylate SB Latex Adipic Acid Nylon 66 Benzene Cyclohexane Caprolactam Nylon 6 Crude Oil Naphtha Aromatics Toluene Toluene Diamine Toluene Diisocyanate Polyurethane ortho-xylene Phthalic Anhydride Plasticizers Xylenes meta-xylene Isophthalic Acid Unsaturated Polyesters para-xylene Terephthalic Acid Polyesters (PET)
 Ethylene Oxide Ethylene Glycol Polyester alpha-olefin Ethanol Isobutene Polyisobutylene Natural Gas Steam Cracking Olefins Ethylene Propylene Propylene Oxide")
24 Isobutanol: A Gateway to Chemicals and Fuels 40% of petrochemicals and 100% of all fuels technically enabled CO 2 Hydrocarbon Fuels Diesel Gasoline Jet Fuel Chemicals and Materials MTBE Polyethylene EDC Vinyl Chloride Poly(vinyl cloride) Ethylene Oxide Ethylene Glycol Polyester alpha-olefin Ethanol Isobutene Polyisobutylene Natural Gas Steam Cracking Olefins Ethylene Propylene Propylene Oxide Polyols Polypropylene Butylenes Acrylonitrile Polyacrylonitrile Butadiene Polybutadiene Pyrolysis Gasoline Cumene Phenol Acetone Butadiene-Styrene Polystyrene Ethyl Benzene Styrene ABS Methyl Methacrylate SB Latex Adipic Acid Nylon 66 Benzene Cyclohexane Caprolactam Nylon 6 Crude Oil Naphtha Aromatics Toluene Toluene Diamine Toluene Diisocyanate Polyurethane ortho-xylene Phthalic Anhydride Plasticizers Xylenes meta-xylene Isophthalic Acid Unsaturated Polyesters para-xylene Terephthalic Acid Polyesters (PET)


25 Simple Retrofit: Add Yeast & Proprietary Separation Unit Ethanol Plant Capacity Isobutanol Projected Retrofit Cost 22 MGPY ~$17 MM 50 MGPY $22-24 MM 100 MGPY $40-45 MM BEFORE Luverne, MN Water AFTER Gevo s Integrated Fermentation Technology (GIFT )
 2006 2007 2008 2009 2010 Bio-isobutanol: 5yr Avg of $1.09/gallon lower cost (Backcast, Gevo process) Butene Cost Volatility 1.50 1.00 0.50 0.00-0.50-1.00-1.")
26 US$ / Gallon Cash US$ / Gallons Cash US$ / Gallon Cost Competitive With Lower Volatility Difference in Estimated Manufacturing Cost: Petro-Isobutanol vs Bio-Isobutanol (comparison by Month) Bio-isobutanol: 5yr Avg of $1.09/gallon lower cost (Backcast, Gevo process) Butene Cost Volatility (Month to Month Variability) St. Dev.: 8.7% Bio-Butene St. Dev.: 18.0% Petro-Butene Source: EIA, Nexant, CMAI, Gevo; Bio-isobutanol based on CBOT corn
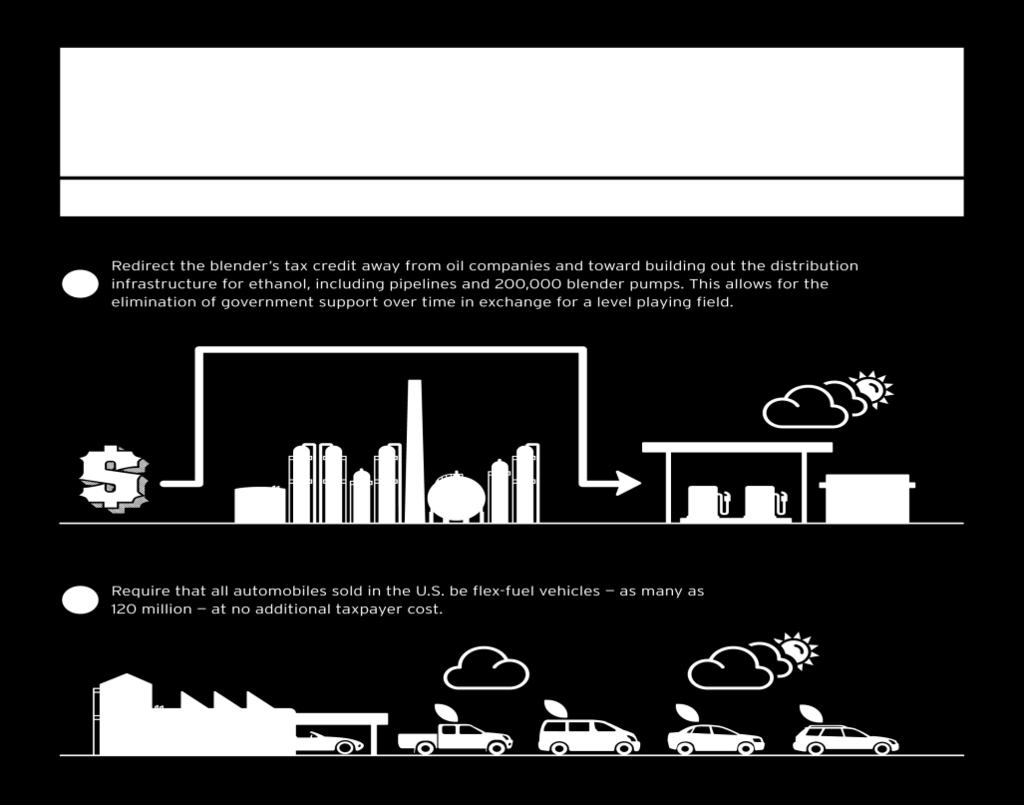
27 New biofuels need parity with ethanol in policy and regulation Logic is simple: US biofuels policy design for ethanol (because that s all we knew how to make) But ethanol is not isobutanol, or farnesane, or n-butanol, or. Therefore, US policy creates artificial barriers to entry Policy implications: Clean Air Act & RVP standard for gasoline (1 pound waiver) Loan Guarantee Programs, access & qualification IRS treatment, i.e., of platform molecules serving fuels or chemicals State level blending & labeling rules specify ethanol Infrastructure debate needs to broaden beyond ethanol
 50%")

28 Low Carbon Alternative Projected Lifecycle Greenhouse Emissions Using EPA Methods (Includes Indirect Land Use) 50% Reduction Gasoline Ethanol Isobutanol Isobutanol w/green Energy Isobutanol w/cellulosic Feedstock Source: EPA, WSP Environment and Energy


29 Regulatory Approval Status SOLVENTS None Required BIOJET ASTM Certification underway Planned completion 2013 RUBBER AND LUBRICANTS None Required SPECIALTY GASOLINE BLENDSTOCKS EPA Approved for isobutanol blend with gasoline up to 12.5%

30 Repurposing the Energy Infrastructure Ally LaTourelle, Esq. Dir. Government Affairs Panel Discussion, Milken Institute Global Conference May 5, 2011 Renewable Chemistry

31 Infrastructure Projects for Greatest Economic Benefit

32 Biobased Chemicals, Materials & Products

33 Biobased Chemical Technology at a Large Scale

34 Infrastructure and Manufacturing Opportunity for Production of Ethanol
35 Infrastructure and Manufacturing Opportunity for Biobased Chemicals, Materials & Products

36 U.S. Government Investment Needed


37 Comparison of Real" Gas Prices and Electricity Prices Over Time

38 Why We Should Fuel Cars with Electricity Instead of Gasoline Gasoline Expensive $0.17 / mi Priced by OPEC Volatile price Foreign-sourced feedstock Scarce Hurts national security Big footprint 350g CO 2 / mi Electricity Cost effective $0.02 / mi Priced by PUC or domestic market Stable price U.S.-sourced feedstock Plentiful Provides energy security Small footprint 150g CO 2 / mi
39

40
41

42 Ethanol Pipeline

43

44 Future Ethanol Production Potential Growth


45 Average U.S. Corn Yields Source: USDA

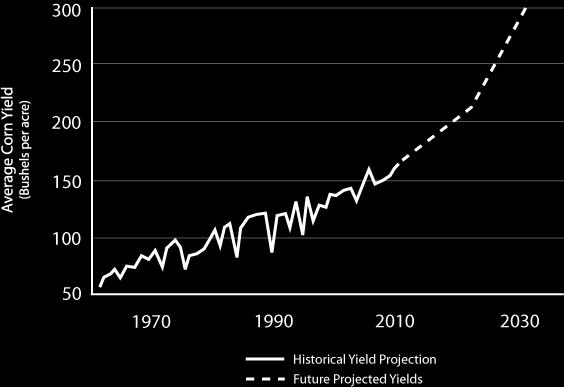
46 Corn Yield Projections