Energy & Sustainability
|
|
|
- Martha Patterson
- 5 years ago
- Views:
Transcription


1 Energy & Sustainability Lecture 24: Renewable Energy April 23, 2009
, account for over 99.")
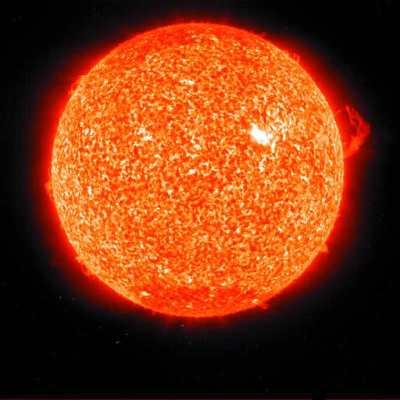
2 Renewable Energy Sources Solar the mother of all renewables Direct solar plus wind and wave power, hydroelectricity and biomass (indirect solar), account for over 99.9% of the available flow of renewable energy on Earth Geothermal the only renewable not from the Sun

3 174 petawatts
4 Solar Energy 174 PetaWatts (10 15 ) of incoming solar radiation (insolation) at the upper atmosphere Approximately half of it makes to the surface 100 x W x 3 x 10 7 s/yr =3 x J/yr = 3000 ZetaJoules Including atmospheric absorption we get: The total solar energy available to the earth is approximately 3850 zettajoules (ZJ) per year. Oceans absorb approximately 2850 ZJ/yr Winds can theoretically supply 6 ZJ/yr Biomass captures approximately 1.8 ZJ/yr Worldwide energy consumption was ZJ in 2004.

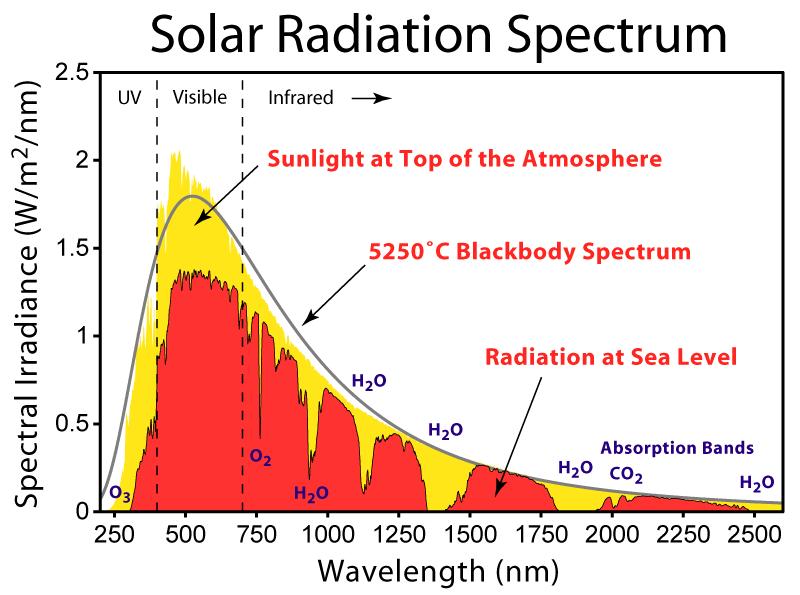
5 Insolation Top of the atmosphere! Surface of the earth!
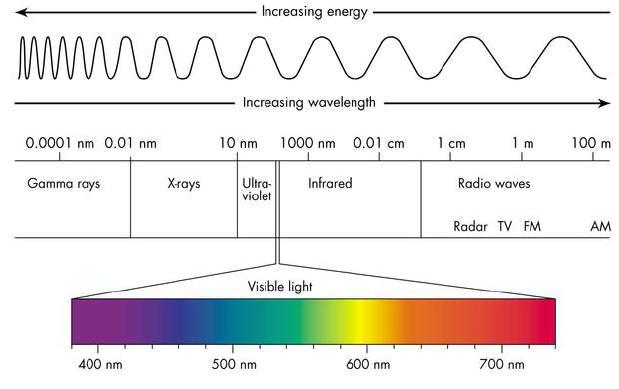
6 Photovoltaics The Photoelectric effect Metal Electron Energy Light Frequency Explained by Einstein in 1905 this is what he won his Nobel prize for!
")
7 Photovolatics Light comes in photons The energy of a photon is E = h f (where h is Planck s constant)
8 Photovolatics Light comes in photons The energy of a photon is E = h f (where h is Planck s constant) If the energy is high enough it can knock out an electron or it can t Electrons are free to move in metals If you hit them with 3eV the e will come out. In semiconductors there is a band gap where electrons can t travel
9 Photovoltaics In semiconductors, the filled band (valence band) and the band in which electrons are free to move (conduction band) are separated by a potential difference of about 1 volt. if light has an energy of about 1 ev it can push an electron from the valence band into the conduction band. The electron in the conduction band is free to move. If it is kept from recombining, it can give up its energy in an external circuit before coming back to the material.


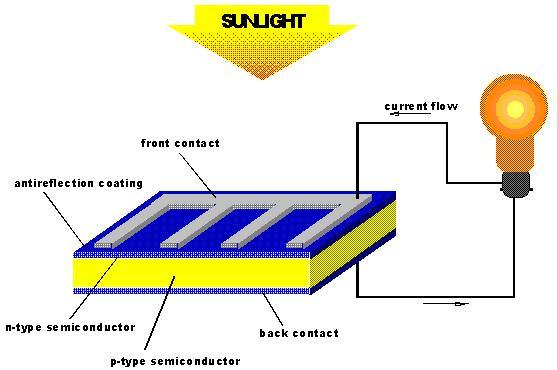
10 Photovoltaics Pure Silicon is doped with impurities to give the material either extra mobile electrons (n type) or extra holes where there are no electrons (p type).
11 Photovoltaics Pure Silicon is doped with impurities to give the material either extra mobile electrons (n type) or extra holes where there are no electrons (p type).
12 Photovoltaics Pure Silicon is doped with impurities to give the material either extra mobile electrons (n type) or extra holes where there are no electrons (p type). If you combine these in layers
13 Photovoltaics Pure Silicon is doped with impurities to give the material either extra mobile electrons (n type) or extra holes where there are no electrons (p type). If you combine these in layers This makes a diode (a device in which current can only flow in one direction) If you shine light on this it can produce an electric current This is a Photo (light) volatic (voltage producing) device
14
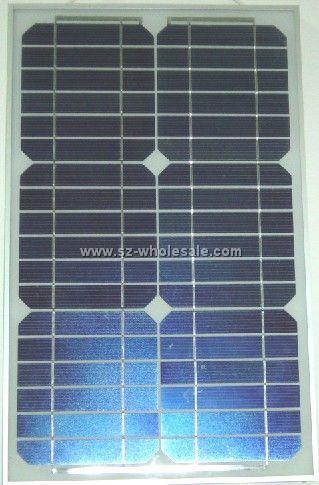
15 Photovoltaics Several materials available Silicon Gallium Arsenide Aluminum Gallium Arsenide
16

17 Photovoltaic Efficiency About half the energy in sunlight is unusable by most PV cells because this energy is below the band gap, and so can t free an electron from the valence to the conduction band, or because it carries excess energy, which must be transferred to the cell as thermal energy, heating up the cell.
18


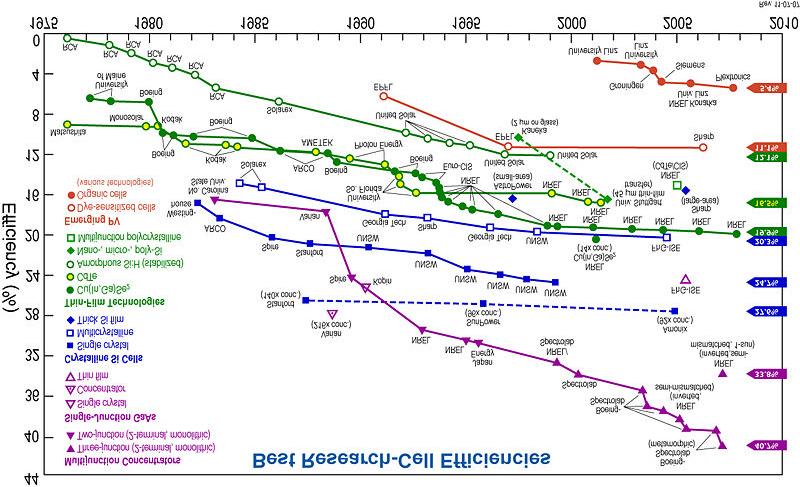
19 40% Efficiency Solar Cells Most conventional solar cells used in today s applications, such as for supplemental power for homes and buildings, are one sun, single junction silicon cells that use only the light intensity that the sun produces naturally, and have optimal efficiency for a relatively narrow range of photon energies. Spectrolab group has experimented with concentrator multijunction solar cells that use high intensities of sunlight, the equivalent of 100s of suns, concentrated by lenses or mirrors. Significantly, the multijunction cells can also use the broad range of wavelengths in sunlight much more efficiently than single junction cells.
20
 In practice power rating in peak watts (Wp) of cells is determined by measuring the maximum power when exposed")
21 Air Mass 1/cos θ Standard test conditions for PV cells and modules 25 o C, 1000 W/m 2, AM 1.5 (can be reached early afternoon on a sunny summer day ) In practice power rating in peak watts (Wp) of cells is determined by measuring the maximum power when exposed to radiation of lamps designed to reproduce the spectrum at standard conditions

22 Australia Norway
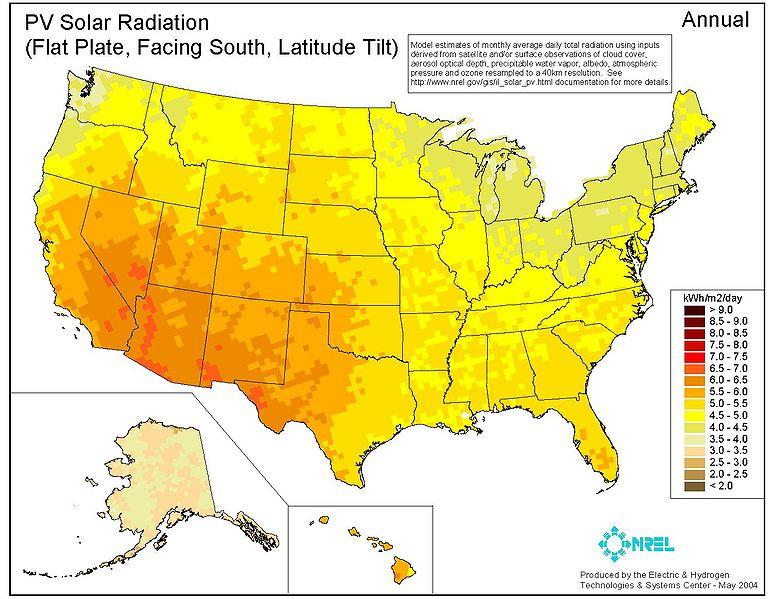
23 Grid Parity Grid parity, the point at which photovoltaic electricity is equal to or cheaper than grid power, is achieved first in areas with abundant sun and high costs for electricity such as in California and Japan. Grid parity has been reached in Hawaii and other islands that otherwise use diesel fuel to produce electricity. George W. Bush has set 2015 as the date for grid parity in the USA
24
25 Energy used to make Photovoltaics Studies of Photovoltaic (PV) materials that make up the majority of the active solar market found that solar cells pay for themselves in terms of energy in a few years (1 5 years): Crystalline silicon PV systems presently have energy payback times of years for South European locations and years for Middle European locations. For silicon technology clear prospects for a reduction of energy input exist, and an energy pay back of 1 year may be possible within a few years. Thin film technologies now have energy pay back times in the range of years (S.Europe). With lifetimes of such systems of at least 30 years, the EROEI is in the range of 10 to 30. They thus generate enough energy over their lifetimes to reproduce themselves many times.
26 Photovoltaics Energy Storage is still an issue Daily Seasonal weather
27 Advantages PV Summary The 89 petawatts of sunlight reaching the earth's surface is plentiful almost 6,000 times more compared to the 15 terawatts of average power consumed by humans. Solar electric generation has the highest power density (global mean of 170 W/m 2 ) among renewable energies. Solar power is pollution free during use. Production end wastes and emissions are manageable using existing pollution controls. End of use recycling technologies are under development. Facilities can operate with little maintenance or intervention after initial setup. Solar electric generation is economically superior where grid connection or fuel transport is difficult, costly or impossible.
28 PV Summary Advantages (cont). When grid connected, solar electric generation can displace the highest cost electricity during times of peak demand (in most climatic regions), can reduce grid loading Once the initial capital cost of building a solar power plant has been spent, operating costs are extremely low compared to existing power technologies.
29 PV Summary Disadvantages Solar electricity is almost always more expensive than electricity generated by other sources. Solar electricity is not available at night and is less available in cloudy weather conditions. Therefore, a storage or complementary power system is required. Limited power density: Average daily insolation in the contiguous U.S. is 3 7 kw h/m 2 and on average lower in Europe. Solar cells produce DC which must be converted to AC (using a grid tie inverter) when used in currently existing distribution grids. This incurs an energy loss of 4 12%

30 Wind Power In the 14th century the Dutch started using windmills By the 1800s they had 10,000 windmills Today they have 1,000 modern windmills


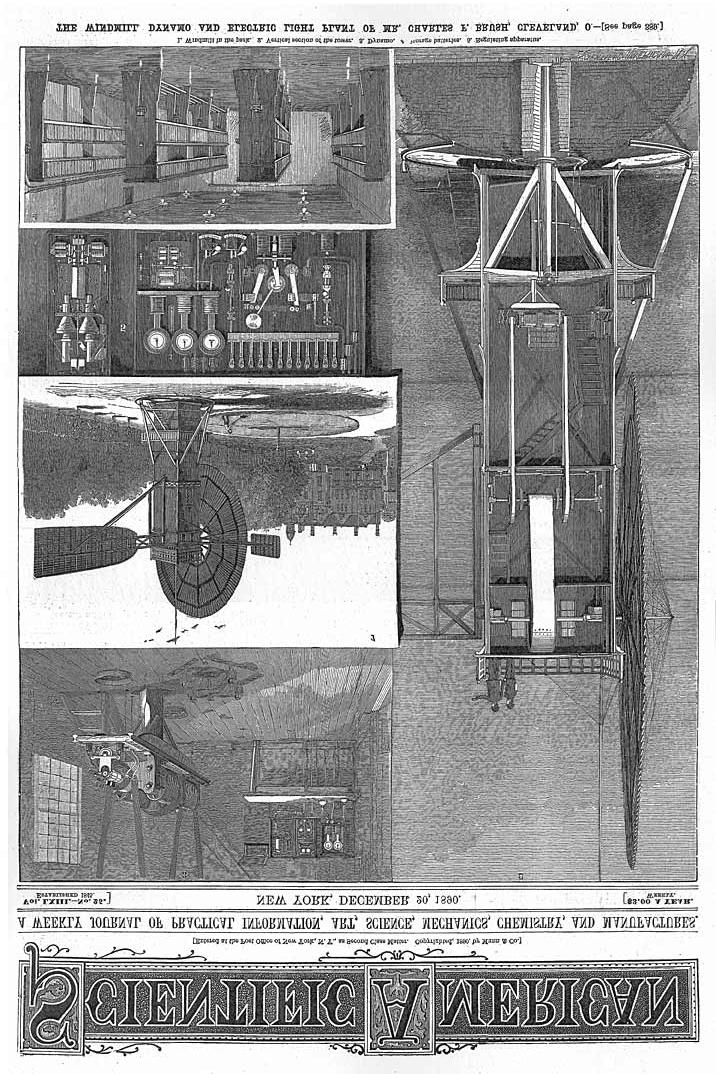
31 During the winter of Charles Brush built what is today believed to be the first automatically operating wind turbine for electricity generation. It was a giant the World's largest with a rotor diameter of 17 m (50 ft.) and 144 rotor blades made of cedar wood.
32
33 The turbine ran for 20 years and charged the batteries in the cellar of his mansion. Brush s Windmill only generated 12kw It turned slowly with lots of blades It was later discovered that faster windmills with less blades generated more power

34 Danish scientist Poul la Cour ( )

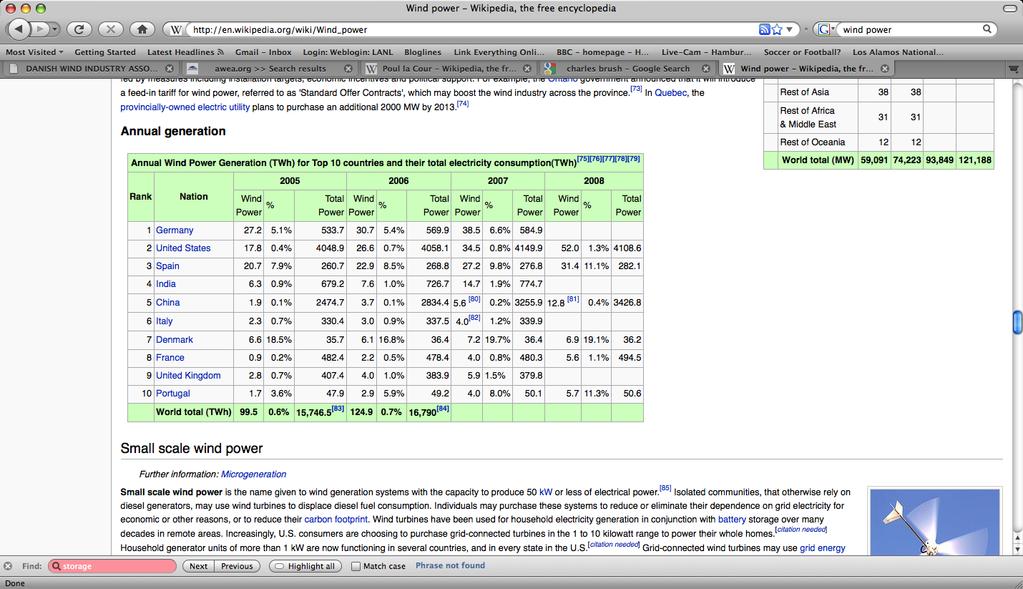
35 Copenhagen Harbor Danes get 20% of elec. from wind
36
37
38
39 Wind power Wind Energy goes like wind speed to the 3 rd power Consider a mass of air that pass a windmill in 1 sec it has a mass, m and speed v. The energy required to slow this down goes ½ mv 2 However the mass of the air passing the windmill in 1 sec depends (linearly) on the wind speed (m=ρav) so the energy goes like v 3

40 Measurement in 2002 at the Lee Ranch facility in Colorado

41 The cartoon shows how a cylindrical slice of air 1 meter thick moves through the 2,300 m 2 rotor of a typical 1,000 kilowatt wind turbine. With a 54 meter rotor diameter each cylinder weighs 2.8 tonnes Rotor area goes like the square of the blade length

42 750 kw NEG Micon Turbine in Moorhead Minnesota. > half of the energy available arrived in just 15% of the operating time. wind energy does not have as consistent an output as fuel fired power plants; Making wind power more consistent requires that storage technologies must be used to retain the large amount of power generated in the bursts for later use.
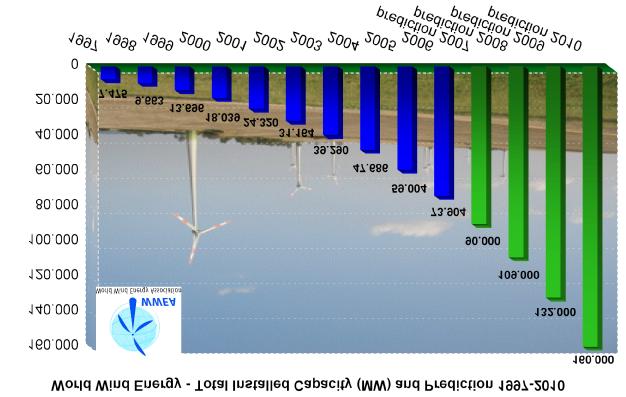
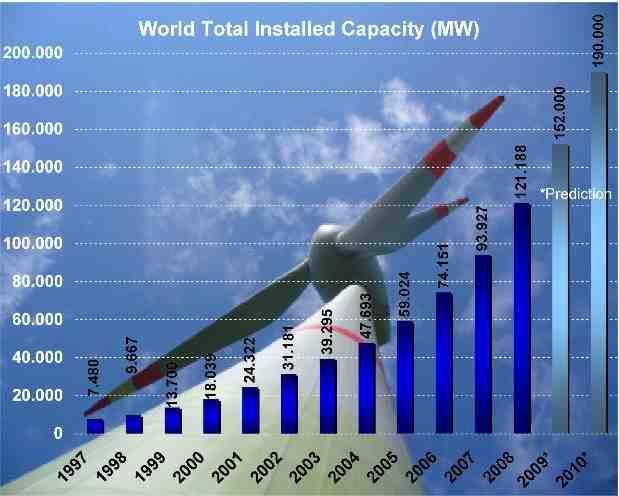
43 From American Wind Association
44 The ratio of actual productivity in a year to this theoretical maximum is called the capacity factor. Typical capacity factors are 20 40%, with values at the upper end of the range in particularly favorable sites A 1 megawatt turbine with a capacity factor of 35% will not produce 8,760 megawatt hours in a year, but only 0.35x24x365 = 3,066 MWh, averaging to 0.35 MW
45
46 Other renewables Biomass Tidal Power Wave Energy Geothermal Energy
47 Last Homework will be posted on the web tonight Next week: Tuesday: CO2 emissions and greenhouse gas effect Thursday: Review Final: Tue, May 5