MARKHAM NORTH-SOUTH LINK CORRIDOR PUBLIC TRANSIT IMPROVEMENTS
|
|
|
- Coleen Wade
- 5 years ago
- Views:
Transcription


1 MARKHAM NORTH-SOUTH LINK CORRIDOR PUBLIC TRANSIT IMPROVEMENTS Environmental Assessment Report York Region Rapid Transit Plan March 2006 FINAL

2 E. SUMMARY E.1 BACKGROUND York Region s Official Plan places a strong emphasis on significantly increasing public transit use to accommodate future transportation needs and support the Plan s vision of sustaining the natural environment, optimizing economic vitality and ensuring healthy communities. The Region s 2002 Transportation Master Plan (TMP) has reaffirmed the need to achieve a balanced transportation system by implementing rapid transit in four corridors. The TMP incorporates the Government of Ontario s Growth vision for fostering and managing growth. In the planned rapid transit network, shown in Figure E-1, three of the corridors comprise north-south rapid transit facilities. These are the Yonge Street corridor connecting Newmarket Regional Centre to the Yonge Subway, a link from the Vaughan Corporate Centre to the Spadina Subway and a link from the proposed Markham Centre to the Sheppard Subway. Figure E-1 York Region Rapid Transit Network The fourth corridor is an east-west rapid transit facility in the Highway 7 corridor connecting to all three of the north-south rapid transit lines, to the Region of Peel in the west and to the Region of Durham in the east. In June 2002, Regional Council endorsed the proposal of York Consortium to establish a public private partnership for implementation of the York Rapid Transit Plan (YRTP), a program of rapid transit projects designed to form a transit network in York Region. Transportation and environmental planning studies for the Markham North-South Link Corridor were commenced in September On July 13th, 2004, the Ministry of the Environment (MOE) approved the Terms of Reference for the Environmental Assessment of Public Transit Improvements in the Markham North-South Link Corridor. These Terms of Reference set out the requirements for the Environmental Assessment in accordance with Section 6.1(2) of the Ontario Environmental Assessment Act. Reflecting the range of possible alignment options for the undertaking, as described in the Terms of Reference, an initial study area was defined to cover the area bounded by Leslie Street/Don Mills Road to the west, McCowan Road to the east, 16 th Avenue to the north and Sheppard Avenue to the south. This study area, including its context with the Greater Toronto Area, is shown on Figure E-2. The study area includes portions of the Town of Markham and the City of Toronto, as well as a small portion of Richmond Hill in the Beaver Creek Business Park area. In the Markham North-South Link Corridor, the purpose of the undertaking can be summarized as: Providing improved public transit infrastructure and service in this northsouth corridor, capable of producing significant increases in transit ridership both within the corridor and across the network and regional boundary. This objective will be supported by interconnection with other corridors and GTA transit systems such as the Highway 407 transitway, GO Transit and the TTC Sheppard Subway. Integrating improved transit facilities in a manner that enhances and enriches streetscapes with new amenities by using a holistic urban design approach to support the Region s goals for mixed-use transitoriented development along the corridor. Figure E-2 Study Area for Public Transit Improvements in the Markham North-South Link Corridor E The purpose of this report is to document the scope and findings of the EA study assessing the effects on the environment of both construction and subsequent operation of improved public transit service along the corridor. E.2 PURPOSE OF THE UNDERTAKING The purpose of the Undertaking, Public Transit Improvements in the Markham North-South Link Corridor, encompasses two fundamental objectives: to respond to growth pressures by providing a high quality improved public transit alternative to reduce automobile dependence, and to help make the Region s urban centres more liveable, pedestrianoriented and economically viable by providing a valuable tool for structuring and achieving land use and social objectives. TO1793 Markham North South Link Corridor Public Transit Improvements Environmental Assessment 28/02/2006 E - 1
3 E E.3 RATIONALE FOR THE UNDERTAKING E.3.1 Need and Justification Chapter 2 of this EA document presents an overview of existing conditions in the study area. This work confirms and supports the general problems highlighted in the York Region Transportation Master Plan (TMP) and can be summarized as follows: Road capacity constraints, which lead to increased travel times, congestion and air pollution; Low transit accessibility, both in terms of service levels and service coverage connecting major destinations, which in turn leads to low transit mode shares and a high reliance on automobiles; Limits on urban development, due to the fact that the road system alone cannot support the levels of development anticipated in the Region, particularly key centres such as Markham Centre; Sustainability issues, which stem from a high dependence on automobiles, including air pollution, greenhouse gas emissions, and inability to respond to changes such as fuel supply limitations/price increases, which are anticipated over the next 30 years; Lack of accessibility, for those individuals who cannot afford to drive a car, or do not have access to a car (e.g. students, elderly persons); Improving public transit in the corridor has the potential to address these problems. In the context of York Region s Official Plan objective of achieving a significant increase in transit s share of peak period travel, this initial study and subsequent further analysis using updated modelling in 2004, investigated a range of transportation solutions for the Corridor. In accordance with the requirements of the EA Act, these solutions were defined and evaluated as alternatives to the proposed Undertaking. E.4 ALTERNATIVES TO THE UNDERTAKING Five alternatives were defined and compared in terms of their ability to address the shortfall in transportation system capacity and other social and environmental issues such as a lack of modal choice and environmental impacts of vehicle use. These included: a Do Nothing alternative, a Current Commitments or base case solution comprising committed improvements to highway and arterial road networks along with ongoing increases in local conventional bus service, an auto-focussed alternative adding enough road system capacity beyond that currently committed to eliminate the capacity shortfall, the current commitments alternative combined with enhanced interregional bus and rail transit service and capacity on the existing GO commuter rail lines and the 400-series highways, the proposed undertaking, namely current commitments plus public transit improvements such as the Region s planned rapid transit network comprising dedicated transitways on the surface along with extensions of Toronto s existing subway system into the Region. Evaluation of these alternatives led to the conclusion that: Both the Do Nothing alternative and the Current Commitments solution would not address the estimated road capacity deficiency and further expansion of the road system beyond the current commitments was not possible without unacceptable disruption of the social environment, degradation of the natural environment and cost, Enhancing inter-regional bus and rail services in the corridor will not reduce the road capacity shortfall significantly because more frequent rail service attracts primarily downtown-toronto destined trips and interregional bus service on Highway 404 bypasses the core development nodes along the corridor. In addition, the location of the inter-regional transit routes does not support the urban form envisioned in the Region s Official Plan and thus will not encourage transit-oriented development within the region. If the Region s Official Plan urban form and development vision is to be achieved in a sustainable manner, public transit improvements in the form of a higher order rapid transit facility, fully integrated with the GTA rapid transit network will be required. The rapid transit alternative is best able to meet long-term growth needs and planning objectives while offering the opportunity to mitigate high costs and local environmental impacts by maximizing the use of existing transportation corridors. The preferred alternative solution consisting of Public Transit Improvements was selected because it will: address road capacity shortfalls while building person-carrying capacity for the longer term; increase transit mode shares across the Steeles Avenue screenline (Don Mills Road to McCowan Road) from 10% in 2001 to 23% in 2031; contribute to the social environment by reducing neighbourhood traffic infiltration, reducing traffic accident potential, and offering improved access to community amenities by providing a convenient alternative to auto use; minimize environmental impacts by reducing emissions from single-occupant vehicles and minimizing the need for extensive road widenings; support the Region s Official Plan and centres and corridors urban form and municipal development objectives. E.5 ALTERNATIVE METHODS OF CARRYING OUT THE UNDERTAKING Developing a preferred alternative for improving public transit in the Markham North-South Corridor involved several elements. Alternatives for each of the following elements were developed and evaluated in order to identify the preferred strategy for the corridor: Transit service quality Transit technologies Transit routings Physical infrastructure E.5.1 Transit Service Quality Improvements Various methods of improving transit service quality were assessed in order to determine which elements should be carried forward as part of the preferred undertaking. These included: Increasing frequency and coverage increasing the frequency of existing bus services and expanding the number of routes serving the study area; Circulator buses providing service to employment areas using smaller circulator buses; Transit priority expediting transit services through traffic signal priority and/or queue jump lanes; TO1793 Markham North South Link Corridor Public Transit Improvements Environmental Assessment 28/02/2006 E - 2
4 Improved transit stops providing more shelters and improving access to/from transit stops (e.g. constructing sidewalks, making stops wheelchair accessible). E Evaluation and Section of Preferred Alternative Service Quality Improvements In isolation of other improvements, increasing the frequency of transit may not be enough to make people switch to transit, since buses would still be impacted by traffic congestion. As a result, this method is not considered to be an acceptable stand-alone option for improving public transit. However, service improvements would complement other transit improvements and would be an integral part of the network of services including the preferred undertaking. Similarly, introducing circulator buses into employment areas is only effective if there are high-quality and high frequency services to connect to. The preferred undertaking of implementing rapid transit would support the implementation of neighbourhood/employment area circulator bus services in the future. However, these services are not included as part of the preferred undertaking and can be pursued outside of the EA process. Introducing transit priority measures has the potential to improve transit travel times, thereby increasing the overall attractiveness of transit. Improving transit stops will also serve to improve comfort and safety for transit riders. Transit priority measures and improved transit stops are an integral part of the preferred undertaking. E.5.2 Transit Technologies A comprehensive range of technologies was initially examined as part of the EA including: Conventional Bus - an integral part of any enhanced transit system, either serving to feed a rapid transit system or as an integral part of a bus-based system. Bus Rapid Transit (BRT) - a flexible form of rapid transit that combines transit stations, vehicles, services, running way, and ITS elements into an integrated system. Light Rail Transit (LRT) - a flexible transportation mode that can operate in a variety of settings. LRT is a relatively low cost form of rail technology, usually obtaining electric power from overhead wires. Diesel Multiple Units (DMU) - a modern form of a diesel-powered rail car. DMU s are self-propelled and distinguished from current commuter rail equipment with each vehicle motorized rather than pushed or pulled by a heavy diesel engine. This type of technology would operate on conventional rail tracks, for example the GO Stouffville Line. Automated Guideway Transit (AGT) this technology uses fully automated driverless trains, with fully grade-separated operations, typically on an elevated guideway. Heavy Rail: - this technology would consist of high capacity rail cars operating in trains of two or more cars on fixed rails in separate rightsof-way (ROW). This concept is used to serve very high volume corridors with capacities requirements in the order of 30,000 to 50,000 peak hour passengers per direction. E Evaluation and Selection of Preferred Technology Ridership forecasts indicate a potential peak transit demand of approximately 3,000 passengers per hour per direction (pphpd) for the segment on Warden Avenue south of Enterprise Drive in The proposed two lane exclusive transitway, with at-grade intersections and either BRT or LRT technology, is able to accommodate these volumes. E.5.3 Alternative Routings E Initial Screening of Routing Options The York Region Transportation Master Plan identified several options for providing a connection between Markham Centre and the Sheppard Subway, but did not conduct a detailed screening of potential options. At the outset of the EA all possible routes/corridors that could be considered for public transit improvements, while fulfilling the goal of providing a link between Markham Centre and the Sheppard subway, or its extensions, were identified (See Exhibit 5-2 in Chapter 5) An initial screening process was applied to these routes to eliminate routes that were clearly not suitable for facilitating improved transit, or were less acceptable in terms of social, economic or natural environment impacts. The initial screening of routes considered the ability of the alignment alternatives to respond to five primary objectives. These included: Protecting and enhancing the social environment; Protecting and enhancing the natural environment; Promoting smart growth, economic development; Providing an effective transportation service; and, Maximizing cost-effectiveness. For each of the above objectives, a range of goals was established to provide a measure of the effectiveness of each alternative in meeting the objectives. A key factor in selecting routes for further consideration was their potential to significantly improve transit ridership to/from and within the study area. Other considerations included the type of land use adjacent to the route. Routes selected for more detailed evaluation are shown on Figure E-3. These routes were presented to the public in June 2003 and again for comment at the final public information centre in April Figure E-3 Short-Listed Transitway Corridor Options Don Mills Rd/Leslie Street Woodbine/Highway 404 Warden/Victoria Park E TO1793 Markham North South Link Corridor Public Transit Improvements Environmental Assessment 28/02/2006 E - 3
5 E E Evaluation and Selection of Preferred Corridors Three potential corridors emerged from the initial screening of routing options: Don Mills Road/Leslie Street Woodbine Avenue/Highway 404 Warden Avenue/Victoria Park Ave Each of these corridors was assessed in terms of the following: Accessibly Impacts Impacts on Natural Environment Land Use Impacts Transit Ridership Potential Compatibility with other planned transportation improvements Costs Based on the assessment, which relied on both quantitative and qualitative measures, Warden Avenue was selected as the preferred corridor for public transit improvements, including rapid transit. Compared to other corridors: E Routing Options In the City of Toronto As described previously, the EA study area extends to Sheppard Avenue in the City of Toronto. Since the City of Toronto is not a proponent in the EA, this study will not define specific infrastructure to address needs within the higher-order transit and transit priority corridors as envisioned in the Toronto Official Plan. A future study (or studies) will be required by the City of Toronto to define transit service and infrastructure south of Steeles Avenue to address needs within the City of Toronto. Since York Region does not have the jurisdictional authority to construct any physical infrastructure within the City of Toronto without an agreement with Toronto, an important aspect in the development of alternatives within this EA is to consider how potential services and infrastructure north of Steeles Avenue could be integrated with the long term transit planning objectives of the City of Toronto. In discussions with the Toronto staff, it was determined that any transit service crossing into Toronto would have to respect the jurisdictional boundary of the TTC. In general, any York Region service crossing into Toronto could drop-off passengers en route to the proposed terminus of the service at the Sheppard Subway. In the northbound direction, any York Region Transit service could only pick-up riders destined for York Region. Separate curbside lanes that are fully dedicated for buses, or operate as combined transit/hov lanes; An exclusive two-way median transitway in the centre of the roadway with vehicular traffic either side of the transitway. E Evaluation and Selection of Preferred Physical Infrastructure A detailed evaluation of alternative physical infrastructure alternatives was undertaken for the Markham North South Link Corridor. This evaluation was based on three main factors; transportation, human environment and economic considerations. The factors were further divided into indicators that were considered most pertinent to the evaluation. The result of the evaluation indicated that a median transitway was generally preferred for the following reasons: It had the best transportation service quality; It was deemed the safest as it had the least number of conflict points at intersections; It provided good opportunity to mitigate the impact of local traffic and property access issues; and It was also considered more desirable as it allowed for better streetscaping opportunities. Warden Avenue has the highest density of population and jobs in the longer term; Warden Avenue has the greatest transit ridership potential, as measured by total boardings; Warden Avenue has the highest potential for transit-supportive development; Although Warden Avenue was selected as the preferred corridor for rapid transit, the analysis also demonstrated that transit improvements are warranted in the Don Mills Road/Leslie Street Corridor. Specifically, the Highway 404/7 commercial node currently has the highest concentration of employment in York Region and would benefit from enhanced transit service. There is a need for a transit connection between Don Mills Station on the Sheppard Subway and the Highway 404/7 commercial node in the near term. Since much of the corridor consists of low-density stable residential development, transit demands could be met by a limited stop express-type service with transit priority measures, in addition to local services. This will be investigated in greater detail by the Region through a separate EA for transportation improvements in the Don Mills/Leslie Street corridor from Steeles Avenue to 16 th Avenue. With these limitations in mind, this EA will only go as far as identifying the transit service characteristics and any limited infrastructure south of Steeles Avenue required to directly support the York Region undertaking that is being defined in this EA. The development of rapid transit in Warden Avenue north of Steeles Avenue can be designed to respond to various routing opportunities in the City of Toronto as they evolve. E.5.4 Alternative Physical Infrastructure Given the diversity of conditions in the Markham North-South Corridor, combined with the fact that the analysis of travel patterns indicated that public transit improvements should be considered in more than one corridor, it is appropriate to examine a range of physical infrastructure alternatives. Physical infrastructure alternatives essentially consist of alternatives for locating rapid transit, or enhanced transit, within the road R.O.W. and include the following: Queue jump lanes, which provide priority for transit vehicles at intersections or other bottle-necks; However, the choice of physical infrastructure depends on local conditions including: Available R.O.W. width; Number of driveways and type of traffic using the driveways (e.g. cars or heavy trucks); and, Potential for routing changes (i.e. in the southern portion of the study area routings may be modified if the Sheppard Subway is extended). Therefore, all three alternatives are carried forward for more detailed assessment as part of the preferred design. However, the preferred configuration for the ultimate rapid transit network is a median transitway. TO1793 Markham North South Link Corridor Public Transit Improvements Environmental Assessment 28/02/2006 E - 4
6 E.5.5 Preferred Alternative Method for Improving Public Transit In the Markham Link Corridor Figure E-4 Preferred Alternative Method of Improving Public Transit in the Markham N-S Corridor and Relation to Other Corridors E The preferred alternative method of improving public transit in the Markham North-South Link Corridor is to implement surface rapid transit in the Warden Avenue Corridor, with connections to existing and potential future rapid transit services in the City of Toronto. This corridor improvement will be supported by the implementation of transit priority on parallel routes, consistent with the York Region Transportation Master Plan. The preferred strategy for the Markham North-South Link Corridor illustrated on Figure E-4. The first stage of the evolution of rapid transit corridor is the implementation of a higher frequency, limited stop service utilizing modern buses to establish a transit connection between Markham Centre and the Sheppard Subway. This is referred to as the VIVA Phase 1 service, which has been in operation since Fall At such time when demand warrants, the next step for the preferred corridor would be to construct median transit lanes on Warden Avenue from Enterprise Drive to Denison Street. In the longer term, these median transit lanes could be extended south to connect with a future higher order transit service in Toronto such as the Finch Hydro corridor or an extension of the Sheppard Subway. Highway 7 VIVA Corridor Highway 407 GO Transit Corridor Priority Transit on Don Mills/Leslie and other corridors (per York Region Transportation Master Plan) Potential Higher-Order Transit Corridors (City of Toronto O.P.) Potential Transit Priority Corridors (City of Toronto Official Plan) Surface Rapid Transit on Warden Avenue (Subject to Detailed Investigation) Potential Long Term Surface Rapid Transit Connection to City of Toronto (Subject to Detailed Investigation) Possible Surface Rapid Transit Connections to City of Toronto (Subject to Detailed Investigation) Bus Rapid Transit to Don Mills Station using Existing Corridors Although not part of the preferred undertaking, an important enhancement to public transit in the study area would be the implementation of transit priority improvements on Don Mills/Leslie Street north of Steeles Avenue to allow for expedited transit services between Don Mills Station and the Highway 404/7 commercial node. These services would connect to the planned Don Mills Higher Order Transit corridor south of Steeles Avenue and be integrated with future initiatives in that corridor. Transit priority measures would also be implemented on other roadways as identified in the York Region Transportation Master Plan. The City of Toronto has initiated an EA to examine transit needs for Don Mills south of Sheppard. TO1793 Markham North South Link Corridor Public Transit Improvements Environmental Assessment 28/02/2006 E - 5
7 E E Technology Strategy The preferred strategy is to implement surface rapid transit in the Warden Avenue corridor with connections to existing and future rapid transit systems in the City of Toronto. The initial technology will be Bus Rapid Transit (BRT). This technology provides sufficient capacity to handle the projected transit ridership demands while allowing for flexibility of routing over time as the corridor develops and future rapid transit alternatives are established in the City of Toronto. Bus Rapid Transit also allows for seamless travel from other rapid transit corridors in York Region and can be implemented in a phased manner. In the longer term, Light Rail Transit (LRT) could also perform the function of providing surface rapid transit. LRT has similar operating characteristics and physical requirements as BRT, but generally provides for higher capacities. In order to maintain flexibility for evolving needs, and potential future opportunities in the corridor over the longer term, LRT technologies were carried forward as an alternative method of improving public transit. The decision to convert to LRT technology as defined in this EA would be subject to Regional Council Approval during an open session. The introduction of LRT in the York Region portion of the corridor would be predicated on the availability of LRT facilities connecting to the Sheppard Subway. The development of LRT in the City of Toronto would require a separate study and approvals process. E.6 DEVELOPMENT AND EVALUATION OF ALTERNATIVE DESIGNS The Alternatives Analysis phase of the EA identified Warden Avenue as the preferred corridor for the implementation of surface rapid transit. The next stage in the analysis was to identify specific alignment options and the physical design of the transitway and associated roadway components. Given that the Markham N-S Link Corridor is diverse in terms of land uses and existing/potential road infrastructure to accommodate rapid transit, the analysis of alignment options was carried out on a segmental basis using four basic segments. These segments are as follows: Segment A Warden Avenue: Highway 7 to Enterprise Drive Segment B Warden Avenue: Enterprise Drive to 14 th Avenue Segment C Warden Avenue: 14 th Avenue to Denison Street Segment D East/South Connecting Routes Segment E Denison Street to Steeles Avenue The detailed evaluation within each segment, summarized in the main EA report, considered the ability of the alignment alternatives to respond to four main objectives including: Protecting and enhancing the social environment. Protecting and enhancing the natural environment. Promoting smart growth, economic development; Providing an effective transportation service; and, Maximizing cost-effectiveness. For each of the above objectives, a range of goals and indicators was established to provide a measure of the effectiveness of each alternative in meeting the objectives. E.6.1 Segment A: Highway 7 to Enterprise Drive The Technically Preferred route for the Highway 7 Transitway (separate EA) is to travel across Warden Avenue on Enterprise Drive to a new dedicated transit facility that would swing north into Town Centre Boulevard. Stations would be located east of Warden Avenue as well as in front of IBM opposite IBM s private access road. The extension of dedicated transit lanes across Warden Avenue and the proposed Rouge River valley is included as part of the Highway 7 Transitway EA. The most direct route to connect the Markham N-S Link into the Highway 7 Transitway is to do so at the intersection of Warden Avenue and Enterprise Drive with the station just east of Warden Avenue being used for passenger transfer. This alignment has been selected as the preferred design. However, at such time as the Highway 7 Transitway connection west of Warden Avenue becomes available, other routing options using these corridors may be pursued for the Markham N-S Link. Figure 8-1 in Chapter 8 of this report illustrates a potential concept that would provide for the routing integration of the Markham N-S Link and the Highway 7 Transitway services while providing improved access for IBM. This routing option would utilize the IBM ramp and the proposed new crossing of the Rouge River west of Warden Avenue and opposite Enterprise Drive. E.6.2 Segment B: Enterprise Drive to 14 th Avenue This section includes the crossing of Highway 407 and the CN York Subdivision. In 2005, York Region commenced construction to widen Warden Avenue from 4 lanes to 6 lanes from south of 14 th Avenue to north of Highway 7. The preferred alternative for the longer term is to establish a median transitway along this segment of Warden Avenue. Two cross section options were considered for this segment: A median transitway plus 6 traffic lanes, which would be accommodated by widening Warden Avenue beyond the planned future 6 lanes (B.1). A median transitway plus 4 traffic lanes, which would be accommodated by converting two regular traffic lanes (from a total of 6 in the future) to dedicated transit lanes (B.2). The preferred alternative is to design for a median transitway plus 6 traffic lanes (B.1) since the analysis undertaken as part of this EA has confirmed the need to maintain 6 traffic lanes. E.6.3 Segment C: 14 th Avenue to Denison Street Warden Avenue between 14 th Avenue and Steeles Avenue has been identified for widening to six lanes in York Region s 10 year capital plan, pending recommendations on rapid transit alignments. As with the northerly section, two cross section options were considered for this section: A median transitway plus 6 traffic lanes, which would be accommodated by widening Warden Avenue beyond the planned future 6 lanes (C.1). A median transitway plus 4 traffic lanes, which would be accommodated by widening Warden Avenue for transit only (C.2). Traffic analyses undertaken as part of the EA indicate that with the planned extension of Rodick Road and Birchmount Road across Highway 407 combined with the planned Kennedy Road widening, future traffic volumes on Warden Avenue south of 14 th Avenue can be accommodated with 4 lanes for general traffic. In addition, with an available R.O.W. width of 36m, it would not be possible to accommodate six lanes of traffic plus a median transitway without significant impacts to adjacent properties. Based on the above, the preferred alternative is to maintain 4 general traffic lanes on Warden Avenue south of 14 th Avenue and reserve the remaining R.O.W. for a median transit facility (Alternative C.2). E.6.4 Segment D: East/South Connecting Routes This section is an important connection through the Markham employment lands and is also the transition to routes in the City of Toronto. TO1793 Markham North South Link Corridor Public Transit Improvements Environmental Assessment 28/02/2006 E - 6
8 Two primary route options were investigated: E.6.5 Segment E Denison Street to Steeles Avenue Figure E-5 Preferred Alignment and Station Locations E From Warden Avenue, west on Denison Street to Esna Park Dr and then south on Esna Park Drive, continuing south across Steeles Avenue to Pharmacy Avenue (D.1). From Warden Avenue, west on Denison Street to Victoria Park Ave, then south on Victoria Park Avenue across Steeles Avenue (D.2). The Esna Park Avenue alignment follows the planned VIVA Phase 1 routing. It was selected for VIVA Phase 1 because it bisects two large employment centres on Steeles Avenue IBM Canada and the Liberty Centre. There are merits in maintaining the VIVA Phase 1 alignment for the future rapid transit service because the infrastructure for stations will be in place and VIVA Phase 1 will have built a ridership base along this alignment. Therefore, the Denison Street Esna Park Drive alternative (D1) was selected as the preferred alignment. For the preferred alignment, two alternatives were considered for locating the transit service: Mixed traffic operations with Queue Jump lanes on Denison Street at Warden Avenue (D.1a). An exclusive two-way median transitway in the centre of the roadway with eastbound and westbound vehicular traffic either side of the transitway (D.1b). This option would maintain four lanes for regular traffic as exists today. In the evaluation and selection of potential routing options, Warden Avenue was chosen as the preferred routing. In the short term, Denison Street is the preferred routing for the east-west connection to Pharmacy Avenue and Gordon Baker Road (to connect with the VIVA Phase 1 alignment) and existing/future City of Toronto transit corridors. In the longer term, it would be logical to connect surface rapid transit routes using Warden Avenue north of Steeles Avenue to potential future rapid transit services in the City of Toronto, specifically the planned extension of the Sheppard Subway and a potential rapid transit network in the Finch Hydro corridor. For this reason, the preferred undertaking includes the portion of Warden Avenue between Denison Street and Steeles Avenue in the Region of York. This segment could augment or replace the routing using Denison Street and Esna Park Drive. Within the City of Toronto, the system could operate in mixed traffic or potential future dedicated lanes. The impacts of providing dedicated transit lanes on Warden Avenue between Denison Street and Steeles Avenue are detailed in Chapter 9. Widening Denison Street to provide for a full median transitway would provide the best service for rapid transit. However, it would have significant effects on adjacent properties since additional R.O.W. would be required this would impact parking for adjacent buildings. Considering the impacts on adjacent properties and the lack of serious congestion problems outside of relatively short peaks, the preferred alternative is to operate the rapid transit system in mixed traffic on Denison Street and Esna Park Drive, but mitigate any traffic capacity issues by providing queue jump lanes (D.1a). Specifically, transit vehicles would access a median transit lane between Hood Road and Warden Avenue, which would allow them to by-pass eastbound traffic queues approaching Warden. Note: Preferred alignment south of Steeles Avenue will be confirmed upon completion of future studies of potential transit improvements by the City of Toronto/TTC. TO1793 Markham North South Link Corridor Public Transit Improvements Environmental Assessment 28/02/2006 E - 7
9 E E.7 THE UNDERTAKING From analyses and evaluations of alternative transportation solutions, alternative methods and alternative designs, a dedicated facility for rapid transit service located along the existing Warden Avenue was recommended as the preferred undertaking. The service would connect to similar services in the Highway 7 corridor and also connect to existing rapid transit services in the City of Toronto along existing routes. The length of dedicated transitway would extend from Enterprise Drive south of Highway 7 to Steeles Avenue. The preferred alignment with station locations is illustrated in Figure E-5. The preferred undertaking for which York Region is seeking approval consists of: 1. A median transitway on Warden Avenue between Enterprise Drive and Denison Street that will initially utilize BRT technology with potential conversion to LRT subject to ridership demands; 2. Transit operation in mixed traffic from Warden Avenue, west on Denison Street to Esna Park Drive, south on Esna Park Drive across Steeles Avenue to Pharmacy Avenue; and 3. The protection of the right of way on Warden Avenue south of Denison Street to Steeles Avenue for potential future transit expansion. E.7.1 Supporting Initiatives To promote smart growth and economic development in the corridor To provide an effective transportation service The issue of cost-effectiveness was considered qualitatively in selecting the preferred undertaking. Goals defined by professionals in the study team are subsets of these objectives and refer to an environmental value or criterion. The effect of the proposed undertaking in terms of each environmental value was rated using a qualitative scale ranging from a positive or beneficial effect through negligible to a potentially significant negative effect in is presented in detail in Section 10.4 of the main report. E.9 IMPLEMENTATION CONSIDERATIONS The Markham N-S Link Corridor Public Transit Improvements undertaking, described in Chapter 9, is one of three north-south corridors in York Region s proposed four-corridor Rapid Transit Plan. Travel demand modelling has indicated that rapid transit service on Warden Avenue will attract a high level of transit ridership contributing to the overall network. Consequently, the Region s plans for the evolution of the network place a high priority on early implementation of facilities and service in this corridor. This Environmental Assessment Study constitutes the first step in the implementation process, which will include all the traditional phases of preliminary and detailed design, construction, testing and commissioning of systems and installations and finally operation of rapid transit service. A major challenge with the study area is that few residents live along the corridor, which is comprised mainly of commercial uses and employment lands. This made it difficult to generate interest among the general public. One of the steps that was taken to overcome this was to essentially go to the public by holding PCCs in the Markham Civic Centre on evenings where other activities were scheduled, and to hold additional PCCs in First Markham Place, a busy mall within the study area. Since employees and business owners are un-inclined to come out to evening events, a project description and request for comments was dropped-off by walk-about to all properties along the corridor, with a mail-back comment form. Overall, from the verbal and written comments received, there is strong support for improved transit in the Markham Corridor, and York Region as a whole. Consistent with the overall intent of implementing a wide range of public transit improvements, in addition to the recommended alignment for the Markham N-S Link Rapid Transit Corridor, it is recommended that improved transit services be pursued in other corridors. Specifically, it is recommended that consideration be given to implementing transit priority measures on Don Mills Road/Leslie Street between Steeles Avenue and Highway 7 to facilitate increases service levels and improved transit travel times for the Highway 404 / Highway 7 employment node (to be addressed in detail through a separate EA). The Construction Phase Pending funding, the first priorities for the construction of transitway segments are south Yonge Street (Steeles Avenue to Langstaff Road) following by Highway 7 East. The timing of construction of the Markham Link is less certain, but is expected to occur within the next 5 to 10 years. It is assumed that, if approved, construction of York s Rapid Transit Network will begin immediately after receiving funding. E.8 PROJECT RELATED EFFECTS AND MITIGATION E.9.1 Public Outreach The evaluation of project-related effects was performed using the same general objectives used to evaluate alternatives to the undertaking and alternative methods. These objectives are: To protect and enhance the social environment in the corridor To protect and enhance the natural environment in the corridor The Markham North-South Link Corridor Public Transit Improvements Environmental Assessment has conducted a public consultation program comprising five series of information centres. These have afforded the general public and other stakeholders the opportunity to view design alternatives and their evaluation, express concerns related to environmental effects and provide input to the development of mitigation measures. TO1793 Markham North South Link Corridor Public Transit Improvements Environmental Assessment 28/02/2006 E - 8
10 TABLE OF CONTENTS E. SUMMARY...1 E.1 BACKGROUND...1 E.2 PURPOSE OF THE UNDERTAKING...1 E.3 RATIONALE FOR THE UNDERTAKING...2 E.3.1 NEED AND JUSTIFICATION...2 E.4 ALTERNATIVES TO THE UNDERTAKING...2 E.5 ALTERNATIVE METHODS OF CARRYING OUT THE UNDERTAKING...2 E.5.1 TRANSIT SERVICE QUALITY IMPROVEMENTS...2 E.5.2 TRANSIT TECHNOLOGIES...3 E.5.3 ALTERNATIVE ROUTINGS...3 E.5.4 ALTERNATIVE PHYSICAL INFRASTRUCTURE...4 E.5.5 PREFERRED ALTERNATIVE METHOD FOR IMPROVING PUBLIC TRANSIT IN THE MARKHAM LINK CORRIDOR...5 E.6 DEVELOPMENT AND EVALUATION OF ALTERNATIVE DESIGNS...6 E.6.1 SEGMENT A: HIGHWAY 7 TO ENTERPRISE DRIVE...6 E.6.2 SEGMENT B: ENTERPRISE DRIVE TO 14TH AVENUE...6 E.6.3 SEGMENT C: 14TH AVENUE TO DENISON STREET...6 E.6.4 SEGMENT D: EAST/SOUTH CONNECTING ROUTES...6 E.6.5 SEGMENT E DENISON STREET TO STEELES AVENUE...7 E.7 THE UNDERTAKING...8 E.7.1 SUPPORTING INITIATIVES...8 E.8 PROJECT RELATED EFFECTS AND MITIGATION...8 E.9 IMPLEMENTATION CONSIDERATIONS...8 E.9.1 PUBLIC OUTREACH INTRODUCTION Purpose of the Markham North South Link Corridor Public Transit Improvements Report PURPOSE OF THE PROJECT Context Problem Statement for Markham North South Link Corridor Objectives RELATIONSHIP WITH OTHER CORRIDORS RELATIONSHIP WITH CITY OF TORONTO STUDY PROCESS REPORT ORGANIZATION STUDY BACKGROUND DEFINITION OF STUDY AREA OVERVIEW OF EXISTING CONDITIONS IN STUDY AREA The Built Environment DESCRIPTION OF THE NATURAL ENVIRONMENT TRANSPORTATION ENVIRONMENT Local Transit Network VIVA Transit Network GO Bus Services GO Rail Provincial Highway Network Municipal Road Network EXISTING AND HISTORICAL POPULATION AND EMPLOYMENT SOCIO-DEMOGRAPHIC FACTORS AND TRENDS Auto Ownership Income Levels FUTURE TRANSPORTATION IMPROVEMENTS Road Networks Transit Improvements ANALYSIS AND EVALUATION OF ALTERNATIVES TO THE UNDERTAKING DESCRIPTION OF ALTERNATIVES TO THE UNDERTAKING Do Nothing A Current Commitments Strategy Including Priority Transit and Transportation Demand Management An Enhanced Road Capacity Solution An Enhanced Inter-regional Transit Solution York Region Public Transit Improvements ANALYSIS OF ALTERNATIVE TRANSPORTATION SOLUTIONS Forecast of Future Travel Demand Future Travel Demand Patterns Modelling of Alternative Transportation Solutions Alternative Solutions: Demand vs. Capacity Analysis Alternative Solutions: Impacts on Mode Shares Criteria for Evaluation of Alternative Solutions Evaluation of Alternative Transportation Solutions FORECAST OF TRAVEL DEMAND WITH PUBLIC TRANSIT IMPROVEMENTS FUNCTION OF THE PROPOSED MARKHAM LINK CORRIDOR PUBLIC TRANSIT IMPROVEMENTS EXISTING CORRIDOR TRAVEL PATTERNS EXISTING TRANSIT RIDERSHIP... 2 TO1793 Markham North South Link Corridor Public Transit Improvements Environmental Assessment 28/02/2006 1
11 4.2 TRAVEL DEMAND AND TRANSIT RIDERSHIP PROJECTIONS THE DEMAND FORECASTING MODEL MODELING SCENARIOS AND ASSUMPTIONS RIDERSHIP FORECASTS RAPID TRANSIT PASSENGER VOLUMES ALTERNATIVE METHODS OF IMPROVING PUBLIC TRANSIT TRANSIT RIDERSHIP PATTERNS METHODOLOGY USED TO SCREEN AND EVAULATE ALTERANTIVE METHODS SERVICE QUALITY ALTERNATIVES INCREASING THE FREQUENCY AND COVERAGE OF SERVICES INTRODUCING SMALLER CIRCULATOR SHUTTLES IMPROVED TRANSIT STOPS IMPROVING TRANSIT PRIORITY SCREENING OF ALTERNATIVE SERVICE QUALITY IMPROVEMENTS ALTERNATIVE TRANSIT TECHNOLOGIES TRANSIT TECHNOLOGIES CONSIDERED SCREENING OF TRANSIT TECHNOLOGIES DESCRIPTION OF PREFERRED TECHNOLOGIES TRANSIT CORRIDOR ALTERNATIVES INITIAL SCREENING OF TRANSIT CORRIDORS ROUTING OPTIONS IN THE CITY OF TORONTO DETAILED ASSESSMENT OF PREFERRED CORRIDORS SUMMARY AND EVALUATION OF ROUTE ALTERNATIVES ALTERNATIVE PHYSICAL INFRASTRUCTURE IMPROVEMENTS STRATEGY FOR IMPROVING PUBLIC TRANSIT IN THE MARKHAM NORTH- SOUTH CORRIDOR DETAILED EXISTING CONDITIONS IN CORRIDOR TRANSPORTATION ENVIRONMENT Local/Regional Transit Network Existing Roadway Network Pedestrian/Cycling Network Pedestrian/Cycling Demand NATURAL ENVIRONMENT Physiography and Soils Geology/Hydrogeology Horizontal Groundwater Movement Groundwater Recharge/Discharge Areas Well Distribution Aquatic Habitats and Communities Wildlife and Wildlife Habitat Designated Natural Areas Contaminated Sites Drainage Patterns Water Quality SOCIAL ENVIRONMENT Land Ownership Patterns Land Use Designations Land Use along the Corridor Future Development Plans Recreation and Tourism Areas Services and Utilities CULTURAL HERITAGE RESOURCES Environmental Assessment & Cultural Heritage Resources Cultural Landscapes & Built Heritage Features Identification of Built Heritage Features & Cultural Heritage Landscapes Archaeological Resources EXISTING NOISE AND VIBRATION LEVELS Predominant Land Uses Approach Used Traffic Noise Prediction Results for Existing Conditions Sound Level Monitoring at Receptor Locations Background/ambient Sound Level Monitoring Results Comparison of Traffic Noise with Measured Background Noise Levels Existing Vibration Levels along Warden Avenue AIR QUALITY Existing Environmental Conditions Air Dispersion Modelling Methodology PLANNING AND DESIGN PARAMETERS RAPID TRANSIT DESIGN OBJECTIVES DESIGN CRITERIA General Description of Surface Rapid Transit Principal Design Criteria STATION DESIGN FEATURES FARE COLLECTION... 2 TO1793 Markham North South Link Corridor Public Transit Improvements Environmental Assessment 28/02/2006 2
12 8. DEVELOPMENT AND SELECTION OF PREFERRED DESIGN EVALUATION METHODOLOGY EVALUATION OBJECTIVES, GOALS AND INDICATORS DEVELOPMENT OF SEGMENT ALIGNMENT ALTERNATIVES SEGMENT A PREFERRED ALIGNMENT AND POTENTIAL FUTURE OPPORTUNITIES SEGMENT B ALTERNATIVE METHODS SEGMENT C ALTERNATIVE METHODS SEGMENT D ALTERNATIVE METHODS SEGMENT D ALTERNATIVE CROSS-SECTIONS SEGMENT E ALTERNATIVE ALIGNMENT THE PREFERRED DESIGN DESCRIPTION OF THE PREFERRED DESIGN Transitway Elements Horizontal Alignment Vertical Alignment and Pavement Widening Intersection Design Structures Modifications to Existing Highway 407 Interchange Stations Park and Ride Facilities Bus Bay Considerations at Don Mills Station Integration with Potential Future Station on Highway 407 Transitway SERVICE PLAN Near-Term Service Design Longer-Term Service Design Concepts Longer-Term Service Levels PROJECT ACTIVITIES Pre-construction Phase Construction Activities Operation Phase PROJECT STAGING DESIGN ATTRIBUTES AND BUILT-IN MITIGATION ASSESSMENT OF THE PREFERRED DESIGN ASSESSMENT METHODOLOGY ASSESSMENT RESULTS PROJECT-RELATED EFFECTS AND MITIGATION ANALYSIS OF ENVIRONMENTAL EFFECTS AND MITIGATION OBJECTIVE A: To protect and enhance the social environment in the corridor OBJECTIVE B: To protect and enhance the natural environment in the corridor OBJECTIVE C: To promote smart growth and economic development in the corridor OBJECTIVE D: To provide an effective transportation service ENVIRONMENTAL EFFECTS ASSESSED FOR CEAA REQUIREMENTS Cumulative Environmental Effects Timelags whereby the effects of short-term activities are not experienced until the future Effects of a Project Malfunction or Accident Effects of the Environment on the Undertaking Full Life-Cycle Effects IMPLEMENTATION PROCESS CONTEXT PROJECT IMPLEMENTATION PLAN The Design Phase The Construction Phase ENVIRONMENTAL COMMITMENTS Construction Monitoring Operations Monitoring MODIFYING THE PREFERRED DESIGN PUBLIC AND AGENCY INVOLVEMENT PUBLIC INVOLVEMENT PROGRAM Public Consultation Centres Facts Sheets York Rapid Transit Program Website STAKEHOLDERS MEETINGS MUNICIPAL APPROVALS... 5 TO1793 Markham North South Link Corridor Public Transit Improvements Environmental Assessment 28/02/2006 3
13 LIST OF APPENDICES LIST OF FIGURES LIST OF FIGURES Appendix A Appendix B Appendix C Appendix D Appendix E Appendix F Appendix G Appendix H Appendix I Appendix J Appendix K Appendix L Appendix M Appendix N Term of Reference Public Consultation Reports Municipal Correspondence and Council Resolutions Transportation Assessment Natural Sciences Report Cultural Heritage Resource Assessment Report Built Heritage and Cultural Heritage Landscapes Noise and Vibration Impact Assessment Geotechnical Investigation Report Contaminated Sites Report Stage 1 Archaeological Assessment Air Quality Impact Assessment York Region Transportation Master Plan Storm Water Management Preliminary Assessment Response to Comments from Government Review Team on Draft EA Figure E-1 York Region Rapid Transit Network...E.1 Figure E-2 Study Area for Public Transit Improvements in the Markham North-South Link Corridor...E.1 Figure E-3 Short-Listed Transitway Corridor Options...E.3 Figure E-4 Preferred Alternative Method of Improving Public Transit in the Markham N-S Corridor and Relation to Other Corridors...E.5 Figure E-5 Preferred Alignment and Station Locations...E.7 Figure 1-1 Planned Rapid Transit Network Figure 1-2 Relationship of Markham N-S Link Corridor to other Interconnected Corridors Figure 1-3 Environmental Assessment Process Figure 2-1 Study Area for the Markham North-South Link Corridor Public Transit Improvements Figure 2-2 Study Area Land Use Figure 2-3 Natural Heritage Features Figure 2-4 Existing Transit Services Figure 2-5 Study Area Road Network Figure Population Figure Employment Figure Average Household Income Figure 2-9 Future Transportation Improvements Figure 3-1 Automobile Trips Crossing North of Steeles Avenue Screenline Figure 3-2 Screenlines for Demand Capacity Analysis Figure 3-3 Demand vs. Capacity for Screenline 1 - South of Highway Figure 3-4 Demand vs. Capacity for Screenline 2 - South of 14th Avenue Figure 3-5 Demand vs. Capacity for Screenline 3 North of Steeles Avenue Figure 3-6 Demand vs. Capacity for Screenline 4 South of Finch Avenue Figure 3-7 Demand vs. Capacity for Screenline 1 - South of Highway Figure 3-8 Demand vs. Capacity for Screenline 2 - South of 14th Avenue Figure 3-9 Demand vs. Capacity for Screenline 3 North of Steeles Avenue Figure 3-10 Demand vs. Capacity for Screenline 4 South of Finch Avenue Figure 3-11 Impact on Mode Shares in 2021 and Figure 4-1 Study Area Travel Patterns (2001 AM Peak Period Total Trips) Figure 4-2 Population Growth York Region Municipalities, Figure 4-3 Employment Growth in York Region Municipalities, Figure 4-4 Assumed Rapid Transit Network for Modelling Purposes Figure 4-5 AM Peak Hour Link Volume 2021 BRT Figure 4-6 Origin and Destination Patterns of Transit Riders Using the Markham North-South Link (AM Peak Period) Figure 4-7 AM Peak Period Boarding / Alighting 2021 Base Case Figure 5-1 Origin Destination Patterns for Transit Trips Crossing the North of Steeles Avenue Screenline Figure 5-2 Potential Routes for Public Transit Improvements Figure 5-3 Short Listed Transitway Corridor Options Figure 5-4 Gross Urban Density (2001) Figure 5-5 Gross Urban Density (2021) Figure 5-6 Significant Employment Nodes Figure 5-7 Population and Employment in Proximity to Transit Corridors (Markham and Toronto Study Areas) Figure 5-8 Population and Employment in Proximity to Transit Corridors (2021) (North and South Study Areas) Figure 5-9 Alternative Physical Infrastructure Options Figure 5-10 Preferred Alternative Method of Improving Public Transit in the Markham N-S Corridor and Relation to Other Corridors Figure 6-1 Existing Natural Environment in Warden Avenue Corridor Figure 6-2 Watersheds and Drainage Figure 6-2 Built Heritage Figure 6-3 Wind Rose for Pearson International Airport Figure 6-4 MOE Monitoring Locations Figure 7-1 Typical Two-Lane Exclusive Transitway TO1793 Markham North South Link Corridor Public Transit Improvements Environmental Assessment 28/02/2006 4
14 LIST OF FIGURES LIST OF TABLES LIST OF TABLES Figure 8-1 Figure 8-2 Figure 8-3 Figure 8-4 Figure 8-5 Preferred Alignment and Potential Future Opportunities Segment A Highway 7 to Enterprise Drive Alternative B1 - Median Transitway plus 6 Traffic Lanes Alternative B2 - Median Transitway plus 4 Traffic Lanes Alternative C1 - Median Transitway plus 6 Traffic Lanes Alternative C2 - Median Transitway plus 4 Traffic Lanes Alternative D1 Denison/Esna Park Alternative D2 Denison/Victoria Park Alternative D1 (a) Denison/Esna Park with Transit in mixed traffic except at approach to Warden Alternative D1 (b) Denison/Esna Park with median transitway plus 4 lanes of general traffic Figure 9-1 Preferred Alignment and Station Locations Figure 9-2 Typical BRT Transitway Cross-section 6-lane Traffic with 1.0 m Raised Median Figure 9-3 Typical LRT Transitway Cross-section 6-lane Traffic with 1.0 m Raised Median Figure 9-4 Typical BRT Station Cross-section 6-lane Traffic with Left Turn Lane Figure 9-5 Typical LRT Station Cross-section 6-lane Traffic with Left Turn Lane Figure 9-6 Typical BRT Transitway Cross-section 4-lane Traffic with 4.0 m Streetscape Median Figure 9-7 Typical BRT Station Cross-section 4lane Traffic with Left Turn Lane Figure 9-8 Station Layout and Landscaping Opportunities Figure 9-9 Proposed Median Access for Emergency Vehicles (Warden Avenue north of Denison Street) Figure 9-10 Warden Avenue Crossing Highway Figure 9-11 Warden Avenue Crossing CN York Subdivision Table 2-1 Existing Transit Routes Table 2-2 Population and Employment Growth, 1986 to Table 2-3 Auto Ownership Levels, Table 3-1 Summary of Alternative Transportation Strategies Table 3-2 Origin-Destination Patterns of Automobile Trips Crossing North of Steeles Avenue Screenline Table 3-3 Evaluation of Alternatives to The Undertaking Table 4-1 Existing Transit Ridership 2003/04 (AM Peak Period) Table 4-2 Stouffville GO Rail Ridership ( ) Table 4-3 Population and Employment Growth Forecasts, 2001 to Table 4-4 Speed and Headway Assumptions Table 4-5 Park and Ride Lot Capacities Table Ridership Summary for the Markham Link Table AM Peak Hour Ridership by Segment for Markham Link Corridor Table 4-8 (A.M. Peak 3-Hour Period Volumes Screenline North of Steeles between Don Mills and Kennedy) Table 4-9 AM Peak (3-Hour) Period Total Trips and Transit Modal Split Table 5-1 Screening of Alternatives to Improve Service Quality Table 5-2 Preliminary Screening of Transit Technologies Table 5-3a Screening of Rapid Transit Routing Alternatives North-South Alternatives Routes North of Steeles Avenue Table 5-3b Screening of Rapid Transit Routing Alternatives North-South Alternatives Routes South of Steeles Avenue Table 5-3c Screening of Rapid Transit Routing Alternatives East-West Alternatives Routes South of Steeles Avenue Table 5-4 Number of Watercourse by Corridor Table 5-5 Peak Period Ridership for Selected Lines in Table 5-6 Compatibility of Alternative Corridors with other Improvements Table 5-7 Evaluation of Routing Alternatives Table 5-8 Evaluation of Alternative Physical Infrastructure Alternatives Table 6-1 Roadway Cross-Section Summary for Warden Avenue North Table 6-2 Average Annual Daily Traffic Counts on Warden Avenue Table 6-3 Cross-Section Features of Other Facilities Used by Markham N-S Link Table 6-4 Average Annual Daily Traffic Counts on Other Facilities Table 6-5 Existing AM Peak Intersection Operations Table 6-6 Existing PM Peak Intersection Operations Table 6-7 High Pedestrian Areas Table 6-8 Total Number of Properties Representing Potential Environmental Concern Table 6-9 Water Quality at Station #DGM Table 6-10 Water Quality at Station #R Table 6-11 Cultural Heritage Table 6-12 Archaeological Sites Within ~2 Kilometres Of The Study Area Table 6-13 Predicted Existing Daytime and Nighttime Traffic Noise Levels Table 6-14 Summary of receptor locations Table 6-15 Comparison of Measured With Predicted Traffic Noise Levels Table 6-16 Stability Class Distribution Toronto Pearson Int'l Airport Table 6-17 Provincial Air Quality Criteria for TSP Table 6-18 Air Quality Criteria for PM10 and PM Table 6-19 Air Quality Criteria for Dustfall Table 6-20 MOE Ambient Air Quality Criteria for Criteria Air Contaminants Table 6-21 Historical Air Quality Data Table 6-22 Summary of Project Air Quality Monitoring Table 6-23 Tailpipe Emission Factors For Vehicles Table 6-24 Ratio Between Emission Factors for Both Gasoline and Diesel Engines Table 7-1 Summary of Geometric Design Criteria for BRT Table 7-2 Summary of Geometric Design Criteria for LRT Table 8-1 Evaluation Objectives, Goals and Indicators Table 8-2 Evaluation of Alternatives- Segment B Table 8-3 Evaluation of Alternatives- Segment C Table 8-4 Evaluation of Alternatives- Segment D TO1793 Markham North South Link Corridor Public Transit Improvements Environmental Assessment 28/02/2006 5
15 LIST OF TABLES Table 10-1 Assessment of Environmental Effects for Objective A Social Environment Table 10-2 Assessment of Environmental Effects for Objective B - Natural Environment Table 10-3 Assessment of Environmental Effects for Objective C Smart Growth and Economic Development Table 10-4 Assessment of Environmental Effects for Objective D Transportation Service Table 12-1 First Nations Contacted TO1793 Markham North South Link Corridor Public Transit Improvements Environmental Assessment 28/02/2006 6
16 1. INTRODUCTION Purpose of the Markham North South Link Corridor Public Transit Improvements Report On July 13, 2004, the Regional Municipality of York, the proponent of the York Rapid Transit Plan, obtained formal approval of the Terms of Reference for an Environmental Assessment (EA) of Markham North South Link Corridor Public Transit Improvements. This EA Report was prepared in accordance with the Terms of Reference and with clause 6.1 (2) of the Ontario Environmental Assessment Act (EAA). The EA studies were carried out in 2004 and early 2005, drawing on results of previous investigations conducted during the preparation of the Terms of Reference as appropriate. The purpose of this report is to document the scope and findings of the EA studies assessing the effects of both the operation of improved transit services as well as the construction of related facilities. The report and its appendices, including the approved Terms of Reference, constitutes York Region s application to the Ontario Ministry of the Environment for approval to proceed with the undertaking, submitted under subsection 6.2 (1) of the EA Act. 1.2 PURPOSE OF THE PROJECT A review of recent planning initiatives and studies carried out in the Region is beneficial in describing the context for and purpose of, the proposed undertaking: Markham North South Link Corridor Public Transit Improvements Context York Region s Official Plan outlines a regional structure based on the establishment of a system of centres and corridors that act as a focus for residential and commercial development. The Plan identifies four regional centres and two main regional corridors. The four existing and/or developing centres, intended to be focal points for business, government and culture with complementary medium and high density mixed-use development, are: The Langstaff Community Area in southern Richmond Hill surrounding the Yonge Street/Highway 7 intersection; Newmarket, at the top of the primary north-south corridor on Yonge Street and home to the Regional Headquarters; Markham Centre to the east in the vicinity of Highway 7 and Warden Avenue; and Vaughan Corporate Centre to the west in the vicinity of Highway 7 and Highway 400. Much of the Region s public transportation system centres on the two primary corridors identified in the Plan. These are the north-south leg on Yonge Street and Highway 7, the major east-west leg. However, given the Region s important link with the City of Toronto, two north-south connecting corridors are an integral part of the overall transit plan: A Vaughan North- South Link and the Markham North-South Link. Figure 1-1 Planned Rapid Transit Network As a major step towards achieving the Official Plan s three goals of sustainable natural environment, economic vitality and healthy communities, the Region developed its Transportation Master Plan (TMP), completed in June This Transportation Master Plan articulated the goals in a set of twelve, desirable end states for the transportation system: Reduced vehicular trips and shorter work trips; Employer based Travel Demand Management initiatives; Reduced dependence on automobiles; Universal access to public transit; Markham North- South Link Corridor Integrated transit services and fares among GTA transit operators serving York Region; Transit accessible human services; Efficient and safe movement of goods; Efficient use of infrastructure; Infrastructure in a state of good repair ; Strong protection for the environment; Adequate and dedicated long-term funding sources; and Effective public consultation. The Transportation Master Plan (Attached as Appendix L) established a comprehensive blueprint for road and transit developments in the Region through 2031 and outlined the proposed four corridor, rapid transit network, shown in Figure 1-1. The principal objective of this network, known as the York Rapid Transit Plan is to provide a high quality rapid transit alternative for travel between the four regional centres as well as rapid transit links from the Region s network to the City of Toronto s subway network and to neighbouring municipalities east and west Problem Statement for Markham North South Link Corridor The general problems highlighted in the York Region Transportation Mater Plan (TMP) and confirmed through the analyses in this EA that are of particular relevance to the Markham North South Link Corridor can be summarized as follows: Road capacity constraints, which lead to increased travel times, congestion and air pollution; Low transit accessibility, both in terms of service levels and service coverage connecting major destinations, which in turn leads to low transit mode shares and a high reliance on automobiles; Limits on urban development, due to the fact that the road system alone cannot support the levels of development anticipated in the Region, particularly key centres such as Markham Centre; Sustainability issues, which stem from a high dependence on automobiles, including air pollution, greenhouse gas emissions, and inability to respond to changes such as fuel supply limitations/price increases, which are anticipated over the next 30 years; Lack of accessibility, for those individuals who cannot afford to drive a car, or do not have access to a car (e.g. students, elderly persons); Improving public transit in the corridor has the potential to address these problems. 1 TO1793 Markham North South Link Corridor Public Transit Improvements Environmental Assessment 28/02/

17 Objectives The purpose of the undertaking in the Markham N-S Link Corridor encompasses two fundamental objectives: to respond to growth pressures by providing a high quality improved public transit alternative to reduce automobile dependence, and to help make the Region s urban centres more liveable, pedestrianoriented and economically viable by providing a valuable tool for structuring and achieving land use and social objectives. Following adoption of the Master Plan by Regional Council, the Region initiated the planning and project development phase of the Rapid Transit plan by entering into a public-private partnership with York Consortium The scope of this first phase included network-wide transportation planning in parallel with, and in support of, Environmental Assessments of rapid transit in each of the four corridors. A key activity has been travel demand analyses, using the results of the 2001 GTA-wide Transportation Tomorrow Survey and the current demographic projections of York Region and Toronto. This demand analysis and forecasting within the study, described in Chapter 4 of this EA, has shown that there will be capacity shortfalls in the road network as new development occurs and more importantly, that the existing transit network does not adequately serve the key corridor demand and does not provide high quality linkages between major transit systems. One of the challenges with the Markham North South Link Corridor is that there is presently no single dominant corridor and as a result travel demand patterns are diverse. Compounding this is the fact that land uses throughout the study are diverse including greenfields, low density industrial, office and stable residential development. This is both a challenge as well as an opportunity in that the Region and Town of Markham have an opportunity to shape land use and encourage more compact, mixed use and transit supportive development. design approach to support the Region s goals for mixed-use transitoriented development along the corridor. The undertaking, for which Ministry approval is sought, comprises the infrastructure, systems, vehicles and subsequent operation of the improved public transit services. 1.3 RELATIONSHIP WITH OTHER CORRIDORS The basic concept for the Markham North-South Link Corridor Public Transit Improvements, as identified in the York Region Transportation Master Plan, is to connect the Markham Centre (Warden and Highway 7 area) with the Sheppard Subway. Connections with the Sheppard Subway could be made to the existing terminus at Don Mills Station or, if the Subway is extended, to a future easterly station. The Markham Link Corridor would be seamlessly integrated with the proposed Highway 7 Transitway, which extends through Markham Centre in the north end of the study area. The corridor includes GO Transit Stouffville Line, which includes a major station in the study area Unionville Station. In addition, the north-south corridor intersects the Highway 407 interregional bus rapid transit corridor, currently protected by the Ontario Ministry of Transportation and studied recently by GO Transit as part of the GO BRT Study. As a critical corridor on York Region s proposed rapid transit network and a major link between Markham and the Sheppard Subway, improved public transit services in one or more north south corridors fulfils several roles relating to the other corridors in the Region s network as well as those of other transit operators interfacing with it. These roles can be summarized as follows: a) Providing the high quality transit link between the Markham Centre and the Sheppard Subway in the City of Toronto. e) Providing connections to future transit services planned by the City of Toronto, including a potential bus rapid transit or LRT service on Don Mills Road, a priority transit service on Victoria Park Avenue and the planned extension of the Sheppard Subway. The relationship of the Markham North South Link corridor to the other inter-connected corridors mentioned above is illustrated in Figure 1-2. Figure 1-2 Relationship of Markham N-S Link Corridor to other Interconnected Corridors The purpose of the undertaking can therefore be summarized as: Providing improved public transit infrastructure and service in this northsouth corridor, capable of producing significant increases in transit ridership both within the corridor and across the network and regional boundary. This objective will be supported by interconnection with other corridors and GTA transit systems such as the Highway 407 transitway, GO Transit and the TTC Sheppard Subway. b) Providing a connection from the east-west rapid transit service on Highway 7 to the many employment uses south of Highway 7 in the Town of Markham and south of Steeles Avenue in the City of Toronto. c) Providing residents and employees in Markham with access to the City of Toronto s subway network, with the benefit of increasing ridership on TTC s services and also diverting auto trips from Toronto s road network, Integrating improved transit facilities in a manner that enhances and enriches streetscapes with new amenities by using a holistic urban d) Providing improved transit service to GO Transit s rail and bus network, and in particular the Unionville GO Station, so that more people are encouraged to use transit for their entire trip as opposed to driving and parking at GO stations. TO1793 Markham North South Link Corridor Public Transit Improvements Environmental Assessment 28/02/
18 1.4 RELATIONSHIP WITH CITY OF TORONTO The Markham North-South Link Corridor is somewhat unique in the overall York Region Rapid Transit Network in that approximately one-half of the potential improved transit services would be located in the City of Toronto. The City of Toronto Official Plan identifies the introduction of higher-order transit in the Don Mills Road and Markham Road corridors. It also identifies Don Mills Road, Victoria Park Avenue, McCowan Road and Markham Road for improved surface transit priority measures, such as reserved/dedicated lanes for buses and transit signal priority. Recommendations for the Markham N-S Link corridor were developed to take into account recommendations from the Don Valley Corridor Transportation Master Plan being conducted by the City of Toronto. The purpose of this study is to recommend specific road and transit-related improvements for increasing person-carrying capacity in the Don Valley corridor within the City of Toronto. The Draft Final Report for this study, released in February 2005, recommends as a high priority the establishment of a Don Mills Higher Order Transit service to Bloor-Danforth subway. It also recommends surface transit priority measures for Victoria Park Avenue. Although the City of Toronto has chosen not to be a co-proponent, the City of Toronto and Toronto Transit Commission are key stakeholders in the Markham-North South Link Corridor EA. Staff from both agencies are represented on the study s Technical Advisory Committee to provide advice and comments on the study and to coordinate input from other City of Toronto stakeholders. As described previously, the EA study area extends to Sheppard Avenue in the City of Toronto. Since the City of Toronto is not a proponent in the EA, this study will not define specific infrastructure to address needs within the higher-order transit and transit priority corridors as envisioned in the Toronto Official Plan. A future study (or studies) will be required by the City of Toronto to define transit service and infrastructure south of Steeles Avenue to address needs within the City of Toronto. Since York Region does not have the jurisdictional authority to construct any physical infrastructure within the City of Toronto without an agreement with Toronto, an important aspect in the development of alternatives within this EA is to consider how potential services and infrastructure north of Steeles Avenue could be integrated with the long term transit planning objectives of the City of Toronto. In discussions with the Toronto staff, it was determined that any transit service crossing into Toronto would have to respect the jurisdictional boundary of the TTC. In general, any York Region service crossing into Toronto could drop-off passengers en route to the proposed terminus of the service at the Sheppard Subway. In the northbound direction, any York Region Transit service could only pick-up riders destined for York Region. With these limitations in mind, this EA will only go as far as identifying the transit service characteristics and any limited infrastructure south of Steeles Avenue required to directly support the York Region undertaking that is being defined in this EA. 1.5 STUDY PROCESS The Markham North South Link Corridor Public Transit Improvements study followed an Individual Environmental Assessment process in accordance with the requirements of the Ontario Environmental Assessment Act (Part II). The four phases followed as part of this process are illustrated in Figure 1-3. The first two phases have utilized findings of transportation studies completed prior to the commencement of this EA. These have been supplemented by further updating and analysis focussing on defining the problem, identifying the need, and analysing alternative transportation solutions to the problem and their ability to meet the need of the Region s land use and transportation objectives. The third and fourth phases were carried out during this assessment. Within these phases the following key tasks were completed: Detailed and focused investigation of existing conditions; Development of alternative functional designs; Assessment of environmental effects of the alternative functional designs; A comparative evaluation of the functional design alternatives; Selection of Preferred Functional Design; Detailed description of the project including phasing and built-in mitigation; Detailed assessment of the environmental effects of the preferred design; Identification of land needed for the implementation of the Preferred Functional Design; Recommendations for actions to prevent, change, mitigate, or remedy effects, including monitoring provisions; Conclusions of the effects of the project on the human and natural environment; and Documentation of the Study in an EA Report. The outcome of these tasks included: Opportunities to minimize identified potential adverse effects through the implementation of effective mitigation measures; Opportunities to restore, enhance, or improve overall environment quality of the study area including the preparation of a streetscape plan; Definition of the preferred public transit improvements including physical running-ways and passenger pick-up/drop-off facilities; Right-of-way (ROW) protection requirements for the preferred design, to allow for orderly development or redevelopment of lands in proximity of the transit facilities; and An implementation process for the construction of the Markham North South Link transit improvements based on development pressures and ridership requirements. 1.6 REPORT ORGANIZATION This report is divided in thirteen Chapters. The purpose of the study and the vision of transit within York Region are provided in Chapter 1 including the planning and approval process. Chapter 2 provides the background to the study and describes the study area identified in the Terms of Reference. Chapter 3 identifies the Alternative Solutions to the need addressed by the undertaking and describes the findings of a comparative evaluation of these solutions. Chapter 4 sets out the findings of the travel demand analysis carried out. In Chapter 5, the alternative methods of carrying out the preferred transportation solution are presented and evaluated. This chapter includes a description of the route alternatives and the factors influencing their development as well as the evaluation methodology, criteria used for the evaluation and the preliminary screening of route alternatives. A description of existing conditions within the study area that could be affected by the undertaking is presented in Chapter 6. Chapter 7 describes fundamental planning and design parameters that were used in developing alignments and alternatives. Chapter 8 evaluates different design alternatives through each section of the preferred route and identifies the preferred features of an improved transit system. A more detailed description of the preferred design solution including project development activities that might affect the environment is presented in Chapter 9. Results of the assessment of the environmental effects, recommended mitigation measures and proposed monitoring are summarized in Chapter 10. Chapter 11 outlines the Implementation Plan. Public and agency consultation formed an integral part of all phases of this study and is summarized in Chapter TO1793 Markham North South Link Corridor Public Transit Improvements Environmental Assessment 28/02/
19 1 Figure 1-3 Environmental Assessment Process PHASE 1 PHASE 2 PHASE 3 PHASE 4 PHASE 5 Terms of Reference Need Identification Selection of Preferred Solution Selection of Preferred Design Submission of EA Report Design, Construction, operation and Monitoring Prepare Terms of Reference Identify Alternative Solutions Identify Alternative Design Concepts Document Findings in Report Federal Land Use Approval Public Notice of Terms of Reference Submit Terms of Reference to Ministry 30 Day Review Period Ministry Approval Document Project Need Identify and Pre-Screen Possible Solutions Inventory of Existing Conditions Scoping and Identification of Issues Identify Impacts and Mitigations Evaluate Alternatives Select Preferred Solution(s) Update Inventory of Existing Conditions Confirmation of Issues Identify Impacts and Mitigations Evaluate Alternatives Design Concepts Submission and Notification of Study Completion Public/Agency Review EA Review Final Public Comment Finalize EA Decision Federal Design Approval Design Contract Drawings Construction Operation Monitoring Review EA Requirements Select Preferred Design TO1793 Markham North South Link Corridor Public Transit Improvements Environmental Assessment 28/02/

20 2. STUDY BACKGROUND This chapter describes the study area and a broad overview of existing conditions in the study area. 2.1 DEFINITION OF STUDY AREA Figure 2-1 Study Area for the Markham North-South Link Corridor Public Transit Improvements 2 The basic concept for the Markham North-South Link Corridor Public Transit Improvements, as identified in the York Region Transportation Master Plan, is to connect the Markham Centre (Warden and Highway 7 area) with the Sheppard Subway. Connections with the Sheppard Subway could be made to the existing terminus at Don Mills Station or, if the Subway is extended, to a future easterly station. Reflecting the range of possible alignment options for the undertaking, as described in the Terms of Reference, an initial study area was defined to cover the area bounded by Leslie Street/Don Mills Road to the west, McCowan Road to the east, 16 th Avenue to the north and Sheppard Avenue to the south. This study area, including its context with the Greater Toronto Area, is shown on Figure 2.1. The study area includes portions of the Town of Markham and the City of Toronto, as well as a small portion of Richmond Hill in the Beaver Creek Business Park area. The study area shown represents the initial study area which was refined during the EA, as various routing options were assessed and screened. The spatial and temporal boundaries of the EA study area varied to some extent depending on the environmental factor under consideration. Throughout this EA report, analyses are sometimes described separately for the Markham portion of the study area (i.e. north of Steeles Avenue) and the Toronto portion of the study area (i.e. south of Steeles Avenue). In addition, due to the fact that no construction activities will be undertaken by York Region in Toronto, analyses are typically more detailed for the Markham portion of the study area. TO-1793 Markham North South Link Corridor Public Transit Improvements Environmental Assessment 28/02/

21 2 2.2 OVERVIEW OF EXISTING CONDITIONS IN STUDY AREA The Built Environment The initial study area for the Markham North-South Link corridor is quite large and contains a wide variety of land uses and development patterns as shown on Figure 2-2. While the majority of the study area below 14 th Avenue is generally built-out, much of the northern portion of the study area is under-development or planned for development and presents a significant opportunity to be developed in a manner that supports the vision for transit in the region while also supporting the vision for environmental quality and sustainability. This section highlights the following five main elements of the existing built environment. Residential Areas - Approximately two-thirds of the land area within the initial study area contains low-medium density residential development, plus a few pockets of higher density residential development (apartments and condominiums), most notably along Sheppard Avenue, Finch Avenue and Steeles Avenue. Most of the residential neighbourhoods are typical of newer suburban areas with houses focusing on local streets that are discontinuous and circuitous. Where residential developments abut arterial roadways, the houses are either facing inwards and accessed by collector and local streets or set back significantly from the street. Existing and Newly Developing Employment Areas - The study area contains both newly developing business parks as well as older industrial areas. Much of the area between Highway 404 and Kennedy, north of Steeles Avenue, consists of light manufacturing and industrial uses. Together, these industrial areas generate a significant amount of employment. The study area also contains a high number of employment nodes with high-density office development. These include: The Allstate Parkway Business Park Gordon Baker Business Park Steeles Technology Campus Consumers Road Business Park Commerce Valley Drive Business Park These business parks are the home of several major employers including IBM, Sprint Canada, American Express, Data Mirror and ATI to name a few. Figure 2-2 Study Area Land Use TO-1793 Markham North South Link Corridor Public Transit Improvements Environmental Assessment 28/02/
22 Regional Centres - Within York Region, there are four major regional centres: Markham Centre, Langstaff Gateway (Richmond Hill), Vaughan Corporate Centre and Newmarket. It is the intention that the Markham Centre would be the northern focal point of the Markham North-South link. It is envisioned that Markham Centre will be the new downtown for Markham. It will consist of high density residential and employment uses which will be developed in a manner that is supportive of transit. In addition to the formally defined regional centres, the corridor contains a number other major activity nodes including: Don Mills Station/Fairview Mall, the present terminus of the Sheppard Subway and a major shopping destination; Markville Mall; The Markham Civic Centre; Pacific Mall; Bridlewood Mall; Seneca College (Newnham); and, Seneca College Allstate (opened 2005) Development Corridors - The Official Plan for the Region of York calls for a series of development corridors that are intended to help facilitate the intensification of development and services in a mixed use form that creates support for efficient, regular transit service. The two main corridors in the initial study area are Highway 7 and a north-south corridor between Markham Centre and the Sheppard Subway. Scarborough. Through the study area, this rail corridor is quite narrow at approximately 15 m in width. Highway 407 corridor: Highway 407 was constructed in the parkway belt and follows and east-west alignment through the study area. The corridor includes the 6 lane toll highway as well as a utility corridor. Highway 407 is a private toll highway operated by 407 ETR Concession Company Limited under a Concession Ground Lease Agreement with the Crown in the Right of Ontario. 407 ETR has been deemed the Road Authority for the Highway 407 right-of-way and is responsible for all construction, maintenance and operations associated with Highway 407. GO Transit is planning for a bus rapid transit facility in the 407 corridor. To accommodate the transitway and associated facilities, MTO undertook a Transitway Corridor Protection Study in 1998 Finch hydro corridor: The Finch hydro corridor presents opportunities for potential east-west connections. Through the study area, the Finch hydro corridor follows an alignment just south of McNicoll Avenue. The Finch hydro corridor has been identified in the City of Toronto Official Plan as a Higher Order Transit corridor. Sheppard Subway: Opened in November 2002, the new Sheppard Subway runs from Yonge Street to Don Mills Station. The Official Plan for Toronto identifies the Sheppard Subway corridor east of Don Mills Road as a Higher Order Transit Facility and all expectations are that the subway will eventually be extended to the Scarborough Civic Centre in the longer term. Highway 404 corridor: Through the study area Highway 404 is a major provincial highway facility. Highway 404 is identified as an integral part of GO Transit s longer term BRT network. Major Natural Heritage Features for the entire study area is plotted on an air photo base map and shown on Figure 2-3 and described below. Abiotic - The study area is located primarily in the South Slope and Peel Plain physiographic regions. The South Slope is a till plain that was formed by retreating glaciers. The slope in the study area is smooth to gently rolling with low drumlins. The soils of the South Slope are relatively impermeable which results in extensive run-off to local watercourses. The Peel Plain is a level to undulating tract of clay soils. The dominant soil is Peel Clay which is fine and poorly drained. As a result, infiltration is low and groundwater supply is limited as more precipitation ponds on the surface or is lost through evaporation or surface runoff. The underlying geological material of the Peel Plain is a till or boulder clay which contains large amounts of Palaeozoic shale and limestone. The general elevation of the Peel Plain is from 500 to 750 feet above sea level and there is a gradual and fairly uniform slope towards Lake Ontario. The study area lies within the Don River, Rouge River and Highland Creek watersheds, although the majority of the study area lies within the Rouge River and Highland Creek watersheds. Located within the study area is German Mills Creek (a tributary of the East Don River); the Rouge River and a number of associated tributaries including Beaver Creek; and, the Bendale Branch and Markham Branch of the Highland Creek. These watercourses flow generally in a north to south direction from their headwaters in the Oak Ridges Moraine and South Slope to their mouths at Lake Ontario. All watercourses fall within the jurisdiction of the TRCA and MNR Aurora District. 2 In addition to these major regional corridors, the study area contains several important corridors that have been or are planned to be developed with higher density, mixed use development. These include Enterprise Drive through Markham Centre and the Sheppard Subway Corridor. The Sheppard Subway corridor is identified as an Avenue in the Toronto Official Plan. Avenues are corridors along major arterial streets where transit-supportive reurbanization can create new employment and housing and improve local streetscape, infrastructure and amenities. Transportation/Utility Corridors - There are several major transportation corridors and utility corridors in the study area, as described below. (See Figure 2-2) North-South Hydro Corridor: A key feature of the study area is a north-south hydro corridor extending from the Finch hydro corridor just south of McNicoll Avenue to north of Highway 7. Stouffville GO line: GO Transit operates the Stoufville GO Rail service on the Uxbridge subdivision, which extends northerly from Institutional Uses - There are a number of elementary and secondary schools within the study area, as shown on Figure 2-2. Secondary schools in particular represent a potential market for public transit, as does Seneca College located at Don Mills Avenue and Finch Avenue A more detailed description of the built environment is provided for the refined study corridor in Chapter DESCRIPTION OF THE NATURAL ENVIRONMENT The initial inventory of the existing natural environment was conducted by LGL Limited and was based on a review of information available from the Ministry of Natural Resources (MNR), the Toronto and Region Conservation Authority (TRCA), the Regional Municipality of York, the Town of Markham, the Town of Richmond Hill and the City of Toronto. Field investigations were subsequently undertaken for a short-list of corridors and the results are presented in Chapter 6 of this EA. Aquatic Ecology - Watercourses located within the study area that directly support fish habitats are identified as cold, cool and warm water. Several of the watercourses have been urbanized through channelization, realignment and enclosure. The Rouge River and several of its tributaries within the study area support redside dace, a fish species of special concern nationally. Terrestrial Ecology - Designated natural areas within the study area include one evaluated wetland, Unionville Marsh, which has been designated a provincially significant wetland by the Ministry of Natural Resources, and one environmentally significant area (ESA), Unionville Marsh, which has been designated an ESA by the TRCA. Unionville Marsh is also designated a Life Science Site by the MNR. One other ESA, Milne Woods, is located immediately adjacent to but just outside the study area (east of McCowan Road between Highway 407 and Highway 7). Many of the valley and stream corridors surrounding the watercourses within the study area are designated natural heritage features by York Region, the Town of Markham, the Town of Richmond Hill and the City of Toronto. TO-1793 Markham North South Link Corridor Public Transit Improvements Environmental Assessment 28/02/

23 2 Figure 2-3 Natural Heritage Features A full description and inventory of the natural environment for the refined corridor is provided in Chapter TRANSPORTATION ENVIRONMENT Local Transit Network Figure 2-4 illustrates the existing transit services in the study area. York Region Transit (YRT) is responsible for operating transit throughout York Region (i.e. north of Steeles Avenue) while TTC responsible for operating services in the City of Toronto (i.e. south of Steeles Avenue). In addition, TTC operates several routes on major north-south arterials north of Steeles Avenue. These services are operated by TTC under contact to York Region. Major north-south transit services within the study area include the following: Route 129A on McCowan Road Route 17A on Birchmount Road Route 68B on Warden Avenue Routes 224C and 24d/224D on Victoria Park Avenue/Woodbine Route 25D on Don Mills Road Route 8 on Kennedy Route 90 on Don Mills/Highway 404 In addition to these north-south routes, YRT also operates two east-west routes through the York Region portion of the study area, Route 1 and Route 2/2A. In the southern portion of the study area, the TTC operates routes on Steeles Avenue (Route 53), McNicoll Avenue (Route 42), Finch Avenue (Route 39) and Sheppard Avenue (Route 85). Characteristics of the major transit routes operating within the study area are shown on Table 2-1. In general, the frequency and duration of operation of bus services is significantly greater south of Steeles Avenue. North of Steeles Avenue headways range from minutes, whereas south of Steeles Avenue headways are generally better than 10 minutes Fare Policies Each of the TTC routes operating north of Steeles Avenue are not subject to integrated fare policy meaning that when passengers travel across the City of Toronto boundary at Steeles Avenue they are required to pay an additional fare when boarding TTC services. For example, passengers travelling on YRT route 90 to Don Mills Station would pay an extra fare to board the subway. Similarly, passengers travelling north on the TTC routes have to pay an extra fare if they travel north of the Steeles Boundary. As of January 1, 2005, the adult cash fares for YRT was $2.25 while the 10 ticket price works out to $2.10 and a monthly pass can be purchased for $ Adult cash and ticket prices are the same for TTC, while monthly TTC passes are $ For the TTC and YRT routes that connect to GO Train stations in York Region, passengers pay only an additional 25 cents when they show a valid GO Transit Ticket. It is noted that both TTC and YRT fares are planned to increase in VIVA Transit Network In September 2005, York Region launched the VIVA transit system, a network of special buses running in transit priority corridors, generally in existing travel lanes. Originally referred to as the Quick Start Network, these services will run in all four of the York Region Rapid Transit Corridors shown previously on Figure 1-1. For the remainder of this report, VIVA Phase 1 will be used to describe the current and soon to be implemented bus rapid transit services. Similarly, the term VIVA Corridors is used to describe the York Rapid Transit Network Corridors comprising the Yonge Street corridor, Highway 7 corridor and the Markham and Vaughan North- South Links. Currently, both VIVA Purple and VIVA Green operate in the within study area GO Bus Services In addition to the GO Rail services and associated train-bus services, there are three GO Bus services operating in the study area. The Highway 407 GO Bus Service operates between Mount Joy GO Station to/from Oakville with stops at Unionville station and York University. Service runs heading to Oakville from 6:35 to 17:55 approximately once per hour or better in the AM peak. Buses depart from Oakville approximately once per hour from 7:00 to 22:00, with later buses from York University. In addition, Route #50 runs between Unionville GO Station and Scarborough Town Centre; and TO-1793 Markham North South Link Corridor Public Transit Improvements Environmental Assessment 28/02/
 that travel through the study area (on Highway 404) but do not stop.")
24 Route #52 serves York University, Durham College and Oshawa via Highway 407, stopping at Unionville Station. In addition there are several routes (#49,65 and 69) that travel through the study area (on Highway 404) but do not stop. Figure 2-4 Existing Transit Services In the morning peak period trains depart from Unionville Station approximately every 30 minutes. These train services are supplemented by GO bus services operating at hourly intervals throughout the mid-day and during the late evening. 2 Table 2-1 Existing Transit Routes Routes Operating North of Steeles Avenue* ROAD Don Mills Road/ Leslie Street Victoria Park Warden Ave Birchmount Rd Kennedy Road McCowan Road Highway 7 ROUTE (Operator) 25D (TTC) 90 (YRT) 224C (TTC) 24D/224D (TTC) 68B (TTC) 17A (TTC) 8 (YRT) 129A (YRT) 1 (YRT) DESCRIPTION Pape Stn 16 th Ave Don Mills Stn Seneca College King Campus Don Mills Stn 14 th Ave Don Mills Stn Major Mackenzie Warden Stn 16 th Ave Warden Stn 14 th Ave Steeles Ave Major Mackenzie Scarborough Centre Major Mackenzie Markham Stouffville Hospital Finch Stn AM PEAK Routes Operating South of Steeles Avenue* ROAD Don Mills Victoria Park Road Warden Avenue Birchmount Road Kennedy Road McCowan Road ROUTE (Operator) 25 (TTC) 24 (TTC) 68 (TTC) 17 (TTC) 43 (TTC) 129 (TTC) DESCRIPTION Pape Stn Steeles Ave Vic Park Stn Steeles Ave Warden Stn Steeles Ave Warden Stn Steeles Ave Kennedy Stn Steeles Ave Scarborough Centre Steeles Ave HEADWAY Mid-day PM PEAK Eve AM PEAK No service No service No service No service HEADWAY Mid-day PM Eve PEAK Source: Toronto Transit Commission, York Region Transit * Not all routes in corridor are shown; schedules and routes change frequently GO Rail GO Transit s Stouffville GO Rail service generally follows a north-south alignment through the study area. Peak period service is provided between Stouffville and Union Station with stops at the following locations: Kennedy (opened June 2005) Agincourt (Sheppard Avenue)* Milliken (Steeles Avenue)* Unionville GO Station (Kennedy/Helen)* Centennial GO Station (McCowan Road)* Markham Village GO Station (Highway 48) Mount Joy GO Station (Hwy 48/Bur Oak) Stouffville GO Station (Stouffville) * Indicates station within study area Fares for GO Transit range depending on the origin and destination. Current fares for a one-way trip from Unionville station to Union station are $5.15 for an adult and $2.60 for a senior or child. GO Transit also operates the Richmond Hill GO Rail Service to the west of the study area with stops at Richmond Hill (Major Mackenzie Drive), Langstaff (Highway 7), Old Cummer (near Finch Avenue) and Oriole (near Sheppard/Highway 401) Provincial Highway Network Figure 2-5 provides an illustration of the major road network characteristics. There are two major provincial highways in the study area as follows: Highway 407 Highway 404 Highway 407 is a 108 kilometre east-west controlled access private toll highway currently operated by 407 ETR Concession Company Limited under a Concession Ground Lease Agreement with the Crown in the Right of Ontario. Within the study area, Highway 407 serves as an alternative route to Highway 401 as well as Highway 7 with full interchanges at Markham Road, McCowan Road, Kennedy Road, Warden Avenue, Woodbine Avenue, Highway 404 and a partial interchange at Leslie Street. Highway 407 consists of 6 lanes easterly to McCowan Road where it narrows to 4 lanes. In general, Highway 407 operates free of congestion in this area. Highway 404 is a major north-south controlled access provincial freeway under the jurisdiction of the Ministry of Transportation. Highway 404 continues north from Don Valley Parkway at Highway 401 north to Green Lane with full interchanges within the study area at Sheppard Avenue, Finch Avenue, Steeles Avenue, Highway 407 and Highway 7. Highway 404 consists of 5 lanes per direction to Finch Avenue, narrowing to 4 lanes per direction to Highway 7 and then to three lanes. TO-1793 Markham North South Link Corridor Public Transit Improvements Environmental Assessment 28/02/

25 2 The Ministry of Transportation is also completing construction of a new Highway 404 southbound lane from Van Horne Avenue to westbound Highway 401, which will be reserved for HOVs and buses. Figure 2-5 Study Area Road Network Steeles Avenue East jurisdiction of the City of Toronto. Finch Avenue provides a significant link between the residential areas east of Highway 404 and Highway 404 itself as well as to North York Centre. Steeles Avenue is a major urban arterial road operating under the jurisdiction of the City of Toronto. It delineates the boundary between York Region and the City of Toronto. Its width varies from 4 lanes to 6 lanes within the study area. Birchmount Road Birchmount Road runs north south from 14 th Avenue in the north and to the south past Highway 401. It consists of 4 lanes however the classification varies from a major collector road from 14 th Avenue to Denison Street to a minor arterial to Finch Avenue and an arterial road south of Finch Avenue Municipal Road Network The major arterial roads within the study area are discussed below: Sheppard Avenue East Finch Avenue East Sheppard Avenue East is a major east-west urban arterial road that runs parallel and directly north of Highway 401. Under the jurisdiction of the City of Toronto, Sheppard Avenue consists of 4 lanes and widens to 6 lanes as it approaches Highway 404. Finch Avenue is a 4-lane urban arterial under the Highway 7 Don Mills Road/Leslie Street Victoria Park Avenue Woodbine Avenue Highway 7 is a major east-west undivided arterial road under the jurisdiction of the Regional Municipality of York connecting Markham to the Highway 404 corridor as well as to Richmond Hill and Vaughan. Through the study area Highway 7 varies from 4-6 lanes. Don Mills Road operates under the jurisdiction of the City of Toronto to Steeles Avenue where it continues north as a Region of York facility. Don Mills Road changes to Leslie Street at John Street. Don Mills Road is a 6-lane arterial to south of Finch Avenue with the curb lane being designated as an HOV lane in the peak period. North of Finch Avenue, Don Mills Road and Leslie Street are four lanes. Victoria Park Avenue is a City of Toronto Road running north-south directly east of Highway 404 and south of Steeles Avenue. Victoria Park Avenue is 6 lanes south of Finch Avenue and 4 lanes north of Finch Avenue. Woodbine Avenue connects to Highway 404 at Steeles Avenue and is located directly east of Highway 404. It is a 6-lane major arterial road under the jurisdiction of the Regional Municipality of York. Warden Avenue South of Steeles Avenue, Warden Avenue is a 4- lane arterial road with centre turning lanes. A similar cross-section exists north of Steeles Avenue, although construction has commenced on the widening of this facility to 6 lanes north of MacNabb Street/MacPherson Ave Kennedy Road McCowan Road Kennedy Road is a major north-south arterial. South of Sheppard Avenue, Kennedy Road consists of 6 lanes and decreases to 4 lanes north of Sheppard Avenue. The cross-section of McCowan Road is 4 lanes within the study area and widens to 6 lanes south of Sheppard Avenue. 2.5 EXISTING AND HISTORICAL POPULATION AND EMPLOYMENT For the purpose of the remaining discussion in this chapter, the study area is separated into the Markham Study Area (section of the study area north of Steeles Avenue) and the Toronto study area (representing the portion of the study area south of Steeles Avenue in the City of Toronto). This distinction is made due to the often distinctly different land use and travel patterns of these two areas. Population and employment levels in the study area have been growing at a higher pace than the GTA average; most of this growth has occurred in the York Region (Markham) portion of the study area. Population and employment levels since 1986 for the study area, Markham, and GTA regions are tabulated in Table 2-2. In the Markham study area, population and employment levels have grown considerably 31% and 37% since 1991, respectively although this is not as high as the Markham or York Region averages over the same period. In the Toronto portion of the study area, population has been growing much less rapidly, with only a 5% total population growth from 1991 to 2001, but an 18% employment growth over the same period. In 2001, the Markham study area was home to some 80,000 residents (37% of Markham population) and 97,000 jobs (82% of Markham employment). Most of the population in the Markham study area is located north of Highway 7 and south 16 th Avenue. The Toronto study area had 161,000 residents and TO-1793 Markham North South Link Corridor Public Transit Improvements Environmental Assessment 28/02/
 for the same areas. The Markham portion of the study area has very high employment self-containment.")

26 53,000 jobs in Therefore, the study area had roughly two-thirds of its total employment but only one-third of its total population in York Region. Table 2-2 also shows employment self-containment levels (i.e. the ratio of jobs to population) for the same areas. The Markham portion of the study area has very high employment self-containment. At 1.21 jobs per resident in 2001, it must draw from the labour force beyond its boundaries to fill its demand for employment. It is interesting to note that the Markham study area is home to 8 of Markham s top 10 employers in terms of number of employees. The Toronto study area has a much lower self-containment level at 0.33 jobs per resident in 2001 reflecting the primarily residential character of this area. Many of its residents therefore have to travel outside of the Toronto portion of the study area for employment. Year 2001 population and employment are plotted in Figure 2-6 and 2-7 respectively. These show that large portions of the study area are primarily for employment uses. In the northwest, the area west of Woodbine Avenue and north of Highway 407, also between Highway 7 and Steeles Avenue east of Highway 404 as far as approximately Kennedy Road; in Toronto, between Highway 404 and Warden Avenue north of McNicoll Avenue, and the area bounded by Steeles Avenue, Kennedy Road, Finch Avenue and Midland Avenue. 2.6 SOCIO-DEMOGRAPHIC FACTORS AND TRENDS Auto Ownership Auto ownership levels for the study area and for comparative areas are tabulated in Table 2-3. At 1.54 vehicles per household, the study area enjoys a higher level of vehicle ownership than the Markham or GTA averages. However, the vehicle ownership characteristics are very distinct between the areas north and south of Steeles Avenue. In the Markham study area, households own an average of 1.96 vehicles, only 2% of households do not own vehicles, and 21% own three or more vehicles. This is a slightly higher level of ownership than the Markham average (1.91 vehicles per household). In the Toronto study area, households own an average of 1.36 vehicles, 14% do not own any vehicles, and only 8% own three or more vehicles. This is a significantly higher level of ownership than even the Toronto average (1.08 vehicles per household). This is reflective of the fact transit is a feasible travel choice, which is not always the case in the Markham portion of the study area. Table 2-2 Population and Employment Growth, 1986 to 2001 POPULATION Growth Growth % Growth % Growth AREA STUDY 187, , , ,000 54,000 27,000 29% 13% AREA Markham 41,000 61,000 71,000 80,000 39,000 19,000 95% 31% area Toronto area 146, , , ,000 15,000 8,000 10% 5% TOWN OF 112, , , , ,000 72,000 95% 49% MARKHAM GTA REGIONS 3,640,000 4,125,000 4,464,000 5,065,000 1,425, ,000 39% 23% York 345, , , , , , % 57% Toronto 2,135,000 2,214,000 2,306,000 2,451, , ,000 15% 11% Durham 318, , , , , ,000 58% 25% Peel 577, , , , , ,000 68% 36% Halton 265, , , , ,000 67,000 40% 22% EMPLOYMENT Growth % Growth 2001 Employment per AREA Resident STUDY N/A 116, , ,000 34,000 29% AREA Markham N/A 71,000 83,000 97,000 26,000 37% area Toronto N/A 45,000 45,000 53,000 8,000 18% area TOWN OF N/A 84,000 96, ,000 35,000 42% MARKHAM GTA N/A 2,138,000 2,213,000 2,662, ,000 25% REGIONS York N/A 224, , , ,000 72% Toronto N/A 1,299,000 1,257,000 1,454, ,000 12% Durham N/A 144, , ,000 23,000 16% Peel N/A 348, , , ,000 40% Halton N/A 123, , ,000 44,000 36% Data Source: Toronto Transportation Tomorrow Survey, adjusted to York Region and Toronto Official Plans Figure Population Figure Employment 2 TO-1793 Markham North South Link Corridor Public Transit Improvements Environmental Assessment 28/02/

27 2 Table 2-3 Auto Ownership Levels, 2001 Percentage of Households Vehicles/ No AREA Households Vehicles Household Vehicles Vehicle Vehicle Vehicles STUDY AREA 73, , % 39% 38% 12% Markham area 22,000 43, % 26% 51% 21% Toronto area 51,700 70, % 45% 33% 8% MARKHAM 61, , % 27% 51% 19% GTA REGIONS 1,821,300 2,559, % 40% 34% 10% York 232, , % 27% 51% 18% Toronto 962,900 1,044, % 47% 23% 5% Durham 177, , % 34% 47% 14% Peel 312, , % 36% 44% 14% Halton 136, , % 33% 49% 13% Source: 2001 Transportation Tomorrow Survey Average Household Income ($1000) $62.3 STUDY AREA $78.3 Markham Study Area $55.7 Toronto Study Area Figure Average Household Income $78.4 Markham $60.3 GTA $74.3 York $53.9 Toronto $62.4 Durham $65.4 Peel $73.9 Halton continuous connection between Highway 7 and 14 th Avenue. Construction on the first phase of the Rodick Road extension (over highway 407) started in 2004 and the second Phase is (over the CN tracks) is planned to start in The Birchmount Road extension will also be constructed in the near term. Figure 2-9 Future Transportation Improvements Income Levels Source: Derived from 2001 Census data, Statistics Canada Income levels are known to be a determinant of transit ridership, primarily because more affluent households tend to be able to afford more cars and are not as impacted by driving costs. Income levels for the study area are shown on Figure 2-8. As shown, the Markham portion of the study area enjoys high average household income levels, about 30% more greater than the average GTA household. Conversely, the Toronto portion of the study area is more consistent with the GTA average, but still slightly higher than the Toronto average. Given the high levels of auto ownership and high household income levels in the Markham portion of the study area, there are very few captive transit riders. Only fast, efficient, high-quality of transit services would attract residents of this area to use transit. 2.7 FUTURE TRANSPORTATION IMPROVEMENTS Road Networks A number of road network changes have been identified in the York Region 10-year capital plan and/or the York Region Transportation Master Plan (2001). These road capacity improvements influence the location, design and demand potential for public transit improvements. The anticipated changes within the study area are shown on Figure 2-9 and include the following key improvements: Warden Avenue from south of 14 th Avenue to Apple Creek road widened to 6 lanes (Scheduled for completion in 2005) Warden Avenue from Sixteenth Avenue to Major Mackenzie Drive widened to 4 lanes Kennedy Road from Highway 407 to Highway 7 widened to 6 lanes Kennedy Road from north of Steeles Avenue to Highway 407 widened to 6 lanes McCowan Road from north of Steeles Avenue to 16 th Avenue widened from 4 lanes to 6 lanes. Don Mills Road / Leslie Street from north of Steeles Avenue to Highway 407 widened to 6 lanes Highway 404 widening from Major Mackenzie Drive to Aurora Road from 4 to 6 lanes Transit Improvements (Markham TMP) (Markham TMP) Future travel demand forecasts include changes that will result from the York Region Transit 5-Year Service Plan: Conventional Transit. This includes various types of service updates, as follows: In order to facilitate planned future developments, Rodick Road and Birchmount Road will be extended across Highway 407 providing a TO-1793 Markham North South Link Corridor Public Transit Improvements Environmental Assessment 28/02/
28 Route extensions including Route 2A to Markham-Stouffville Hospital and TTC 129A McCowan to Major Mackenzie Rd; Transfer of YRT services to TTC services extensions: YRT Route 8 Kennedy, YRT Route 9 Markham Rd; Transfer of TTC services to YRT: New YRT Leslie route replaces TTC 25D Don Mills; New YRT Woodbine Route replaces TTC 24D/224D to Major Mackenzie; New YRT Warden Route replaces TTC 68B Warden. All routes to service the Don Mills Subway Stn; Reorientation of existing routes to serve York University, new Don Mills subway station, and new GO stations; Route 2A -14th Avenue to be extended to the Don Mills Subway Station; New Highway 7 regional service, providing continuous service from Woodbridge to Markham-Stouffville Hospital; this complements other Highway 7 services that serve subway stations. 2 In early 2006, a new YRT 5-year Service Plan will be completed and will act as a guide for transit improvements from Other transit improvements may also occur in the City of Toronto as a result of the recommendations of the New Official Plan (see Figure 1.2 shown previously). In the Official Plan, Don Mills Road, the Finch Hydro Corridor and the Sheppard East corridor are identified for higher-order transit facilities. It is understood that these higher order services would operate in exclusive rights of way. Transit priority segments include Victoria Park Avenue to Steeles Avenue, McCowan Road to Finch Avenue and Finch Avenue. This may include HOV lanes or other measures to expedite transit. As there is no committed timing for these transit improvements, they have not been included in the base travel demand analysis. As discussed previously, the City of Toronto has completed the Don Valley Corridor Transportation Master Plan study, which identifies and recommends specific road and transit-related improvements for increasing person-carrying capacity in the Don Valley corridor within the City of Toronto. One of the primary recommendations of this study is the introduction of Bus Rapid Transit Services (or potentially LRT) on Don Mills Road between Castle Frank Station on the Bloor-Danforth Subway north to Streeles Avenue. TO-1793 Markham North South Link Corridor Public Transit Improvements Environmental Assessment 28/02/
29 3. ANALYSIS AND EVALUATION OF ALTERNATIVES TO THE UNDERTAKING In accordance with the information requirements set out in Section 6.1 (2) of the Environmental Assessment Act, the approved Terms of Reference for this study required the Proponent to identify, analyze and evaluate all reasonable alternatives to the proposed undertaking, public transit improvements in the Markham North South Link Corridor. For this undertaking, the alternatives comprise functionally different transportation solutions to the problem summarized in the study context in Chapter 1 and addressed in York Region s Transportation Master Plan. This chapter presents the findings of this step in the EA process. 3.1 DESCRIPTION OF ALTERNATIVES TO THE UNDERTAKING The alternatives to the Undertaking that could be considered to respond to the Region s mobility needs and Official Plan objectives are outlined below. Components assumed in each alternative are shown in Table 3-1. In addition to the existing (2001) conditions, five alternatives have been examined. These have been built incrementally around different components of the York Region Transportation Master Plan and represent a broad range of approaches with different transportation modes. All of the strategies were developed and tested on a system wide basis. For example, a road improvements strategy would include road improvements throughout York Region, not just the study area Do Nothing The purpose of this alternative is to confirm the need and justification for an undertaking by assessing the effect of utilizing only the road and public transit infrastructure and services in place in 2001, without improvements throughout the planning period to For public transit, this assumption applies to all bus and rail transit service providers including GO Transit and the TTC A Current Commitments Strategy Including Priority Transit and Transportation Demand Management Commute Markham, Richmond Hill. In this strategy, the above commitments are assumed to be the full extent of transportation improvements through the planning period. This strategy includes approved or committed road improvements as follows: Road widenings on Leslie Street, Warden, Kennedy and McCowan; Birchmount Road and Rodick Road Extensions, plus Markham Centre internal roads; Changes to existing bus routes to reflect completion of Sheppard Subway to Don Mills; Service improvements identified in the York Region Transit 5 year service plan; Changes to the Stouffville GO Service, including a connection to the TTC subway at Kennedy Station. Alternative Transportation Strategy Road Network Do Nothing Existing (2001) road network Current Commitments Road Improvements Enhanced Interregional Transit Table 3-1 Summary of Alternative Transportation Strategies Planned improvements based on York Region 10 year capital plan and TMP network Expanded provincial highway system Expansion of road network and widenings to meet travel demand Planned improvements based on York Region 10 year capital plan and TMP network Expanded provincial highway system Planned improvements based on York Region 10 year capital plan and TMP network Expanded provincial highway system Inter-regional Transit Network (GO Transit) Existing GO Rail network Capacity and service improvements consistent with GO Transit 10 year capital plan Existing GO Rail network All day and reverse peak service on all existing GO Rail lines Freeway HOV on Highways 407, 400 and 404 Components In Each Solution Local Transit System Network Existing Transit Network Committed YRT Iocal transit service improvements Committed YRT Improvements Committed YRT Improvements Connections to new GO services Public Transit Improvements (e.g. Rapid Transit Network) No improvements in York Region No improvements in York Region No improvements in York Region No improvements in York Region An Enhanced Road Capacity Solution Referred to in the ToR as Road Expansion, the focus of this solution is an increase in road capacity only beyond the current commitments solution s road and public transit improvements. Road capacity is assumed to be increased to whatever level is required to meet the demand at the 2031 planning horizon An Enhanced Inter-regional Transit Solution Referred to in the ToR as Enhanced Stouffville Commuter Rail Service, but broadened to be less restrictive in the EA, in this solution, the transportation system would comprise all current road and local transit service commitments plus an enhanced inter-regional transit system consisting of both commuter rail and 400 series highway bus services such as those operated by GO Transit York Region Public Transit Improvements Referred to in the ToR as Rapid Transit, this strategy focuses on a significant improvement in public transit services in York Region in addition to all components of the current commitments" solution. The public transit service improvement comprises the implementation of the Region s Rapid Transit Plan recommended in the 2002 Transportation Master Plan. Within the Markham North South Link Corridor, the initial concept as described in the TMP is for a surface rapid transit service running from Markham Centre (with eastward connections) to the Sheppard Subway at Don Mills Station. 3.2 ANALYSIS OF ALTERNATIVE TRANSPORTATION SOLUTIONS Evaluation of the above alternative strategies must consider the advantages and disadvantages of each in terms of a broad range of criteria reflecting both the problem faced by the Region and the opportunities presented. These criteria are based on the primary objectives introduced in Chapter 1, which also provides a description of the Purpose of the Project or Undertaking. 3 Referred to in the ToR as Priority Transit with Transportation Demand Management, this base case strategy comprises all road infrastructure improvements currently committed in York Region s 10-year capital plan and Transportation Master Plan and the committed service and infrastructure improvements of the local and inter-regional transit authorities, YRT, TTC and GO Transit. Also included are Transportation Demand Management (TDM) strategies that the Region and local municipalities are currently pursuing. Examples include transit priority for new services, Smart Commute North Toronto, Vaughan and Smart Public Transit Improvements in the Markham Link Corridor as represented by the Region s Transportation Master Plan Capacity and service improvements consistent with GO Transit 10 year capital plan Committed YRT Improvements Connections to new Rapid Transit Rapid transit in all proposed corridors identified in TMP Implementation of transit priority network in TMP Extension of Yonge Subway to Highway 7 Extension of Spadina Subway to York Univ. Extension of Sheppard Subway to Scarborough Initially, it is necessary to analyze and quantify the performance of the existing transportation system and improvements currently committed in meeting the forecast travel demand during the planning period Forecast of Future Travel Demand York Region has had the greatest proportional increase in population and employment amongst the four suburban regions of the Greater Toronto TO1793 Markham North South Link Corridor Public Transit Improvements Environmental Assessment 28/02/
30 3 Area over the past 10 years. Within the 2021 planning horizon, the population of the Region is forecast to increase from the current 0.8 million residents to 1.2 million residents, while employment is estimated to increase from the existing 385,000 jobs to 655,000 by the year Markham Centre is one of the areas that will experience a significant amount of growth, some 25,000 residents and 17,000 jobs. This growth will generate a proportionate increase in travel demand. While it is expected there will be a greater segment of the population living and working within the Region itself, north-south travel demand between the Region and the City of Toronto will remain the dominant feature amounting to 35% of total travel demand The Demand Forecasting Model A comprehensive transportation demand forecasting model has been developed to provide an effective planning tool for York Region s Public Transit Improvements program. The model, developed from an extensive survey of travel behaviour, the 2001 Transportation Tomorrow Survey (TTS), has been successfully validated as a forecasting tool. With sensitivity to transportation and transit system connectivity, levels of service and prices, demographic characteristics and land use, the models can be used to analyze alternative policies (e.g., fares, service levels), investments (rapid transit, intermodal connections) and design details. The model estimates a.m. peak period travel for five modes: Auto driver and passenger; Public transit (VIVA, YRT, TTC, GO Bus) with walk access; Public transit with park/kiss-and-ride access; GO Rail with public transit or walk access; GO Rail with park/kiss-and-ride access. Travel is estimated for work, post-secondary school, secondary school and other trip purposes. The Program s model encompasses the Greater Toronto Area (GTA and Hamilton) and is based on the 2001 GTA zone system comprising 1,717 traffic zones. Additional traffic zone detail was included in the VIVA corridors to reflect walk access and station location assumptions. Level-of-service sensitive and behaviour based trip distribution (gravity model) and modal split (logit model) techniques are employed within the four-stage modelling process, described as follows: Trip Generation: estimates the number of trips that will be made within the study time period. A conventional approach using trip rates and regression equations is used for work, school and other trips. For work and school purpose trips, sub-categories are defined with trip rates developed that reflect the different travel behaviour of social groups by occupation type (professional, manufacturing, general office/sales) and schooling level (secondary and post secondary), respectively; Trip Distribution: links the trip productions and attractions by trip purpose and type to determine travel flows. A gravity model is calibrated to estimate work trip flows, again accounting for socioeconomic differences within the population by calibrating separate models for each occupation type. The process is sensitive to level-ofservice, with the resulting travel orientations reflecting the assumed improvements in public transit facilities and other major transportation system changes. A standard Fratar proportional balancing process is used for school and other trip purposes; Mode Split: determines the trip travel mode. A multinomial logit model is used to determine the breakdown by mode (auto, transit, commuter rail) for work (by occupation group) and post-secondary school trips. It also distinguishes the transit access mode (park-and-ride or all-way). Existing modal split rates are assumed for non-work trips, based on defined origin-destination superzones; and Trip Assignment: determines the trip route through the given transportation system. The standard assignment algorithms within EMME/2 are used, involving a multiple path transit assignment and user equilibrium auto assignment. In recognition of the interaction between the four components of travel behaviour, equilibration is achieved by iterating through the three stages of trip distribution, modal split and trip assignment until a reasonable level is achieved. In addition, a link between the trip distribution and modal split components is maintained to incorporate the interdependence between them. For preliminary planning purposes, the model forecasts can be translated from the a.m. peak 3-hour period to an a.m. peak hour or daily forecasts using relevant conversion factors. A factor of 0.6 was developed for the a.m. peak hour based upon comparisons of actual auto and transit traffic data, with 0.55 used for the higher volume Yonge Street Corridor. The daily trips were converted using a factor of 3.5, calculated from 2001 TTS data relationships between the time periods. The model outlined above was used to forecast the travel patterns and mode choice within the region and across regional boundaries in the 2021 and 2031 horizon year for each of the alternative transportation solutions, including the do nothing option. Population and employment data, based on the Regional and City of Toronto Official Plans and described in Chapter 4, was utilized as the primary input for the modelling. Chapter 4 also provides details of the basic transportation network modelled using the assumptions outlined below for each transport mode Key Assumptions for Demand Modelling Road Network The base case road network includes all arterial improvements identified in the 10-year York Region capital programme. It also includes planned collector roads such as the Rodick Road extension, Birchmount Extension and Enterprise Drive as outlined in area municipality transportation plans. Expansion of the provincial highway system within York Region included the proposed extensions of Highway 427 and Highway 404 and the widening of Highway 400. In the alternative scenario involving road expansion, an iterative approach was used to expand roads to meet projected auto demand. GO Transit Network Improvements considered under the enhanced inter-regional transit alternative are generally consistent with the GO Transit 10-year Capital Plan and 2021 Plan and included full all-day and reverse peak service on the Richmond Hill, Bradford and Stouffville GO Rail Services. Peak headways of 15 minutes were assumed for the Richmond Hill and Bradford services while headways of 10 minutes were assumed for the Markham to Union portion of the Stouffville Service. This latter assumption was made to explore the upper end potential of commuter rail service in the Markham North-South Corridor of the Region s proposed rapid transit plan. In addition to the changes to the GO Rail services, this alternative includes an extensive network of Freeway Express Bus or BRT inter-regional transit services including: A Highway 400 service from Newmarket (with connections to Barrie) to the Spadina Subway (Downsview); A Highway 407 service across York Region; A Highway 404 service from Newmarket to the Bloor Subway (Castle Frank Station). In all cases, these services included connections to major transit routes in South York and Toronto. TO1793 Markham North South Link Corridor Public Transit Improvements Environmental Assessment 28/02/

31 Local Transit Network For all future solutions except the Do Nothing Alternative, most of the recommendations from the York Region Transit 5-Year Service Plan have been included. This includes route extensions, route restructuring and expansion of service to new communities. For the York Region Public Transit Improvements Alternative, YRT services overlapping with rapid transit services (e.g. Express services from Markham and Unionville) have been removed to avoid duplication. Note: This change was anticipated at the time when the ridership forecasts were done, but it ha not been implemented. YR T is monitoring ridership and travel patterns on the Express services as a result of the viva services. In the existing transit network within the demand model, transit speeds were estimated from timetables and vary by route segment. Assumed speeds for regular bus services generally range from km/hr. With future traffic growth, transit speeds on major routes such as Highway 7 and Yonge Street, where minimal road expansion is planned, will likely degrade due to congestion. In order to reflect this condition in the model, speeds for all regular bus routes were reduced by 20% on average. For example, a route that was coded with a 20km/hr speed in the existing network was reduced to 16km/hr in the future network. This reduction was not applied for the Road Expansion Alternative or the Improved York Region Public Transit Alternative, as these options include significant improvements to reduce congestion (e.g. road expansion) or improve bus times in key corridors (e.g. bus-rapid transit and transit priority) Future Travel Demand Patterns From a transportation network perspective, alternative solutions that address the most dominant travel linkages will be the most effective. For example, if the majority of trips in the study area were from York to Toronto, than it would be appropriate to develop improved cross-boundary linkages. A more complete discussion of existing and future travel patterns is provided in Chapter 5; however, a brief context on the major travel markets in the study area is provided here for context. Table 3-2 summarizes the origin and destination patterns for automobile trips crossing the North of Steeles Avenue Screenline (between Don Mills Road and Kennedy Road) in 2031, assuming only the current committed network improvements are in place. These trips represent the general travel market that the Markham North-South Link Corridor improvements are trying to attract (in the case of transit improvements), or accommodate (in the case of road network improvements). As shown, the most significant travel markets are from York to the Rest of Toronto and from the Rest of Toronto to York. This is understandable given the location of the screenline on the boundary between the two regions. This also explains the low number of trips from York to York, which would be higher for other screenlines north of Steeles. What is important from this analysis is that only a small percentage of auto travel in the corridor is attracted to or produced from Planning District 1 8% for trips from York to PD1 and 3% for trips from PD1 to York. Figure 3-1 Automobile Trips Crossing North of Steeles Avenue Screenline (AM Peak Period Trips in 2031) 3 Improved Public Transit For the Improved York Region Public Transit Improvements Alternative, several major transit improvements were incorporated. These included: Figure 3-1 provides a graphical illustration of these travel patterns. A significant observation is that trips taper off significantly south of Highway 401. The results of this analysis suggest that in order to have a significant impact on travel behaviour in the corridor, public transit improvements cannot focus solely on trips from York to PD1, a market that is already well served by GO Transit Modelling of Alternative Transportation Solutions Bus Rapid Transit operating in all VIVA corridors at average speeds of up to 30 km/hr. In the Markham North-South Corridor, this consisted of a generic route that follows the VIVA Phase 1 alignment. Extension of subways including Yonge Subway to Highway 7, Spadina Subway to York Region (Langstaff) and Sheppard Subway to the Scarborough Town Centre. Implementation of transit priority on most major arterials in South York Region, consistent with Figure 20 of the York Region Transportation Master Plan. The effect of transit priority was assumed to provide an improvement of 5 km/hr over the 2021 base case bus speeds on the transit priority routes; The above assumptions formed the basis for forecasting the 2031 travel demand and mode choice and the ability of the five alternative transportation solutions to carry the forecast travel demand. Table 3-2 Origin-Destination Patterns of Automobile Trips Crossing North of Steeles Avenue Screenline (AM Peak Period Trips in 2031) Origin York PD1 Rest of Toronto Other GTA York 2% 8% 38% 1% PD1 3% 0% 0% 0% Rest of Toronto 40% 0% 0% 1% Other GTA 2% 1% 3% 0% An established technique for assessing the performance of any transportation system is to compare the relationship between overall travel demand and roadway capacity at selected locations or screenlines in the system. In any scenario being assessed, this method also recognizes the capacity of other non-auto modes contributing to the total capacity across any one screenline. Screenlines across the transportation network are selected to provide an improved basis for analysis for the following reasons: i) because of parallel facilities, there are a number of alternative routes available and the choice between routes can vary from the most direct route in order to reduce travel time and avoid local congestion. TO1793 Markham North South Link Corridor Public Transit Improvements Environmental Assessment 28/02/
32 3 ii) comparison of historical and future trends must be based on roadway groupings as present roadways are expanded or new parallel roadways are added. iii) the traffic characteristics, i.e. local vs. through traffic and modal split vary due to the type and location of the roadway facility and transit service. For analysis purposes, four east-west screenlines across the Markham Link corridor were selected as listed below and illustrated in Figure South of Highway 7 between Leslie Street and McCowan Avenue in York Region 2. South of 14 th Avenue between Leslie Street and McCowan Avenue in York Region 3. North of Steeles Avenue between Don Mills Road and McCowan Avenue in York Region 4. South of Finch Avenue between Don Mills Road and McCowan Avenue in the City of Toronto Figure 3-2 Screenlines for Demand Capacity Analysis Persons per hour Figure 3-3 Demand vs. Capacity for Screenline 1 - South of Highway 7 AM Peak Hour Southbound in ,000 35,000 30,000 25,000 20,000 15,000 10,000 5, ,000 Existing Do Nothing Current Commitm'ts Road Improvem'ts Enhanced Interregional Transit York Public Transit Improvem'ts Road Capacity Shortfall (unaccommodated demand) GO Rail 1,200 3,800 3,600 3,600 4,300 3,000 Rapid Transit ,100 Bus 1,000 1,800 1,700 1,600 1,800 1,100 Auto Pass 2,200 2,500 2,900 2,900 2,900 2,700 Auto Driver (accommodated demand) 18,200 21,200 24,300 24,300 23,900 22, Alternative Solutions: Demand vs. Capacity Analysis The effectiveness of each transportation solution in meeting the medium and long-term travel demand within the region and across regional boundaries was analyzed by modelling 2021 and 2031 AM peak period travel. Analysis was done using a network-wide approach adopting similar system components for all corridors of the Region s Transportation Master Plan network. Figures 3-3 to 3-6 illustrate the projected relationship between demand and capacity across the four screenlines for each of the alternative solutions in 2021 while Figures show the results for Caution should be observed in interpreting these results as a number of assumptions influence the demand patterns by alternative. For example, the alternative involving York Region Public Transit Improvements includes the extension of the Yonge Subway, which has the effect of pulling some demand out of the north-south corridor. This explains why total trips for this option are slightly lower than other options. For all three screenlines in York Region, the only alternative that would address corridor travel demand in 2031 is an alternative involving significant improvements to the public transit system a combination of BRT and improvements in transit on multiple corridors. In the Markham Link Corridor, the majority of demand is presently handled by automobiles. If the existing travel patterns continue, and no transit or road improvements are made, significant capacity shortfalls will result. Even today, there are several constraint points in the road network that contribute to localized congestion, which may not be completely captured in the demand model results. In the future, some of the capacity concerns will be addressed through planned/committed road widenings and new roadways, including Rodick Road, Warden Avenue, Birchmount Road and Kennedy Road. However, there will still be a significant demand for transit under any alternative. For example, under the Base Case alternative, all five arterials crossing the screenline could support buses operating at 8-9 minute headways or better. A major consideration in the evaluation of alternatives is the ability to handle projected growth beyond the 2031 horizon. An alternative involving public transit improvements and rapid transit will have residual transit capacity whereas the road expansion alternative would not. Persons per hour Figure 3-4 Demand vs. Capacity for Screenline 2 - South of 14 th Avenue AM Peak Hour Southbound in ,000 35,000 30,000 25,000 20,000 15,000 10,000 5, ,000 Existing Do Nothing Current Commitm'ts Road Improvem'ts Enhanced Interregional Transit York Public Transit Improvem'ts Road Capacity Shortfall (unaccommodated demand) GO Rail 1,200 3,900 3,600 3,600 4,400 3,100 Rapid Transit ,100 Bus 700 1,200 1, ,200 1,200 Auto Pass 2,300 2,500 2,900 2,900 2,800 2,600 Auto Driver 19,000 20,800 24,100 24,100 23,200 21,600 TO1793 Markham North South Link Corridor Public Transit Improvements Environmental Assessment 28/02/
33 Figure 3-5 Demand vs. Capacity for Screenline 3 North of Steeles Avenue AM Peak Hour Southbound in 2021 Figure 3-7 Demand vs. Capacity for Screenline 1 - South of Highway 7 AM Peak Hour Southbound in 2031 Figure 3-9 Demand vs. Capacity for Screenline 3 North of Steeles Avenue AM Peak Hour Southbound in ,000 40,000 40,000 Persons per hour 35,000 30,000 25,000 20,000 15,000 10,000 5,000 Persons per hour 30,000 20,000 10,000 0 Persons per hour 35,000 30,000 25,000 20,000 15,000 10,000 5, ,000 Existing Do Nothing Current Commitm'ts Road Improvem'ts Enhanced Interregional Transit York Public Transit Improvem'ts Road Capacity Shortfall GO Rail 1,200 3,900 3,600 3,600 4,400 3,100 Rapid Transit ,800 Bus 800 1,100 1, ,100 1,200 Auto Pass 2,100 2,200 2,600 2,600 2,400 2,300 Auto Driver (accommodated 17,100 18,700 21,400 21,400 20,200 18,800 demand) -10,000 Existing Do Nothing Current Commitm'ts Road Improvem'ts Enhanced Interregional Transit York Public Transit Improvem'ts Road Capacity Shortfall (unaccommodated 0-3, demand) GO Rail 1,200 4,300 4,100 4,100 5,000 3,500 Rapid Transit ,500 Bus 1,000 2,100 2,000 1,800 2,100 1,200 Auto Pass 2,200 2,900 3,400 3,400 3,300 3,100 Auto Driver (accommodated demand) 18,200 24,000 28,000 28,000 27,700 26, ,000 Existing Do Nothing Current Commitm'ts Road Improvem'ts Enhanced Interregional Transit York Public Transit Improvem'ts Road Capacity Shortfall 0-2,200-1,300-1, GO Rail 1,200 4,300 4,100 4,100 5,000 3,500 Rapid Transit ,000 Bus 800 1,200 1,100 1,000 1,300 1,300 Auto Pass 2,100 2,500 2,900 2,900 2,700 2,500 Auto Driver (accommodated 17,100 20,500 24,100 24,100 22,700 20,900 demand) Figure 3-6 Demand vs. Capacity for Screenline 4 South of Finch Avenue AM Peak Hour Southbound in 2021 Figure 3-8 Demand vs. Capacity for Screenline 2 - South of 14 th Avenue AM Peak Hour Southbound in 2031 Figure 3-10 Demand vs. Capacity for Screenline 4 South of Finch Avenue AM Peak Hour Southbound in ,000 40,000 40,000 Persons per hour 35,000 30,000 25,000 20,000 15,000 10,000 5, ,000 Existing Do Nothing Current Commitm'ts Road Improvem'ts Enhanced Interregional Transit York Public Transit Improvem'ts Road Capacity Shortfall (unaccommodated demand) GO Rail 2,000 4,500 4,300 4,300 4,900 3,700 Rapid Transit ,200 Bus 2,800 2,900 2,800 2,500 2,800 3,100 Auto Pass 2,100 2,300 2,400 2,400 2,400 2,300 Auto Driver (accommodated demand) 17,300 18,900 19,600 19,600 19,600 18,900 Persons per hour 35,000 30,000 25,000 20,000 15,000 10,000 5, ,000-10,000 Existing Do Nothing Current Commitm'ts Road Improvem'ts Enhanced Interregional Transit York Public Transit Improvem'ts Road Capacity Shortfall (unaccommodated 0-3,200-1,800-1, demand) GO Rail 1,200 4,300 4,100 4,100 5,000 3,500 Rapid Transit ,300 Bus 700 1,300 1,200 1,100 1,300 1,300 Auto Pass 2,300 2,800 3,300 3,300 3,100 2,900 Auto Driver 19,000 23,000 27,300 27,300 26,200 24,200 Persons per hour 35,000 30,000 25,000 20,000 15,000 10,000 5, ,000 Existing Do Nothing Current Commitm'ts Road Improvem'ts Enhanced Interregional Transit York Public Transit Improvem'ts Road Capacity Shortfall (unaccommodated 0-1, demand) GO Rail 2,000 4,800 4,700 4,700 5,400 4,000 Rapid Transit ,300 Bus 2,800 3,100 3,000 2,700 3,100 3,300 Auto Pass 2,100 2,400 2,500 2,500 2,600 2,500 Auto Driver (accommodated demand) 17,300 20,400 21,200 21,200 21,400 20,600 TO1793 Markham North South Link Corridor Public Transit Improvements Environmental Assessment 28/02/
34 Alternative Solutions: Impacts on Mode Shares Improving public transit is fundamental to the York Region Growth Strategy from a social, environmental and economic perspective. In order to evaluate the ability of each alternative to improve the attractiveness and use of public transit in York Region, this section presents a summary and discussion of the impacts of each alternative on transit mode shares. As shown in Figure 3-11, transit mode shares are expected to remain relatively constant under the Do Nothing and Current Commitments alternatives. The exception is in corridors where severe congestion contributes to significant shifts from auto to transit (a result that is mostly related to the underlying model assignment procedures that do not reflect capacity constraints on the transit system). An alternative involving enhanced inter-regional transit will have modest impacts on mode shares, although it important to note that some components of this enhanced transit system are not included in some of the screenline totals (e.g. freeway express bus services on Highway 400 and the Bradford GO Rail Service). Not surprisingly, the only option that could contribute to significant improvements in transit mode shares is an option involving public transit improvements, and in particular rapid transit. With the combination of transit improvements considered, mode shares could be expected to more than double compared to the existing mode shares. Transit Mode Split Including GO Rail 25% 20% 15% 10% 5% 0% Figure 3-11 Impact on Mode Shares in 2021 and 2031 (For Southbound trips North of Steeles Avenue) Existing (2001) Do Nothing Current Commitments Road Expansion Enhanced Inter-regional Transit York Public Transit Improvements Criteria for Evaluation of Alternative Solutions The framework adopted for evaluation of the alternative solutions was that of the Regional Official Plan objectives or themes stated in Chapter 1 in describing the purpose of the undertaking. These principle themes led to the following categories of criteria for the evaluation: Effects on the Social Environment (reflecting the Healthy Communities theme) Criteria in this category include the need for acquisition of residential or commercial property for new or widened road rights-of-way, level of traffic congestion, the potential for traffic infiltration through neighbourhoods, the effect of increased noise and vibration during construction and operation and the likelihood of adverse effects on archaeological resources and heritage or cultural features Effects on the Natural Environment (reflecting the Sustainable Natural Environment theme) The focus of this category of criteria is to assess the potential effect of a transportation solution on elements of the natural environment such as fisheries and aquatic habitat, wildlife habitat, natural vegetation and wetlands, ground and surface water resources, regional and local air quality and ecosystems Effects on the Economic Environment (reflecting the Economic Vitality theme) This category encompasses criteria that assess either opportunities to promote existing and increased economic activity or the potential adverse effects on current business activity in the corridor. The criteria measuring benefits include support of the approved urban structure and development distribution, improved access to business and community centres, increased pedestrian activity around facilities, the quality of commuting options for employees and the effect on congestion levels in the corridor. Potential adverse effects of the solutions are assessed by criteria such as disruption or modification of access to businesses, displacement of businesses due to right-of-way widening, convenience of goods movement and public sector capital funding needed The effectiveness of the transportation solution in meeting travel demand The purpose of this category is to compare the effectiveness of the alternatives in terms of their capacity to contribute to the forecast travel demand at the 2031 horizon year, based on the analysis presented in the previous section. A qualitative assessment of the long-term growth capacity is also considered in this category Evaluation of Alternative Transportation Solutions The selection of the preferred transportation solution stems from the multicriteria comparative evaluation presented in tabular form in Table 3.2. Each transportation alternative was assessed in terms of the criteria described previously and its ability to meet the overall planning objective for each category. A quality of response rating for each criterion was assigned to each alternative to provide a graphical indication of their relative merits on the basis of this qualitative and quantitative evaluation. The findings lead to the following conclusions: a) Clearly, doing nothing cannot be considered a valid alternative as it is not responsive to any of the key objectives in addressing the transportation problem. b) Although the current commitments solution, includes several road improvements in various parts of the region, it is unable to fully address the capacity shortfall for all screenlines in the Markham North-South Link corridor. Without corresponding improvement in public transit, continued operation of existing conventional transit service will not provide an effective alternative to the severe traffic congestion predicted for the arterial roads in the corridor. c) Enhancing road capacity would go a long way in addressing corridor travel demand, and road widenings already identified in York Region s 10 year capital plan and the Town of Markham s plan will add seven new lanes of capacity south of Highway 7 between Leslie Street and McCowan Road. Widening of arterial roads beyond this would result in major social impacts in the form of property acquisition, a decrease in air quality, a higher accident potential and community barrier effects. The most limiting aspect of this alternative is that road widening south of Steeles Avenue has not been contemplated by the City of Toronto and would have significant impacts on stable residential areas. d) Enhancing inter-regional bus and rail services in the corridor will not reduce the road capacity shortfall significantly because more frequent rail service attracts primarily downtown-toronto destined trips and interregional bus service on Highway 404 bypasses the core development nodes along the corridor. In addition, the location of the inter-regional transit routes does not support the urban form envisioned in the TO1793 Markham North South Link Corridor Public Transit Improvements Environmental Assessment 28/02/
35 Region s Official Plan and thus will not encourage transit-oriented development within the region. e) As noted previously, the Public Transit Improvements solution is the only alternative that eliminates most of the shortfall in road capacity in the corridor. By providing an effective alternative to auto use, this solution supports both York Region and local municipal Official Plan objectives. At the same time, the improvements can incorporate significant flexibility to expand the system capacity over time for the long-term travel needs in the Region. 3 As well as responding best to the transportation demands, this alternative can be implemented with minimal adverse effects on the natural environment and will make a positive contribution to the reduction of harmful vehicle emissions. In addition, adverse effects on the social environment can be mitigated and the solution offers the opportunity to support the desired urban form, enhance streetscapes and encourage development of more liveable communities. TO1793 Markham North South Link Corridor Public Transit Improvements Environmental Assessment 28/02/
36 Table 3-3 Evaluation of Alternatives to The Undertaking Evaluation ALTERNATIVE TRANSPORTATION SOLUTIONS Categories and criteria Do Nothing Current Commitments Enhanced Road Capacity Enhanced Inter-regional Transit York Public Transit Improvements 3 Effects on Social Environment acquisition of residential or commercial property for new or widened road rightsof-way; the level of traffic congestion; the potential for traffic infiltration through neighbourhoods; the effect of increased noise and vibration; and effects on archaeological resources and heritage or cultural features. Congestion due to a significant road capacity shortfall in corridor will cause: neighbourhood traffic infiltration, a loss of community mobility, an increased accident potential degraded transit service making it less attractive as a travel option. Residual road capacity shortfall in corridor will, to a lesser degree, still cause: neighbourhood traffic infiltration, some loss of community mobility and pressure on existing road rights-of-way, an increased traffic accident potential the present low transit mode split to continue in the absence of an enhanced transit service. Road widening beyond current commitments minimizes capacity shortfall but will: require commercial/ residential property to achieve wider rights-of-way on major arterials, initially reduce neighbourhood traffic infiltration but create more of a barrier between communities, perpetuate reliance on auto use in an already congested corridor, not reduce traffic accident potential. Residual road capacity shortfall in corridor will, to a lesser degree, still cause: neighbourhood traffic infiltration, some loss of community mobility and pressure on existing road rights-of-way, an increased traffic accident potential, Higher service frequency on rail rights-of-way increases noise intrusion potential, Little opportunity for streetscape enhancement. A focus on inter-regional transit enhancement will not improve mode split for internal travel. Replacing most of road capacity shortfall by greater transit use will: reduce neighbourhood traffic infiltration, reduce traffic accident potential, offer improved access to community amenities by providing a convenient alternative to auto use, Insertion of new transit infrastructure can act as a catalyst for streetscape improvement and urban renewal. However dedicated surface transitways in existing road R.O.W. may require modified access patterns to adjacent properties. Effects on Natural Environment fisheries aquatic habitat wildlife habitat natural vegetation and wetlands ground and surface water resources regional and local air quality ecosystems Continued reliance on auto use for growing travel demand will increase overall vehicle trips and congestion resulting in increased emissions and energy consumption. Continued reliance on auto use for growing travel demand will increase overall vehicle trips and congestion resulting in increased emissions and energy consumption. Continued reliance on auto use for growing travel demand will increase overall vehicle trips and congestion resulting in increased emissions and energy consumption. Marginally better than Do Nothing since added road capacity will reduce overall traffic congestion. Road widening will require more new or widened bridges at creeks and rivers. A higher mode split for inter-regional travel will reduce the total number of vehicle trips therefore vehicle emissions and GHG effects. Expansion of transit infrastructure in existing rail and freeway rights-of-way minimizes adverse effects on natural features. A higher transit mode split for all travel destinations will contribute to reduced vehicle emissions and GHG effects. Expansion of transit infrastructure in existing road or rail rights-ofway minimizes adverse effects on natural features. Road widening for transit facilities will require some new or widened bridges at creeks and rivers. Effects on Economic Environment opportunities to promote existing and increased economic activity; potential adverse effects on current business activity in the corridor; support for the Region s vision and approved urban structure access to community centres, increased pedestrian activity around facilities; the quality of commuting options and the effect on congestion levels access to and displacement of, businesses and convenience of goods movement. direct costs travel time delay costs. Effectiveness of Transportation Solution in meeting travel demand their capacity to contribute to the forecast travel demand at the 2031 horizon year; and, the long-term growth capacity is also considered in this category. Resulting significant loss of mobility will: discourage business investment, prevent achievement of O.P. land use and development objectives, degrade employees work commute in and to, the Region, significantly increase time-related cost of travel in Regional economy. Doing nothing minimizes public sector capital costs and business displacement but will increase indirect business costs due to inefficiency of goods and people movement. Indirect cost due to urban sprawl requiring additional facilities. Continuing corridor congestion without an effective non-auto alternative will: slow business investment, not promote regional/municipal O.P. urban form and development objectives, degrade employees work commute in and to, the Region, gradually increase time-related cost of travel and goods movement in the Region off-setting lower public sector capital spending The region;s TMP current commitments will require fairly significant on-going public sector capital spending. Worsening congestion over time will gradually increase timerelated cost of travel and goods movement in the Region. A focus on meeting travel demand by increasing road capacity alone: does not promote regional/municipal O.P. urban form objectives and constrains development levels, downgrades the transit option forcing people and goods to share the enhanced road system, requires less government investment in capital works but higher unit travel cost by general public using road system. Increase in time-related costs is considered less significant assuming road capacity increases can be achieved. Use of existing rail or provincial highway rights-of-way offers limited opportunities to support regional/municipal O.P. urban form and development pattern objectives. Improves goods movement by providing some reduction in auto volumes on arterial roads. Requires substantial government investment in capital works and inter-regional transit operations. Longer term congestion related costs for goods and people movement will still increase for intra-regional travel. Improvement such as a rapid transit network supports Region s O.P. centres and corridors urban form and municipal development objectives. Improves goods movement by providing some reduction in auto volumes on arterial roads. Requires substantial and likely the highest, government investment in capital works and regional transit operations. Reduces land acquisition costs for transportation facilities by promoting greater use of high capacity vehicles. Offers a lower unit travel cost option to the general public. Forecast major shortfall in corridor road capacity (8-10 traffic lanes each direction) indicates that relying on existing systems is not an effective solution to future intra- and inter-regional travel needs, system operational performance will be severely degraded. Forecast continuing shortfall in corridor road capacity (6-10 traffic lanes each direction) indicates that: focus on auto-based system is not an effective solution to future intra- and inter-regional travel needs, local transit system operational performance will be severely degraded. Reduction in transit trips compared to Do Nothing Requires 3-6 arterial lanes in addition to current commitments to provide 2031 capacity. Largely eliminates road capacity shortfall but provides limited reserve capacity for long-tern growth. Relies primarily on auto use for connectivity to inter-regional transit services. Solution discourages use of committed transit services. Forecast continuing shortfall in corridor road capacity (6 traffic lanes each direction) indicates this solution cannot increase transit mode split for shorter intra-regional trips. Requires enhanced local transit service and large park-and-ride lots to attract ridership. Offers long-term reserve capacity for some origin-destination pairs. Solution increases inter-regional transit trips only Rapid transit in dedicated lanes largely eliminates road capacity shortfall and provides reserve transit capacity for long-tern growth. Provides improved access and connectivity to inter-regional services operating in Region. Offers long-term growth capacity for several origin-destination pairs. Solution increases transit trips and offers more choice to residents and employees LEGEND: Least Responsive Most Responsive TO1793 Markham North South Link Corridor Public Transit Improvements Environmental Assessment 28/02/

37 4. FORECAST OF TRAVEL DEMAND WITH PUBLIC TRANSIT IMPROVEMENTS Figure 4-1 Study Area Travel Patterns (2001 AM Peak Period Total Trips) This chapter provides a description of existing and future travel demand patterns in the study area and potential transit ridership to be expected from various generic public transit improvements. This information is used to further refine the potential of alternative methods for improving public transit discussed in the next chapter. 4.1 FUNCTION OF THE PROPOSED MARKHAM LINK CORRIDOR PUBLIC TRANSIT IMPROVEMENTS Existing Corridor Travel Patterns This section presents an analysis of AM peak period motorized travel (auto and transit) to and from the study area in Figure 4-1 illustrates the overall travel patterns for trips to and from the study area as well as to and from Markham as a whole. Analysis of 2001 AM peak period motorized vehicle trips shows that there is a higher number of trips to the study area than from the study area: 128,100 versus 104,500. This is due to the high number of jobs in the Markham portion of the study area, which attracts almost 80% more trips than it generates; while the Toronto portion attracts 84% of the number of trips that it generates. Origins of Trips to Town of Markham Origins of Trips to Markham Study Area 4 Perhaps a reflection of the distribution of population and employment in the study area, there is a high degree of self-containment of trips. Approximately 30% of the trips originating in the study area in the AM peak period remain in the study area. Many of these trips are from the residences north of Highway 7, but also from the residential areas in north Toronto (Scarborough area). Roughly one-third of the commuter trips to the Markham study area are from other parts of Markham and York Region, one-third are from Toronto, and 6% are from southwest Durham Region. For the study area as a whole, 15% of trips from the study area in the AM peak period are destined to the Toronto Central Area (PD1). For the Markham portion of the study area, only 13% of the trips are destined to PD1. Destinations of Trips from Town of Markham Destinations of Trips from Markham Study Area TO1793 Markham North South Link Corridor Public Transit Improvements Environmental Assessment 28/02/
38 Existing Transit Ridership Regular Transit As discussed previously, the study area is served by several north-south routes. Table 4-1 provides a summary of ridership at various points for the major routes. It is interesting to note that for all but the McCowan route, the primary direction is the northbound direction. The virtual lack of southbound ridership can be explained by several factors. First, as mentioned previously, the majority of the north part of the study area is employment uses, which generate inbound trips in the morning peak period. Secondly, these routes tend to terminate in employment areas in the north part of the study area and are not accessible to the residential development. Clearly, any rapid transit system would need to establish good feeder bus services from the residential areas in Markham to attract more Toronto-bound riders. A final factor is that most of the TTC routes are not focused on employment areas at their southern ends. Table 4-1 Existing Transit Ridership 2003/04 (AM Peak Period) North of Steeles Avenue South of Steeles Avenue North of Finch Ave Route NB SB NB SB NB SB Victoria Park - TTC Warden - TTC Birchmount - TTC McCowan - TTC Don Mills - TTC Source: Toronto Transit Commission, Riding Count Summary, various dates GO Transit The Stouffville GO Rail service provides access to the downtown for Stouffville, Markham and North Scarborough. Service levels and ridership have been increasing steadily on this line over the last decade. Table 4-2 provides a summary of the AM peak period boardings for the line in 1993 and As shown, every station has more than doubled in ridership between 1993 and Overall line ridership in the last 10 years has increased by a factor of three. This is explained partly by the increases in service levels, but also is due to the considerable growth in population in the corridor. Table 4-2 Stouffville GO Rail Ridership ( ) AM Peak Period Boardings Station 1993 (2 trains) 2002 (4 trains) Stouffville GO Station Mount Joy GO Station - - Markham Village GO Station Centennial GO Station - - Unionville GO Station Milliken Agincourt LINE TOTAL Source: 1993 GO Rail Passenger Survey, May 2002 Cordon Counts. 4.2 TRAVEL DEMAND AND TRANSIT RIDERSHIP PROJECTIONS This section describes the future travel demand markets as well as the projected ridership on the improved public transit services in the Markham North-South Corridor during the planning period to the 2021 horizon year The Demand Forecasting Model The transportation demand forecasting model described in Chapter 3 and used for analysis of the response of alternative transportation solutions to long term travel demand was again used to develop forecasts of the ridership to be carried by the improved public transit alternative. Ridership forecasts were prepared for a representative rapid transit alignment in the Markham North-South Corridor (which corresponds to the VIVA Phase 1 alignment, originally referred to as the Quick-Start alignment). As discussed later in this chapter rapid transit services were assumed to be in place in all other VIVA corridors Modeling Scenarios and Assumptions Future Population And Employment Population and employment projections at the traffic zone level from the Official Plan forecasts provided by York Region and the City of Toronto have been used. No modifications were made to concentrate future development in nodes and corridors served by VIVA, which typically occurs with the introduction of new rapid transit facilities. This reflects a conservative assumption for the development of VIVA ridership forecasts. Over the study horizon (2001 to 2031), York Region is anticipated to have the highest absolute population growth (an increase of 586,000 to 1.36 million) as compared to other regions in the GTA. York Region is also forecast to have very strong employment growth (348,000), which follows only Toronto (380,000) in terms of absolute employment growth. Most of this growth takes place in the three southern municipalities of York Region: Markham, Vaughan, and Richmond Hill. Approximately two-thirds of the population growth and three-quarters of the employment growth forecast for York Region are anticipated to take place in these municipalities. Population and employment growth for these municipalities is illustrated on Figures 4-2 and 4-3. Table 4-3 summarizes the population and employment forecasts for the study area relative to Markham and Regions within the GTA. As observed over the last decade, growth in the Markham study area is expected to be significantly greater than that of the Toronto study area over the next 30 years at 41% for population and 34% for employment in the former and 3% and 23% in the latter. This is consistent with expected growth in the Regions in which each area is located. It also indicates a reversal of trend in the Markham study area, in that population growth will exceed employment growth. Table 4-3 Population and Employment Growth Forecasts, 2001 to 2031 POPULATION AREA Growth % Growth STUDY AREA 241, , , ,000 38,000 16% Markham area 80,000 93, , ,000 33,000 41% Toronto area 161, , , ,000 5,000 3% TOWN OF MARKHAM 218, , , , ,000 70% GTA REGIONS 5,065,000 6,106,000 6,740,000 7,337,000 2,272,000 45% York 772,000 1,008,000 1,195,000 1,358, ,000 76% Toronto 2,451,000 2,720,000 2,800,000 2,882, ,000 18% Durham 503, , , , ,000 83% Peel 967,000 1,215,000 1,352,000 1,475, ,000 53% Halton 372, , , , ,000 89% EMPLOYMENT AREA Growth % Growth STUDY AREA 150, , , ,000 45,000 30% Markham area 97, , , ,000 33,000 34% Toronto area 53,000 58,000 62,000 65,000 12,000 23% TOWN OF MARKHAM 119, , , , ,000 90% GTA REGIONS 2,662,000 3,472,000 3,930,000 4,157,000 1,495,000 56% York 386, , , , ,000 90% Toronto 1,454,000 1,688,000 1,798,000 1,834, ,000 26% Durham 167, , , , , % Peel 488, , , , ,000 71% Halton 167, , , , , % TO1793 Markham North South Link Corridor Public Transit Improvements Environmental Assessment 28/02/
39 A large portion of the growth in the Markham portion of the study area will be due to the development of Markham Centre. At full built-out, this is expected to add some 23,000 residents and 37,000 jobs to the area. The approved master plan for the Downtown Markham Area (the area between Warden Avenue and Kennedy Road, south of Highway 7) includes 8,120 residents and 20,000 jobs. Figure 4-3 Employment Growth in York Region Municipalities, Re-orientation of existing routes to connect to York University/ Downsview TTC Station, Don Mills TTC Station and new GO Rail stations; Enhancements including the filling in of a basic grid system; and Enhanced continuous through-services, between York Region and Toronto. Even though population will exceed employment growth, there will still be a net in-commuting of workers to fill jobs in the area. While the north part of Toronto (Scarborough) will continue to provide workers, many jobs may also be filled by people living in Markham, particularly as the majority of prospective employers are in the high tech or white-collar sector and will draw on the younger population of Markham. Figure 4-2 Population Growth York Region Municipalities, YRT Route Restructuring: the following YRT services are assumed to be removed to avoid duplication with Quick Start or VIVA services: YRT Highway 407 Express Buses Markham; YRT Highway 407 Express Bus Unionville; GO Yonge B Bus. (As noted previously in Chapter 2, express services are still in operation and subject to monitoring. As a result, the forecasts presented here for the Markham N-S link may be conservative). GO Rail: Increased services in all GO Rail corridors, consistent with GO Rail s 10 Year Capital Plan and 2021 Plan. This includes full all-day service on the Bradford, Richmond Hill and Stouffville GO Rail lines and new GO Stations located at Kennedy/Bloor-Danforth Subway and Leslie/Sheppard Subway Base Assumptions for Demand Modelling The following key assumptions provide the basis for generating 2021 travel demand forecasts for the VIVA Network Scenario (see Section for description of VIVA), as described below: Road Network: Improvements to the arterial road system in York based on the 10-year York Region capital programme and TMP have been incorporated in the model. Expansion of the provincial highway system within York Region included the proposed extensions of Highway 427 and Highway 404, and the widening of Highway 400. York Region Transit (YRT) Network: For transit improvements up to 2021, most of the recommendations from the York Region Transit 5-Year Service Plan: Conventional Transit have been incorporated. This includes route extensions, route restructuring, and new services in newly developed and previously un-serviced areas. The base transit system in York Region for each horizon year is defined by York Region Transit s Five- Year Service Strategy route structure. The main components include: Route extensions to new areas of development; GO Bus: Highway 407 Express Bus added to network, with York Region stops at Unionville, Langstaff and York University. A peak period headway of 10 minutes is assumed. TTC: Rapid transit system is based on the present system, with extension of the Spadina Subway assumed to York University by Socio-economic Factors: The model utilizes three transit friendliness measures within the mode choice sub-model, relating to urban density, land use mix, and auto ownership. The first two were estimated using population and employment forecasts at the traffic zone level. Auto ownership has been projected using a multi-variate auto-ownership model, relating car-ownership with such variables as average household income, household size, level of transit service, and urban density. Auto Costs: Parking costs in real dollars are assumed to increase by 15% over existing conditions within the City of Toronto. The existing spatial coverage of parking costs will expand, consistent with strategies of the Toronto Parking Authority. Within York Region, a $5 parking charge is assumed at major nodes (e.g. Markham Centre, Vaughan Corporate Centre) and at employment locations in the VIVA corridors of Yonge Street and Highway 7. No parking charge is assumed at GO stations. TO1793 Markham North South Link Corridor Public Transit Improvements Environmental Assessment 28/02/
40 Fares: Current fare structure is assumed with the YRT three-zone system, GO Transit fare by distance and TTC flat fare. No increase in fares in real dollars is assumed for TTC, GO Transit and YRT services. VIVA is assumed to have the same fare as YRT services, with free transfers between YRT and VIVA services. Fare Integration: It is assumed that current fare policies would be in effect in 2021, with no fare integration between TTC and YRT/VIVA and a double fare for many short cross-boundary transit trips across the York/Toronto, consistent with current policies. Highway 7 An all day service operating on Highway 7 between the Cornell Bus loop in Markham and Martin Grove in Woodbridge with the route deviating to serve York University using a loop to the university via Keele Street and Jane Street. Figure 4-4 Assumed Rapid Transit Network for Modelling Purposes on Pharmacy Avenue, west on Finch Avenue to Seneca College, south on Don Mills Road to TTC Don Mills subway station. Speed and Headway Table 4-4 shows the speed and headway assumptions for VIVA services. The speeds are indicated by corridor segment and are based on speed and delay studies of existing conditions in the respective VIVA corridors, and estimates of performance based on posted speed limits, stop spacing, level of transit priority and other factors. 4 Service Policies: Closed door services of YRT/VIVA routes in Toronto is assumed. This reflects current policies, with YRT services operating in Toronto not permitted to serve internal Toronto trips VIVA Networks Speeds on the Markham North-South Link south of Steeles Avenue will depend on the degree of separation from regular traffic. It is expected that by 2021, the City of Toronto will have constructed dedicated transit lanes on Don Mills Road and will have transit priority measures in place on Victoria Park Avenue. The VIVA Phase 1 networks are assumed to operate in all four VIVA corridors. The rapid transit program, which commenced in Fall 2005 and was implemented in stages, is designed to begin building long-term rapid transit ridership and serve the Region s Corridors and Centres land use plans designed to support higher transit usage. For purposes of this report, full implementation of VIVA is modelled assuming Bus Rapid Transit (BRT) in each of the four corridors. The ultimate VIVA network configuration could involve combinations of BRT, Light Rail Transit (LRT) or subway with the technology transitions taking place over time as required by demand and when funds are available. BRT ridership levels are also considered representative of the potential ridership that might be achieved with LRT technology operating the same corridors. In the scenario modelled, BRT is assumed to be operating in dedicated bus lanes with traffic signal priority treatment at signalized intersections and other transit priority treatments, as required to maximize transit operations. Route Structure The route structure for VIVA services is comprised of six services as described below and shown in Figure 4-4. Yonge: Newmarket-Finch TTC An all day service operating on Yonge Street between Newmarket and the TTC Finch subway station in Toronto. Markham Centre-Finch TTC A peak period only service operating from Markham Centre on Highway 7 to the TTC Finch subway station via Highway 7, the Richmond Hill Centre and Yonge Street. Note: VIVA Phase 1 services now in place differ slightly from those modelled and shown on the map. See for a Vaughan-Downsview TTC An all day service operating on Highway 7 from Martin Grove to Jane Street, extending south to York University. Markham-Don Mills TTC An all day service operating on Highway 7 from Cornell Bus loop in Markham through Markham Centre to south on Warden Avenue, west on Denison Street, south on Esna Parkway, continuing south Corridor/Segment Table 4-4 Speed and Headway Assumptions Segment Length (km) VIVA (BRT) Service Frequency Speed (km/h) (Buses per Hour) Yonge Street Finch Station to Steeles Steeles to Hwy 7/Langstaff Highway 7/Langstaff - Major MacKenzie Major MacKenzie to 19 th Avenue th Avenue to Newmarket Finch Station to Newmarket Highway 7 (West) Highway 27 to Islington Islington to Highway Highway 400 to York U York U. to Yonge Highway 7 (East) Yonge to Bayview Bayview to Leslie Leslie to Woodbine Woodbine to Warden Warden to Kennedy Kennedy to MSH Highway 27 MSH Vaughan NS Link Highway 7 to Steeles Steeles to York U York U. to Downsview TTC Markham NS Link Markham Centre to Highway Highway 407 to Steeles Steeles to Don Mills TTC Stations The station spacing is assumed to be approximately one kilometre in the TO1793 Markham North South Link Corridor Public Transit Improvements Environmental Assessment 28/02/
41 denser, built-up portions of the corridors and two kilometres in the lower density areas. The following inter-modal stations are assumed in York Region, allowing transfers between GO Rail, YRT/YTTP, and park-and-ride facilities: Langstaff Station interface between VIVA/YRT services and the GO Richmond Hill Line and GO Highway 407 BRT; Unionville/Markham Centre Station interface between VIVA/YRT and GO Stouffville Line and GO Highway 407 BRT; and York University Station - interface between VIVA/YRT services and the GO Bradford Line and GO Highway 407 BRT. VIVA services extending into the City of Toronto will link to the TTC subway system at Finch Station (Yonge Line), York University Station (on an extended Spadina Line) and Don Mills Station (Sheppard Line). Park-and-Ride Facilities Table 4-5 shows the assumed location and number of parking spaces at park-and-ride lots serving the VIVA Markham Link service, which extends over a portion of the Highway 7 Transit. Approximately 900 parking spaces are assumed for rapid transit service operating in the study area Table 4-5 Park and Ride Lot Capacities VIVA Corridor Station No of Parking Spaces Highway 7/Markham NS Warden & Highway Highway 7 E of Highway Highway 7 (Others in Study Highway 7 & Markham Stville. Hosp 200 Area) Highway 7 & Bayview 200 Total Study Area RIDERSHIP FORECASTS The following section presents 2021 ridership estimates for the Markham North-South Link, which assumes BRT operations in dedicated lanes with significant transit priority measures. The forecasts assume a 2-minute headway during peak periods, provided over the full length of the service from Highway 7/9 th Line to TTC Don Mills Station via Markham Centre. The section of the Markham North-South link service operating on Highway 7 between 9 th Line and Markham Centre (Kennedy Road) combines with the Highway 7 VIVA BRT service to provide an effective 2-minute headway over Highway 7 section. The Markham North-South service is overlaid over the existing YRT route structure, with local services continuing in VIVA corridors. In Toronto, no adjustments to TTC routes have been made, with VIVA services operating closed door Rapid Transit Passenger Volumes Table 4-6 presents a 2021 ridership summary for the Markham North-South Link, for the segments between Markham Centre and Don Mills Station only. The 2021 a.m. peak hour volume in the peak direction is projected at 3,000 passengers for the Markham North-South Link, with the peak point location southbound at Warden Avenue and Enterprise Drive. The projected daily ridership is estimated at 24,000 for the north-south portion from Markham Centre to the Sheppard Subway and 45,000 for the entire service from the Cornell bus loop to Don Mills Station. Statistic Table Ridership Summary for the Markham Link Cornell Bus loop to Markham Centre Markham Centre to Don Mills Station Line total Peak Headway (min) Speed (km/h) Route length (km) AM Peak (3-Hour) Period Passenger Boardings ,200 Passenger-kilometres ,700 Vehicle-kilometres ,210 Peak Hour Volume Peak Point Location Southbound at Markham Centre. Southbound at Enterprise Dr./Warden Daily Boardings Figure 4-5 provides a plot of the link volumes for the Markham North-South Link service, with maximum loadings at various sections of the corridor. In the a.m. southbound direction, the 2021 peak point volume is approximately 3,000 passengers for the section of the route on Warden Ave, at Highway 407. The volume decreases to 2,730 passengers per hour at Steeles Avenue, then to 2,110 passengers at TTC Don Mills Station. In the a.m. northbound or reverse peak direction, transit volumes are approximately 50% of the peak direction. At Steeles Avenue, the a.m. peak hour volume is projected to be approximately 1,600 passengers representing the peak point in the northbound direction. Peak hour volumes decrease to approximately 400 passengers on Highway 7 section of the route. Figure 4-5 AM Peak Hour Link Volume 2021 BRT Richmond Hill LANGSTAFF FINCH STATION 2, ,000 3, ,600 2, Markham Toronto DON MILLS STATION By the end of 2005 and prior to the construction of any new dedicated transitway infrastructure, York Region proposes to introduce new services with rapid transit characteristics but operating in mixed traffic with signal priority measures (referred to as VIVA Phase 1). Ridership on these services has also been modelled and is included as a Base Case in the discussion below for comparison to provide an indication of the attractiveness of full-featured BRT service. Table 4-7 shows various ridership indicators such as peak volume, boarding, alighting, and passenger-km by segment within the corridor, for the a.m. peak hour for the Base Case and full VIVA (BRT) scenario. With VIVA services, the passenger boardings in the corridor are projected to increase from approximately 2,000 in the Base Case to 3,540, an increase of 75%. The peak load point volume at Steeles Avenue in the southbound direction increases from approximately 2,000 to 3,000 (50%). Essentially, the full BRT system attracts more people throughout the line, but demand is more spread out and therefore total ridership increases more than peak loadings. 4 TO1793 Markham North South Link Corridor Public Transit Improvements Environmental Assessment 28/02/

42 4 Segment Table AM Peak Hour Ridership by Segment for Markham Link Corridor Link Volume (Peak Direction) Base Case (VIVA Phase 1) Ons Passengerkm Link Volume (Peak Direction) VIVA (BRT) Ons Passenger -Km Markham Centre to Highway 407 2, ,200 3,000 1,550 6,300 Hwy 407 to Steeles 2, ,400 3, ,400 Steeles to Don Mills TTC 1,800 1,090 13,600 2,500 1,730 20,200 Corridor Total 2,020 26,200 3,540 38,900 a) York/Toronto Screenline Volumes Table 4-8 presents the changes in travel in the Markham North South Link corridor based on a screenline at Steeles Avenue between Don Mills Road and Kennedy Road. The screenline summary compares a.m. peak (3-hour) period volumes in 2001 (base year) with 2021 BRT. The BRT service will help to increase total transit trips across the screenline from 2,600 almost 11,000. Approximately 50% of the transit trips will be handled by the BRT service, followed by GO Rail. It is important to note that these figures will depend on other changes that are made to the transit network in York Region. For example, the extension of the Yonge Subway to Highway 7 will attract some trips from the Markham North-South link onto the planned Highway 7 transit service as it would involve one less transfer. Table 4-8 (A.M. Peak 3-Hour Period Volumes Screenline North of Steeles between Don Mills and Kennedy) Modelled BRT Change BRT vs Service/Mode 2001 SB NB SB NB SB NB TTC / YRT / GO Bus 560 1, GO Rail 2,060-4,940 - Markham NS Line - - 5,080 2,690 Total Transit 2,620 1,520 10,820 3,720 Auto 12,780 9,810 23,020 23,000 Total Trips 15,400 11,330 33,840 26,720 Trips attracted to BRT routes over the planning period, comprise those presently using local YRT/GO bus services that are slated to be replaced by rapid transit in the corridor as well as growth in ridership in key growth areas such as Markham Centre. The remaining transit trips in the corridor are those attracted to the corridor from feeder services due to the improved service of the Yonge Street BRT services. GO Rail ridership on the Stouffville line, consisting primarily of trips destined to Toronto s PD1 zone, is projected to increase by 2,900 passengers or 139% by This is also partially due to the new connection to the Bloor Subway line at Kennedy Station. b) Travel pattern and modal split Travel to and from Markham during the a.m. peak period is shown in Table 4-9 for 2001 and a 2021 BRT scenario. This table presents the total travel flows on an origin-destination basis, indicating growth over the next twenty years and the transit and modal split implications. Currently, there are approximately 59,400 total trips (auto+transit+go) originating from Markham in the a.m. peak 3-hour period and this is projected to increase to 82,000 trips by With BRT, the transit trips increase to 12,100 trips compared to 6,300 in The corresponding modal split increase for a.m. peak period trips originating from Markham is 10.7% in 2001 increasing to 14.8% in 2021 with BRT. Within Markham, the Markham North-South Link and associated BRT services are projected to increase transit modal split from 2.8% in 2001 to 5.8% in 2021 with BRT. For travel destined to Markham in the a.m. peak period, the transit modal split is projected to increase from 4.7% in 2001 to 7.8% in 2021 with BRT. Table 4-9 AM Peak (3-Hour) Period Total Trips and Transit Modal Split From To Total Trips (000's) Transit Trips (000's) Growth BRT Transit Model Split BRT Markham % 5.8% RH & Vaughan % 6.2% PD % 40.1% Markham Toronto (East&Central) % 9.9% Toronto (West) % 14.1% Other % 2.1% RH & Vaughan % 6.4% Toronto % 12.1% (East&Central) Markham Toronto (West) / % 13.3% PD1 Other % 2.3% Markham All % 14.8% All Markham % 7.8% To / From / Within Markham % 9.5% Figure 4-6 shows a plot of the origin and destination patterns for trips using any portion of the Markham North South Link (developed thorough a select line process in EMME/2). The analysis indicates that approximately 21% of the users of the Markham North-South link start and end their trip in York Region. Only 21% of the users starting their journey in York Region continue to Planning District 1 (Central Area of Toronto) while 37% are destined for the rest of Toronto. For transit trips destined to York Region and using the Markham Link, 48% come from within York Region and 48% comes from the rest of Toronto. Only 2% of trips destined to York Region using the Markham Link start in PD1. Figure 4-6 Origin and Destination Patterns of Transit Riders Using the Markham North-South Link (AM Peak Period) TO1793 Markham North South Link Corridor Public Transit Improvements Environmental Assessment 28/02/
43 c) Boarding and alighting patterns Figure 4-7 AM Peak Period Boarding / Alighting 2021 Base Case Figure 4-7 presents the station boardings and alightings for the Markham North-South Link service for the a.m. peak 3-hour period. In the peak southbound direction during the a.m. peak period, the main boarding stations include Highway 7/9 th Line, Highway 48, McCowan and Enterprise, with these stations also including park-and-ride ridership. The Enterprise station includes connections to YRT/GO Stouffville services, resulting in a peak station loading of over 1,500 boardings in the a.m. peak 3-hour period. Alighting patterns for a.m. southbound services are focused in the employment corridor extending from Markham Centre, and Esna Park/Gordon Baker Business Parks and student travel to Seneca College. Approximately, 5,000 a.m. peak 3-hour passengers connect to the Sheppard Station at Don Mills Station. Boardings/Alightings Boardings Alightings Cumulative Load Cornell Wooten Main-Markham McCowan Bullock Kennedy Markham Centre Enterprise/Warden Transit Stop 14th Avenue Denison Esna Park/Steeles Gordon Baker Finch - Seneca Don Mills Subway Boardings/Alightings Boardings Alightings Cumulative Load Don Mills Subway Finch - Seneca Gordon Baker Esna Park/Steeles Denison 14th Avenue Enterprise/Warden Markham Centre Transit Stop Kennedy Bullock McCowan Main-Markham Wooten Cornell TO1793 Markham North South Link Corridor Public Transit Improvements Environmental Assessment 28/02/

44 5. ALTERNATIVE METHODS OF IMPROVING PUBLIC TRANSIT The previous chapter examined the potential transit demand for a rapid transit network, reflecting the direction of the York Region Transportation Master Plan. The analysis indicates that implementation of rapid transit service with the associated infrastructure will constitute an effective form of public transit improvement in the Markham North-South Link Corridor, and that ridership levels would justify dedicated rapid transit facilities in the longer term. The purpose of this chapter is to examine alternative methods of improving public transit, including rapid transit, but also a broader range of measures that would serve to improve the attractiveness of transit in the corridor. The analysis of alternative methods includes the following: Service Quality Alternatives Alternative Technologies Alternative Routings/Corridors Alternative Physical Infrastructure 5.1 TRANSIT RIDERSHIP PATTERNS Transit travel patterns and transit system usage depend on a number of factors including the origin and destinations of people travelling to/from and within the corridor, transit services levels, convenience of connections and the characteristics of competing transit services. One of the things that has become clear during this EA study, is that the Markham Link Corridor Improvements should not be just about finding the quickest way from Markham Centre to the Sheppard Subway. Improvements should also recognize that the corridor itself is a major destination. In fact, over 80% of Markham s employment is currently located in the broader study area. A final conclusion from this analysis is that even with rapid transit in the VIVA Phase 1 corridor, there is still a strong demand for transit in the Don Mills/Leslie Street corridor. Again, this a direct result of the significant employment that is located in the Highway 404/Highway 7 Commercial Node. Figure 5-1 Origin Destination Patterns for Transit Trips Crossing the North of Steeles Avenue Screenline AM Peak Period Transit Trips (Excluding GO Transit) 5.2 METHODOLOGY USED TO SCREEN AND EVAULATE ALTERANTIVE METHODS The types of alternative methods of improving public transit vary significantly, as do the range of potential environmental effects. Accordingly, criteria used for evaluating alternative methods were tailored to each type of method being assessed. Criteria for evaluating the alternatives build on the initial criteria presented in Section of the Terms of Reference. These initial criteria have been structured similar to the four objectives introduced in Chapter 3, with the addition of a fifth category reflecting cost-effectiveness and the inclusion of Smart Growth as a consideration. The five objectives are: Protect and Enhance Social Environment Protect and Enhance Natural Environment Promote Smart Growth and Economic Development Provide an Effective Transportation Service Maximize Cost-Effectiveness Specific goals were then identified to allow a comparison of the advantages and disadvantages of each alternative method relating to the each category. Specific criteria/goals for each type of alternative method are discussed in the respective sections to follow. Wherever possible, quantitative criteria have been used. 5.3 SERVICE QUALITY ALTERNATIVES Increasing the Frequency and Coverage of Services 5 In order to help develop and screen alternative methods for improving public transit, an analysis of the travel patterns of potential users of improved public transit systems was undertaken. This involved looking at future transit trips crossing the Steeles Avenue Screenline (between Don Mills Road and how they would use different transit services. Figure 5-1 provides a plot of the origin-destination patterns of transit passengers crossing the north of Steeles Avenue screenline (in either direction) for a network that includes rapid transit services in the VIVA Phase 1 (Warden Avenue) Corridor and transit priority services in the Don Mills/Leslie Street corridor. As shown, these services would attract a significant number of trips from throughout the VIVA network. A proportion of trips crossing the screenline in the southbound direction would continue to the Yonge Subway line, but clearly there is a high number of trips that start or end in the corridor. Subway/RT Surface Rapid Transit Auto Transit services in the study area are largely comprised of extensions of TTC services in the City of Toronto to serve selected employment nodes in York Region. YRT services in the study area are essentially act as neighbourhood circulator services or connections to the Sheppard Subway, in the case of the Leslie Street Services. Frequencies on most of these services are greater than 15 minutes, meaning that people experience long waits for what may only be a short trip. Another limitation of the existing transit services is that many services operate with very limited frequencies in the evening and on weekends. The VIVA Phase 1 implemented in Fall 2005 has improved the attractiveness of transit in the study area by providing high quality, high frequency service throughout the day, evenings and weekends. However, an additional method of improving transit service quality would be to increases the frequencies and hours of operation of existing transit services, in combination with some route restructuring to provide more TO1793 Markham North South Link Corridor Public Transit Improvements Environmental Assessment 28/02/


45 direct linkages between major residential areas (e.g. Markham Centre, Unionville, Cornell) and employment zones within the study area. As new road connections are made (e.g. Rodick Road, Birchmount Road), transit services could be introduced on these routes to improve service coverage Improving Transit Priority There are various methods of improving transit priority including: Minimize effects on adjacent communities Minimize effects on safety and security Enhance acceptance of transit 5 The major drawback of this option is that simply increasing the frequency and coverage of services may not be enough to make people switch to transit, since buses would still be impacted by traffic congestion. As a result, this option is not considered to be an acceptable stand alone option for improving public transit. However, service improvements would complement other transit improvements Introducing Smaller Circulator Shuttles Several communities are looking at introducing smaller buses that circulate through residential or employment areas. Essentially, these services are designed to move people from local areas to regional transit services or commuter rail services. They may also be combined with accessible transit services. These services could serve to significantly increase the coverage of transit services in many of the low-density employment areas that exist in the study area. One of the reasons why these services are not utilized more is that the costs of providing the services are similar to regular transit services because labour costs are essentially the same. The next York Region Transit 5-year service plan will feature a section on shuttle services Improved Transit Stops Facilities for transit riders in the study area are limited. Most stops do not have weather protected waiting areas and many streets do not have sidewalks, or sidewalks are discontinuous. Many development sites are also designed for automobiles and as a result getting to and from transit stops is neither convenient or safe. Therefore, one method for improving service quality would be to improve transit facilities, focusing on adding shelters and improving pedestrian connections to and from transit stops. Transit actuated signals; Constructing queue jump lanes; Implementing turn restrictions to improve traffic flow; Implementing no parking or no stopping zones in congested areas. Implementation of turn restrictions or no-stopping zones is not generally applicable to the transit corridors in the study area as most services operate on major arterials were parking is not permitted and turn restrictions would not be feasible. Application of signal priority along bus routes with the goal of improving progression for buses over a number of signals may improve travel times slightly; however, the overall gains are relatively small. At many locations in the study area, simply providing signal priority at intersections for buses would not be effective without dedicated lanes to allow buses to by-pass queues upstream of the intersection. Such lanes are referred to as Queue Jump Lanes. The implementation of Queue Jump Lanes is a key feature of the VIVA Phase 1 rapid transit service. However, in many cases these lanes could require additional right-of-way and therefore cannot be implemented without a proper environmental assessment. The construction of Queue Jump lanes, would be an effective method of improving transit service quality and is considered later in this EA Screening of Alternative Service Quality Improvements Alternative methods of improving service quality were analysed and evaluated to determine which alternatives should be carried forward for more detailed analysis. Criteria for evaluating the alternatives build on the initial criteria presented in Section of the Terms of Reference. These have been translated into individual goals responding to each of the five main objectives. The following goals were chosen to assess each service quality alternative: Protect and Enhance Social Environment: Improve accessibility to jobs for residents and employees Protect and Enhance Natural Environment: Enhance Natural Environment Promote Smart Growth and Economic Development: Consistency with York Region Transportation Master Plan Objectives Impact on land use objectives Provide an Effective Transportation Service: Improve transit user comfort Improve transit speed and travel times Improve transit service reliability Enhance continuity of transit services\ Maximize Cost-Effectiveness: Minimize operating costs Minimize capital costs In general, the evaluation is based on qualitative assessments of each goal. Table 5-1 summarizes the results of the screening process. Essentially, all of the service quality improvements will likely be implemented to varying degrees over time. In particular, VIVA Phase1 service implemented in Fall 2005 includes signal priority and enhanced transit stops/shelters. This service also includes other service quality improvements such as electronic fare payment and enhanced transit vehicles, which are key elements of Bus Rapid Transit as discussed in the next section. Elements that would form part of the preferred undertaking, which includes the implementation of bus rapid transit, include improved transit stops and transit signal priority. Each of these is assessed in more detail on a location specific basis as part of the selection of the preferred design in Chapter 8. In summary, the assessment resulted in the following transit service quality alternatives being carried forward for more detailed assessment: as part of the preferred design: Transit Priority Improved station stops Increased frequencies and circulator buses are valid methods of improving public transit, but do not require further investigation under EA. TO1793 Markham North South Link Corridor Public Transit Improvements Environmental Assessment 28/02/
46 Table 5-1 Screening of Alternatives to Improve Service Quality Objectives and Goals Increases in Frequency and Coverage Circulator Shuttles Improved Transit Stops Transit Signal Priority PROTECT AND ENHANCE SOCIAL ENVIRONMENT Improve accessibility to jobs for residents and employees + Increased coverage provides more access to jobs; increased frequency makes transit more usable for residents + Provides more direct transit service to major employers + Improved transit stops can be integrated with other pedestrian/streetscape initiatives, including improved sidewalks. + Reduces delays for transit riders Minimize effects on adjacent communities + Improves access to transit - May result in more buses within neighbourhoods + Improves access to transit + Reduces presence of large buses in neighbourhoods + Improves overall aesthetics of community ~ Minimal effects Minimize effects on safety and security + Reduces time spent waiting at shelters and therefore exposure to perceived security threats. + Minimizes walking distance to transit and therefore exposure to perceived safety/security threats + Shelters can be designed to enhance safety and security ~ Minimal or uncertain impact on safety Enhance acceptance of transit + Increased frequency increases attractiveness of transit. - May result in some buses having few passengers, which the public views negatively. + Provides more personalized service + Shelters can be designed be attractive and inviting + Positive impact if transit riders can see that they are getting an advantage over cars PROTECT AND ENHANCE NATURAL ENVIRONMENT Enhance Natural Environment + encourages shift from private autos to transit + encourages shift from private autos to transit resulting in reduced air emissions resulting in reduced air emissions ~ Minimal impact on natural environment PROMOTE SMART GROWTH AND ECONOMIC DEVELOPMENT + York TMP assumes improved transit in multiple Consistency with York Region Transportation Master Plan Objectives corridors ~ Not mentioned specifically in TMP + Consistent with Rapid Transit concept described in TMP Impact on land use objectives PROVIDE AN EFFECTIVE TRANSPORTATION SERVICE Improve transit user comfort + Supports more compact mixed use development + Can be integrated with new development + Reduces vehicle occupancy providing more room for passengers + Reduces walking times to trunk routes, a key benefit in inclement weather. + New development can be integrated with transit stops maximizing potential for transit use + Attractive stations with weather protection can significantly improve user comfort Improve transit speed and travel times + Reduces wait times + Reduces walk times ~ Minimal impact on transit speeds or times Improve transit service reliability + Reduces uncertainty of arrival time Enhance continuity of transit services MAXIMIZE COST-EFFECTIVENESS Minimize operating costs Minimize capital costs OVERALL ASSESSMENT + Generally higher frequencies and greater coverage results in more seamless transit travel - Operating costs will increase; subsidy per passenger may increase if ridership increase is lower than service increase - requires significant number of new buses Provides the greatest potential for increasing transit ridership Increases capital and operating costs Will be integral part of public transit improvements solution FURTHER INVESTIGATION NOT REQUIRED AS PART OF EA + Shuttles generally operate on fixed schedules _ Need to be coordinated with regular transit services to avoid unnecessary wait times + Improves connections from main routes to employment areas - May require additional transfer + Stations can include real-time bus time updates, improving perceived reliability ~ Minimal impact on continuity - labour costs are high in proportion to bus capacity + vehicle are more efficient to operate - increased maintenance costs for shelters - high capital costs to purchase buses + Circulator buses may off-set need to purchase regular buses Provides the most potential benefit for accessibility to employment Relies on availability of frequent and reliable transit on regular routes Increases capital and operating costs FURTHER INVESTIGATION NOT REQUIRED AS PART OF EA - enhanced shelters are more expensive than basic transit stop + overall capital requirements are low Overall costs are relatively low Has potential to improve overall image of public transit while enhancing safety and security CARRIED FORWARD FOR MORE DETAILED INVESTIGATION AS PART OF PREFERRED DESIGN ~ Minimal impact on natural environment + Consistent with Rapid Transit approach described in TMP + Improves capacity of transit and therefore development levels ~ Minimal impacts on user comfort + potential to reduce bus times, particularly if implemented in conjunction with queue jump lanes + Improved schedule adherence ~ Minimal impact on continuity + reduces bus travel times resulting in more costefficient service + may reduce number of buses required to provide service - capital costs to provide equipment, construct queue jump lanes (where required) High return on investment due to more efficient transit times Minimal impacts on environment CARRIED FORWARD FOR MORE DETAILED INVESTIGATION AS PART OF PREFERRED DESIGN 5 LEGEND: Least Responsive Most Responsive TO1793 Markham North South Link Corridor Public Transit Improvements Environmental Assessment 28/02/


 - Light Rail Transit (LRT) is a flexible transportation mode that can operate in a variety of settings.")

 this technology uses fully automated driverless trains, with fully grade-separated operations, typically on an elevated guideway.")
47 5 5.4 ALTERNATIVE TRANSIT TECHNOLOGIES Transit Technologies Considered Both York Region s Transportation Master Plan and the analysis and evaluation of alternative transportation solutions carried out during this EA have indicated implementation of surface rapid transit service with the associated infrastructure will constitute an effective form of public transit improvement in the Markham North South Link Corridor. As identified in the Terms of Reference, a comprehensive range of technologies was initially examined as part of the EA including: Conventional Bus: Conventional buses would be an integral part of any enhanced transit system, either serving to feed a rapid transit system or as an integral part of a bus-based system. Bus Rapid Transit (BRT) - Bus Rapid Transit is a flexible form of rapid transit that combines transit stations, vehicles, services, running way, and ITS elements into an integrated system. Light Rail Transit (LRT) - Light Rail Transit (LRT) is a flexible transportation mode that can operate in a variety of settings. LRT is a relatively low cost form of rail technology, usually obtaining electric power from overhead wires. Diesel Multiple Units (DMU) - This technology is a modern form of a diesel-powered rail car. DMU s are self-propelled and distinguished from current commuter rail equipment with each vehicle motorized rather than pushed or pulled by a heavy diesel engine. This type of technology would operate on conventional rail tracks, for example the GO Stouffville Line. Automated Guideway Transit (AGT) this technology uses fully automated driverless trains, with fully grade-separated operations, typically on an elevated guideway. Heavy Rail: - this technology would consist of high capacity rail cars operating in trains of two or more cars on fixed rails in separate rights-of-way (ROW). This concept is used to serve very high volume corridors with capacities requirements in the order of 30,000 to 50,000 peak hour passengers per direction. The selection of a transit technology should utilize information on the specific situation produced by an objective Environmental Assessment. The general consensus of transit professionals is that there is no specific demand volume at which there is always a single, preferred surface rapid transit mode because of the importance of relative costs, benefits and impacts in decision making. Two ridership level thresholds do, however, have important impacts on development of alternatives and mode selection: It is difficult to justify providing an exclusive lane for rapid transit if expected ridership is not higher than the number of people who would use the same road space in general traffic, i.e ,000 persons per hour on an arterial road lane or per hour on a freeway lane; Above a certain demand level (7,000-10,000 persons per hour per direction), measures permitting BRT express service, partially grade separated rail transit (i.e., LRT) or fully grade separated rail transit (i.e. subway) is required to sustain reliable, high speed service. Ridership forecasts developed for a representative rapid transit alignment in the Markham Link Corridor indicate a potential demand of between 2,500 and 3,500 persons per hour in the peak direction Screening of Transit Technologies Table 5-2 provides a summary of the screening of transit technologies with a rationale for the selection of the preferred technologies provided below. Similar to the approach used for assessing service quality alternatives, the screening of technologies involved a comparison of the responsiveness of each alternative to the five primary objectives, as measured through the identification of goals. The goals, or criteria, were generally drawn from Section of the Term of Reference, with the exception that some additional criteria were added Conventional Bus Conventional buses will continue to be used on regular transit routes throughout York Region and the City of Toronto. Conventional buses could also be used in providing transit service in transit priority corridors, such as Don Mills Road/Leslie Street in York Region and Victoria Park Avenue in the City of Toronto. Conventional buses have little impact on the natural environment, assuming no new right-of-ways are constructed. Conventional buses are also economical on a cost per vehicle basis. Conventional buses are carried forward to be considered as part of the overall plan to improve public transit services in the Markham Link corridor. However, as a technology for Bus Rapid Transit in VIVA corridors, conventional buses less desirable than other more enhanced transit vehicles Bus-Rapid Transit (BRT) Bus-rapid transit, if implemented with significant priority, if not separate running ways, is consistent with the Region s vision for rapid transit. BRT has been selected as the preferred technology for both the Highway 7 Transitway and Yonge Street Transitway, while providing for the ability to change to LRT or Subway as demand increases. Depending on the alignment and cross-section elements, BRT could have impacts on the natural environment, as highlighted in Section 5.4 on Physical Infrastructure Alternatives. Similarly, more detailed assessments are needed to consider noise impacts in sensitive areas. In terms of costs, BRT is generally considered to be very cost efficient, although costs would vary depending on the extent of the existing road infrastructure that is used for the BRT running way. Overall BRT is a promising alternative and is carried forward for more detailed evaluation as part of the preferred design Light Rail Transit (LRT) Light Rail Transit would be capable of providing the speeds, comfort levels and image that would be expected of a rapid transit system. It would be consistent with the Region s vision for rapid transit. As with BRT, the impacts of LRT on the natural environment would depend on the specific alignment and cross-section treatments. In terms of cost efficiency, LRT is generally more expensive than BRT, both in the cost of running ways and vehicle costs. Based on the ridership estimates presented in the previous chapter, the capacity of a typical LRT system is 5-10 times higher than the predicted demand in this corridor. However, some experts argue that people are more likely to use rail vehicles than buses, and this is one reason for considering LRT. TO1793 Markham North South Link Corridor Public Transit Improvements Environmental Assessment 28/02/

48 A significant factor in considering LRT in the Markham North South Corridor is network continuity. Rapid transit services in the Markham Corridor are proposed to be fully integrated with other VIVA corridors. For example, a rapid transit vehicle could start in Markham, travel across Highway 7 and continue south on the Markham North South Link, without requiring a transfer. This would not be possible if LRT was chosen for the Markham corridor as LRT is not proposed for the easterly portion of the Highway 7 corridor for the foreseeable future. The implementation of LRT is further complicated by the fact that transit corridors in the City of Toronto will be evolving over the next 20 years with the possibilities for BRT service on Don Mills, the extension of the Sheppard Subway and a possible higher order transit system in the Finch Hydro corridor in the longer term. Investing in LRT in the Markham Link corridor north of Steeles avenue would not be appropriate unless it was determined that an LRT corridor would be available south of Steeles Avenue. While LRT may not feasible in the short term, it is prudent to protect for LRT in the longer term as a surface rapid transit mode. Many cities in the United States, for example, have developed LRT lines as a means of significantly enhancing the attractiveness of public transit while avoiding the high capital costs of heavy rail transit (i.e. subways). Accordingly, LRT is carried forward for more detailed assessment as part of the preferred design for surface rapid transit Diesel Multiple Unit (DMU) DMU technology is only feasible where there is an available rail corridor. It would be possible to operate DMU s on the GO Stouffville rail corridor; however, this corridor is already well served by conventional commuter rail. There would be significant challenges to over come in overlaying DMU technology with existing GO trains, and GO does not have any current or future plans to introduce this type of technology. This option is not considered to be feasible for providing a link between Markham Centre and the Sheppard Subway Automated Guideway Transit The key feature of automated guideway transit it is fully grade-separated, typically on an elevated guideway. Consequently, the impacts of this technology on noise and visual intrusion are greater than surface modes. The capital costs for automated guideway transit are generally greater than BRT or LRT technologies. This technology is not being considered in any of the other YRTP corridors or City of Toronto corridors and would therefore present challenges with respect to system integration. It is not carried forward for further evaluation Heavy Rail (Subway) Given the anticipated demand for rapid transit in the corridor, it would be difficult to justify the high capacity and high costs of heavy rail. Heavy rail would only make sense if it was part of an extension of the Sheppard Subway line, which if extended, would be extended to Scarborough City Centre. Heavy rail could also have impacts on the natural environment due to the extensive construction activities that would occur. For all of these reasons, heavy rail is not carried forward to further evaluation Description of Preferred Technologies The preferred technology for the Markham N-S Corridor is Bus Rapid Transit or, in the longer term, Light Rail Transit (LRT). These technologies are similar in most of their characteristics, with the exception of vehicles and running ways. The following is a description of BRT and LRT as surface rapid transit modes. Transitway: BRT and LRT can operate mixed in with general traffic, and/or exclusive lanes, and/or segregated transitways. The operating speed, capacity and reliability increases with the degree of segregation from general traffic and grade separation. Vehicle Technology: BRT may use either conventional buses or specialized rubber-tired BRT vehicles. Available propulsion options range from conventional diesel to clean diesel and CNG to turbine-electric hybrids and all-electric trolleys. Low-floor, multiple widedoor designs and optional guidance into stations speeds boarding and alighting thus reducing station dwell time. Vehicle lengths range from 12.2 metres (single unit) to 18 metres 25.5 metre(s) bi-articulated units are also used in some systems. Typical passenger capacities are 60 (single unit) to over 110 (bi-articulated unit) standing and seated passengers per vehicle. LRT vehicles range from all-electric to diesel propelled, high and low-floor car designs. Lengths vary from 14 metres (single unit) to 45 metres (biarticulated unit). Typical passenger capacities are approximately 75 (single unit) to as high as 200 (bi-articulated unit) standing and seated passengers per car. Vehicles can be coupled to form up to 3 or 4 car trains depending on vehicle length and demand. Direct, no-step station platform to vehicle boarding and alighting through multiple wide doors, often on both sides of cars, can be provided. System Capacity: Segregated BRT service with station bypass lanes is capable of handling over 12,000 persons per peak hour per direction, depending on the degree of segregation from other traffic and grade separation. The busiest BRT segment in North America, in downtown Ottawa, carries approximately 10,000 passengers per hour in the peak direction during the single peak hour. The practical capacity without overtaking capability at stations is in the 8,000 passenger per hour range. LRT systems are capable of carrying up to 18,000 persons per peak hour per direction, depending on the degree of segregation from other traffic and grade separation. Approximately, 10,000 people per hour (peak hour, peak direction) use the busiest light rail segments in North America in downtown Calgary and on the Green Line in downtown Boston. Intelligent Transportation Systems: Contemporary BRT systems usually incorporate an Intelligent Transportation System (ITS) with an automatic vehicle location module that supports transit signal priority at intersections and real-time passenger information at stations, on-board and at home. LRT systems have a signal system to control train operations, provide data and voice communications and enhance safety and security. Contemporary LRT systems also have ITS capabilities to provide transit signal priority at intersections and real-time passenger information at stations, on-board and at home. Stops or Stations: These generally comprise platforms varying in length from m with shelters and passenger amenities. They are generally designed to be accessible by the disabled and may also include support facilities such as park and ride lots or passenger pick-up and drop-off areas. Station spacing is approximately km in built-up portions of corridors increasing to 2 km in lower density areas. 5 TO1793 Markham North South Link Corridor Public Transit Improvements Environmental Assessment 28/02/
49 5 Table 5-2 Preliminary Screening of Transit Technologies Objectives and Goals Conventional Bus Bus Rapid Transit Light Rail Transit Automated Guideway Heavy Rail Diesel Multiple Unit PROTECT AND ENHANCE SOCIAL ENVIRONMENT Minimize effects on adjacent communities - some noise impacts when + effects generally confined to + effects generally confined to LRT - Elevated guideway may be operating within residential areas BRT corridor corridor visually intrusive and may have + Impacts are similar to existing noise impacts + Effects are minimal if below grade situation Enhance acceptance of transit - no change from status quo PROTECT AND ENHANCE NATURAL ENVIRONMENT ~ impacts similar to current Enhance Natural Environment situation PROMOTE SMART GROWTH AND ECONOMIC DEVELOPMENT Consistency with York Region Transportation Master Plan Objectives Impact on land use objectives + consistent with need to expand transit in multiple corridors - no significant positive impact + can be marketed as distinct service; vehicles are more attractive than conventional buses + reduces auto emissions by increasing transit use + consistent with proposed implementation of rapid transit + provides service levels consistent with promoting more compact development; creates permanent corridor to attract investment + can be marketed as distinct service; vehicles are more attractive than conventional buses + reduces auto emissions by increasing transit use; produces minimal local emissions + consistent with proposed implementation of rapid transit + Also investigated by Town of Markham for Hydro corridor + provides service levels consistent with promoting more compact development; creates permanent corridor to attract investment + grade separation provides more direct competition to cars + reduces auto emissions by increasing transit use; produces minimal local emissions - not explicitly considered in TMP + can be integrated with development - may sterilize some lands + grade separation provides more direct competition to cars + reduces auto emissions by increasing transit use; produces minimal local emissions - TMP discusses heavy rail for Yonge Street, but not other corridors + provides service levels consistent with promoting more compact development; creates permanent corridor to attract investment + Existing rail corridor is largely industrial uses, therefore impacts are minimal + could be marketed as distinct service + utilizes existing rail corridors - increases diesel emissions - not explicitly considered in TMP - difficult to structure land use around rail corridor; not suitable for residential development PROVIDE AN EFFECTIVE TRANSPORTATION SERVICE Improve transit user comfort + acceptable user comfort + vehicles are design for more comfort Improve transit speed and travel times ~ impact depends on degree of + consistent with surface rapid separation from regular traffic transit concept Improve transit service reliability - no positive impact + dedicated lanes improve reliability; can be combined with real-time transit info Enhance continuity of transit services + fully compatible with existing transit technologies + services can be interlined to provide seamless travel MAXIMIZE COST-EFFECTIVENESS Minimize operating costs - may require more vehicles to provide same capacity as higher order modes + higher capacity vehicles may reduce fleet requirements + vehicles are quiet and comfortable + consistent with surface rapid transit concept + dedicated lanes improve reliability; can be combined with real-time transit info - would require transfer to/from bus if LRT not provided on Highway 7 and in City of Toronto - requires separate maintenance capability + larger capacity vehicles reduce fleet requirements + vehicles are quiet and comfortable + provides maximum user comfort + allows for maximum speeds due +allows for maximum speeds due to grade separation to grade separation + automated technology ensures schedule adherence - would require transfer to/from bus + technology ensures schedule adherence - only feasible if heavy rail is extended from existing subway + vehicles are quiet and comfortable + improved times for trips following corridor - may be impacted by other rail vehicles; requires dedicated track to ensure reliability - requires transfer to/from buses + connection already established at Kennedy Station on Scarborough RT Minimize capital costs OVERALL ASSESSMENT - capital costs are limited to vehicle purchases Will be integral part of public transit improvements solution CARRIED FORWARD FOR MORE DETAILED INVESTIGATION - vehicles are more expensive than conventional buses Has potential to significantly improve public transit with minimal or positive impacts to social and natural environments CARRIED FORWARD FOR MORE DETAILED INVESTIGATION - LRT vehicles are more expensive than conventional buses; requires construction of LRT tracks Has potential to significantly improve public transit with minimal or positive impacts to social and natural environments CARRIED FORWARD FOR MORE DETAILED INVESTIGATION - high capital costs due to elevated/grade separated transitway Would represent a significant departure from current directions in York Region and City of Toronto NOT CARRIED FORWARD - requires tunneling or elevated transitway Cannot be justified given current travel demand in corridor NOT CARRIED FORWARD - likely requires separate track + can use existing GO Rail stations Numerous constraints are imposed by having to follow existing rail corridor. NOT CARRIED FORWARD LEGEND: Least Responsive Most Responsive TO1793 Markham North South Link Corridor Public Transit Improvements Environmental Assessment 28/02/

50 Off Board Fare Collection: Prepaid fares are required to reduce dwell times at stations and for passenger convenience. Options include fare gates and fare-paid, segregated platforms in stations and proof of payment systems using passes, smart cards or tickets. Capital Costs: Total costs, including transitways, stations, ITS, vehicles, fare collection system, etc. range from $0.6m $3.0m per two-way km for on-street BRT in mixed traffic using existing lanes to $15m - $30m for a partially segregated transitway with mostly at-grade intersections. Costs can increase to $60m+ per km for fully segregated, grade- separated segments. Implementation costs depend on the volumes to be carried, system complexity, the degree of segregation from general traffic and the type and degree of grade separation (e.g., at grade, in subway or elevated). Total costs for LRT including stations, ITS, vehicles, fare collection system, etc. range from $5M per km for single track diesel lines using former rail rights-of-way to $40M per double track km for partially segregated at-grade, electrified lines with mostly at-grade intersections. Fully segregated, grade separated electrified transitways can cost up to $100m per double track km. Implementation costs depend on volumes to be carried, system complexity, degree of segregation from general traffic and the degree and type of grade separation (e.g., at grade, underground or elevated). 5.5 TRANSIT CORRIDOR ALTERNATIVES The approach used to develop and evaluate alternative locations for the undertaking i.e. routing alternatives follows a two-staged approach. The first stage involved an examination of all potential routes in the study area and screening out those that are not likely to satisfy the overall objective of improving public transit, or have fatal flaws. The second stage involves looking at each of the short listed routes in more detail using quantitative criteria. The process and results are described in the following sections. An initial screening process was applied to these routes to eliminate routes that were clearly not suitable for facilitating improved transit, or were less acceptable in terms of social, economic or natural environment impacts. A key factor in selecting routes for further consideration was their potential to significantly improve transit ridership to/from and within the study area. Routing alternatives were evaluated using a qualitative approach. The assessment of each route at this stage draws on the preliminary description of existing conditions in Chapter 2. Each route was compared in terms of its ability to satisfy the five main objectives. For each objective, a number of indicators were identified, drawing on the list of potential environmental effects described in Section 5.5 of the Terms of Reference. Not all indicators are discussed or quantified for each route, as the intent at this stage is to simply eliminate routes that do not meet the basic criteria for more detailed assessment. It is also noted that at this stage in the evaluation, the exact configuration of rapid transit on any of these routes was not detailed. In general, it was assumed that any roads north of Steeles Avenue would be widened to accommodate the rapid transit in dedicated lanes. Where roads are planned to be widened, and could potentially be used for rapid transit, this is noted. For routes south of Steeles Avenue, it was assumed that widening would occur only if undertaken by the City of Toronto. It is generally policy of the City of Toronto not to widen roads for the sole purpose of adding road capacity. It is also noted that this initial screening examines routes with in the City of Toronto. As noted in Section 5.5.2, York Region does not have authority to construct new facilities in the City of Toronto. As a result, the evaluation of routes in the City of Toronto is primarily to help establish which corridors best meet the objective of providing a connection to the Sheppard Subway. Figure 5-2 Potential Routes for Public Transit Improvements Initial Screening of Transit Corridors The York Region Transportation Master Plan considered a number of options for providing a connection between Markham Centre and the Sheppard Subway but did not conduct a detailed screening of potential options. At the outset of the current EA, all possible routes/corridors that could be considered for public transit improvements, while fulfilling the goal of providing a link between Markham Centre and the Sheppard subway, or its extensions, were identified. These are illustrated in Figure 5-2. Table 5-3 provides a summary of the initial screening of each alternative route. The table is broken down by the three categories of routes, north of Steeles Avenue, South of Steeles Avenue and East-West routes. TO1793 Markham North South Link Corridor Public Transit Improvements Environmental Assessment 28/02/
51 5 Objectives and Goals PROTECT AND ENHANCE SOCIAL ENVIRONMENT Minimize adverse noise and vibration effects Minimize adverse effects on cultural resources Minimize disruption of community vistas and adverse effects on street and neighbourhood aesthetics PROTECT NATURAL ENVIRONMENT Potential to utilize existing corridors Minimize impact on Wetlands and Watercourses PROMOTE SMART GROWTH/ECONOMIC DEVELOPMENT Maximize access to planned growth and intensification areas, including Markham Centre Potential to stimulate more transit-oriented development Consistency with Official Plan objectives PROVIDE AN EFFECTIVE TRANSPORTATION SERVICE Maximize ridership potential and relationship to existing and future travel patterns Maximize connectivity to existing and future transit Serves employment nodes Serves major residential areas Maximize access to inter-modal terminals Consistency with York Region Transportation Master Plan Table 5-3a Screening of Rapid Transit Routing Alternatives North-South Alternatives Routes North of Steeles Avenue Route Segment Leslie Street/Don Mills Highway 404 Woodbine Rodick Warden Birchmount Kennedy Stouffville GO Line McCowan potential impacts on residential areas S. of 407 Rapid transit could be developed as part of planned widening. minimal community impacts potential disruption/ displacement of properties the current R.O.W width would not permit four traffic lanes plus 2 rapid transit lanes; significant impacts on adjacent properties would occur with road widening. few impacts due to proximity of adjacent uses need to avoid impacts on cemetery south of Denison potential property impacts south of 14 tth Av potential noise impacts on adjacent residences potential disruption/ displacement of properties small section of residential south of 14 th Ave would be impacted potential noise impacts on adjacent residences potential disruption/ displacement of properties minimal impacts if existing R.O.W is used minimal impacts as corridor is already developed would involve new water crossings may impact regional storm floodplain and valley corridor of the Rouge River Rapid transit could be developed as part of planned widening. impacts due to road widening Rapid transit could be developed as part of planned widening. limited impacts as this is existing corridor Rapid transit could be developed as part of planned widening. Does not serve Markham Centre directly much of the corridor between Steeles Avenue and Highway 407 is already developed with low density uses does not serve Markham Centre would not stimulate TOD potentially serves Markham Centre provides access to high number of employers provides reasonable access to Markham Centre much of the corridor consists of low density employment uses and significant land use intensification is not planned for serves Markham Centre directly several remaining land parcels exist for transitsupportive development serves Markham Centre - some potential to influence land use serves Markham Centre limited potential to influence land uses limited potential to increase densities outside of station areas does not serve Markham Centre limited potential to influence land uses does not serve largest employers (IBM, American Express), but serves major commercial node (Highway 404/7) consistent with Toronto Official Plan routes not identified in York TMP or MTPS suitable for longer distance trips only does not serve Unionville GO not consistent with York TMP, MTPS identified in York TMP and MTPS serves IBM and Rodick Road employment lands could not be implemented until crossing of CN York Subdivision is completed (currently planned for 2007/08) serves IBM, Amex and other major employers does not connect with Toronto O.P. routes south of Steeles Avenue misses most of employment area south of 407 does not connect to Toronto O.P. routes good connections to Unionville GO and Markham Centre does not serve major employers good connections to Unionville GO and Markham Centre does not serve major employers not consistent with York TMP, MTPS, Toronto O.P. does not serve major employment areas TO1793 Markham North South Link Corridor Public Transit Improvements Environmental Assessment 28/02/
52 Objectives and Goals MAXIMIZE COST- EFFECTIVENESS OF RAPID TRANSIT Minimize property impacts and acquisition Route Segment Leslie Street/Don Mills Highway 404 Woodbine Rodick Warden Birchmount Kennedy Stouffville GO Line McCowan costs similar to other arterial routes potentially high construction costs potentially high property acquisition costs high capital cost for road widening, property acquisition potential cost savings due to planned widening would require modified structure at Hwy 407 potentially high property acquisition costs costs could be high if RT cannot be accommodated in existing ROW potentially high property acquisition costs Minimize impact on structures OVERALL ASSESSMENT CARRIED FORWARD FOR MORE DETIALED INVESTIGATION Does not meet objectives for rapid transit service LEGEND: Least Responsive Most Responsive CARRIED Significant FORWARD FOR with MORE DETIALED INVESTIGATION conflicts corridor s primary function of hydro transmission CARRIED FORWARD FOR MORE DETIALED INVESTIGATION Local residential Misses major nature of corridor not employment areas suitable for rapid transit O.P. Official Plan, HOV High Occupancy Vehicle, TMP Transportation Master Plan, MTPS Markham Transportation Planning Study, RT Rapid Transit, TOD Transit-Oriented Development Significant duplication with GO Rail Service; not compatible with GO Transit s objectives for corridor Does not meet objectives of connecting Markham Centre with Sheppard Subway 5 Objectives and Goals PROTECT AND ENHANCE SOCIAL ENVIRONMENT Minimize adverse noise and vibration effects (proximity to sensitive receivers) Minimize adverse effects on cultural resources Minimize disruption of community vistas and adverse effects on street and neighbourhood aesthetics PROTECT NATURAL ENVIRONMENT Potential to utilize existing corridors Minimize impact on Wetlands and Leslie Street/Don Mills potential impacts on residential areas S. of 407 limited impacts as corridor is fully developed Highway 404/Gordon Baker least community impacts Table 5-3b Screening of Rapid Transit Routing Alternatives North-South Alternatives Routes South of Steeles Avenue Route Segment Victoria Park Warden Birchmount Kennedy Stouffville GO Line McCowan potential disruption/ displacement of properties potential impacts on adjacent residential significant impacts on adjacent residential significant impacts on adjacent residential potential impacts on adjacent residential, industrial significant impacts on adjacent residential limited impacts as corridor is fully developed limited impacts as corridor is fully developed limited impacts as corridor is fully developed limited impacts as corridor is fully developed limited impacts as corridor is fully developed limited impacts as corridor is fully developed limited impacts as corridor is fully developed Watercourses TO1793 Markham North South Link Corridor Public Transit Improvements Environmental Assessment 28/02/
53 Objectives and Goals PROMOTE SMART GROWTH/ECONOMIC DEVELOPMENT Maximize access to planned growth and intensification areas, including Markham Centre Potential to stimulate more transit-oriented development Consistency with Official Plan objectives Leslie Street/Don Mills potential to enhance Don Mills Area Highway 404/Gordon Baker serves Gordon Baker Business Park - moderate potential to influence land uses Route Segment Victoria Park Warden Birchmount Kennedy Stouffville GO Line McCowan provides moderate potential for intensification stable residential difficult to change stable residential difficult to change stable residential difficult to chang moderate potential to influence Kennedy Rd industrial area stable residential difficult to change 5 PROVIDE AN EFFECTIVE TRANSPORTATION SERVICE Maximize ridership potential and relationship to existing and future travel patterns Maximize connectivity to existing and future transit Serves employment nodes Serves major residential areas Maximize access to inter-modal terminals Consistency with York Region potential to utilize exiting HOV corridor consistent with Toronto O.P. routes potential for integration with Don Valley Corridor study alternatives reasonably direct access to Sheppard Subway does not serve Unionville GO not consistent with York TMP, MTPS Identified as transit priority corridor in Toronto O.P. does not serve major employers - not identified in Toronto O.P. Attractiveness may change if Sheppard Subway is extended does not serve major employers - not identified in Toronto O.P. does not serve major employers not identified in Toronto O.P. difficult to connect to Sheppard Subway if it is not extended does not serve major employers corridor already served by GO difficult to connect to existing Sheppard Subway if it is not extended does not serve major employers difficult to connect to Sheppard Subway if it is not extended Transportation Master Plan MAXIMIZE COST- EFFECTIVENESS OF RAPID TRANSIT Minimize property impacts and acquisition costs similar to other arterial routes potentially high construction costs potentially high property acquisition costs potentially high property acquisition costs cost of road widening potentially high property acquisition costs costs could be high if RT cannot be accommodated in existing ROW potentially high property acquisition costs Minimize impact on structures OVERALL ASSESSMENT CARRIED FORWARD FOR MORE DETIALED INVESTIGATION CARRIED FORWARD FOR MORE DETIALED INVESTIGATION CARRIED FORWARD FOR MORE DETIALED INVESTIGATION Lack of Toronto O.P designation combined with potential residential impacts is a challenge Local residential nature of corridor not suitable for rapid transit Misses major employment areas Significant duplication with GO Rail Service; not compatible with GO Transit s objectives for corridor Does not meet objectives of connecting Markham Centre with Sheppard Subway LEGEND: Least Responsive Most Responsive O.P. Official Plan, HOV High Occupancy Vehicle, TMP Transportation Master Plan, MTPS Markham Transportation Planning Study, RT Rapid Transit, TOD Transit-Oriented Development TO1793 Markham North South Link Corridor Public Transit Improvements Environmental Assessment 28/02/
54 Objectives and Goals PROTECT AND ENHANCE SOCIAL ENVIRONMENT Table 5-3c Screening of Rapid Transit Routing Alternatives East-West Alternatives Routes South of Steeles Avenue Route Segment Highway 7* Steeles Avenue Denison St Finch Hydro Corridor Finch Avenue adjacent land uses are set back from corridor houses on south side of street limit potential to widen for transit primarily commercial/industrial uses - most business have parking abutting roadway displacement of informal uses, informal greenspace - potential for visual intrusion potential for community impacts, traffic infiltration Minimize adverse noise and vibration effects (proximity to sensitive receivers) Minimize adverse effects on cultural resources Minimize disruption of community vistas and adverse effects on street and neighbourhood aesthetics PROTECT NATURAL ENVIRONMENT Potential to utilize existing corridors limited impacts as corridor is fully developed limited impacts as corridor is fully developed limited impacts as corridor is fully developed limited impacts as corridor is fully developed limited impacts as corridor is fully developed Minimize impact on Wetlands and Watercourses PROMOTE SMART GROWTH/ECONOMIC DEVELOPMENT Maximize access to planned growth and intensification areas, including Markham Centre Potential to stimulate more transit-oriented development Consistency with Official Plan objectives significant opportunities for intensifying land uses corridor is largely built-out and difficult to influence -City of Toronto does not have plans for rapid transit on Steeles Avenue may be opportunities for intensifying some properties, but employment lands are essentially stable provides moderate potential for intensification stable residential difficult to change 5 PROVIDE AN EFFECTIVE TRANSPORTATION SERVICE Maximize ridership potential and relationship to existing and future travel patterns Maximize connectivity to existing and future transit Serves employment nodes Serves major residential areas Maximize access to inter-modal terminals.consistent with Region s rapid transit strategy serves major employment areas difficult to introduce into existing R.O.W. due to traffic congestion serves major concentration of employment, provides access for employees potentially increases walking distances for riders consistent with Toronto O.P. provides direct access to Seneca consistent with Toronto O.P. ( transit priority route only) Consistency with York Region Transportation Master Plan MAXIMIZE COST-EFFECTIVENESS OF RAPID TRANSIT Minimize property impacts and acquisition Minimize impact on structures OVERALL ASSESSMENT costs similar to other arterial routes potentially high construction costs R.O.W. is relatively narrow, may require widening leasing costs could be high high capital cost for new structures potentially high property acquisition costs Not suitable for North-South Service; will be part of integrated Region-wide service Significant challenges with adjacent properties; road configuration at Woodbine/404; would require coordination with City of Toronto CARRIED FORWARD FOR MORE DETAILED INVESTIGATION Ideally should be developed as part of longer service in hydrocorridor; would need to be developed with City of Toronto May provide interim connector to Seneca College; any physical improvements would need to be developed with City of Toronto * Highway 7 is subject to a separate EA process. It is being evaluated here in terms of its ability to form part of the north-south service. LEGEND: Least Responsive Most Responsive O.P. Official Plan, HOV High Occupancy Vehicle, TMP Transportation Master Plan, MTPS Markham Transportation Planning Study, RT Rapid Transit, TOD Transit-Oriented Development TO1793 Markham North South Link Corridor Public Transit Improvements Environmental Assessment 28/02/

55 One route that has been considered in previous studies, but was not assessed in detail in this EA is the north-south Hydro corridor running west of Warden Avenue. Since previous studies were completed, Ontario Power Generation has indicated their intention to construct new transmission lines in this corridor north of 14 th Avenue. They also indicated that the likelihood of granting use of this corridor for rapid transit is very low, given the already constrained width of this corridor. One of the reasons for this is that OPG requires access for maintenance of the transmission towers. In addition to hydro facilities, Enbridge Gas is planning to construct a new north-south gas line in the hydro corridor, further limiting its use for rapid transit. For all of these reasons, this route was eliminated from further consideration. Routes considered and routes carried forward are illustrated on Figure 5-3. Based on the evaluation, the following corridors have the potential to facilitate improved public transit service. example, York Region services could access the Finch Hydro corridor via Victoria Park or Warden Avenue, travel eastward to Don Mills Road and then southbound to Don Mills Station. Since York Region has no authority to construct infrastructure in the City of Toronto, and the City of Toronto is not a co-proponent in this EA, it is not appropriate to identify ultimate alignments and designs for rapid transit services in the City of Toronto. The preferred strategy is therefore to utilize the VIVA Phase 1 alignment and stops until future rapid transit corridors south of Steeles Avenue are more fully defined and developed. At such time, the alignment for the North-South Rapid transit service would be reviewed and adjusted if appropriate. As discussed in Section 5.6, decisions on the timing of infrastructure south of Steeles Avenue may also affect the timing of investments in York Region. Figure 5-3 Short Listed Transitway Corridor Options 5 A corridor extending from Don Mills Subway Station to the Highway 404/Highway 7 Business Park Area, with connections to east-west transit services; A corridor extending from Woodbine Avenue and Highway 7 to the Sheppard Subway, with east-west connections at the north and south ends; A corridor extending from Markham Centre (Highway 7/Warden) to the Sheppard Subway via Warden Avenue and Victoria Park Avenue; Routing Options in the City of Toronto As discussed in Section and illustrated on Figure 2-9, there are several corridors in the City of Toronto that have been identified for rapid transit or priority transit. These corridors will be developed over the next years, and may evolve if the Sheppard Subway is extended to Victoria Park or eventually to Scarborough Civic Centre. As part of this EA, each of these potential corridors in the City of Toronto were assessed in terms of their suitability for providing improved public transit, and more specifically a link to the Sheppard Subway. In selecting a preferred corridor, several factors were considered: Unless there is a single GTA Transit Authority, it is likely that closed door operating policies will remain in effect for York Region Transit services in the City of Toronto. In this case, the best routing option is one that provides the fastest connection to Don Mills Station, while providing service to major employment destinations in the City of Toronto (to drop passengers off in the southbound direction and pick them up in the northbound direction). The VIVA Phase 1 route has been designed with these factors in mind. In the longer term, it would be desirable to integrate York Region rapid transit services with rapid transit corridors in the City of Toronto. For Detailed Assessment of Preferred Corridors Based on the screening of potential corridors in Section 5.4.1, three potential corridors have been identified for more detailed analyses as shown on Figure 5-3. These corridors should be considered as representative alternatives only. For example, the Woodbine Corridor could utilize Gordon Baker Road, Highway 404 or potentially Victoria Park Avenue south of Steeles Avenue. The Warden Avenue Corridor could also utilize different alignments to get east to Victoria Park Avenue, including Denison Street or Esna Park Drive. In the following sections, each corridor is discussed in terms of the following: Accessibly Impacts Impacts on Natural Environment Land Use Impacts Transit Ridership Potential Compatibility with other planned transportation improvements Costs Based on the review of existing conditions, these are considered to be the categories where routing options may differ significantly, and hence, detailed discussion is warranted. The evaluation of also considered impacts on other criteria such as cultural resources, and discussion is provided in Table 5-7. The results of the assessment are then used to evaluate each corridor according to specific objectives and goals as described in Section Don Mills Rd/Leslie Street Woodbine/Highway 404 Warden/Victoria Park Accessibility Impacts Potential transit improvements should be located so as to maximize access to existing and future population and employment. Figure 5-4 provides an overview of existing (2001) urban densities in the study corridor while Figure 5-5 illustrates projected future urban densities. As shown, urban densities are relatively uniform throughout the study area. Higher densities TO1793 Markham North South Link Corridor Public Transit Improvements Environmental Assessment 28/02/
 Figure 5-5 Gross Urban Density (2021) In addition to absolute population and employment, it is desirable to connect major employment nodes with transit.")

56 are present in the Sheppard Subway/Consumers Road area, the Beaver Creek area and, in the future, the Markham Centre area. Figure 5-4 Gross Urban Density (2001) Figure 5-5 Gross Urban Density (2021) In addition to absolute population and employment, it is desirable to connect major employment nodes with transit. These include major employers or educational institutions where there is a potential to implement on-site TDM programs to encourage transit usage, or in the case of post-secondary institutions, there is an inherent potential for transit usage. These nodes are highlighted on Figure 5-6. Figure 5-7 summarizes the population and employment that would be within 500 m and 1000m of each representative alignment. As shown, the Don Mills/Leslie Corridor has the highest density of population along its length, but the lowest density of employment (mainly concentrated at the north end of the line). Between 2001 and 2021, employment in the Warden corridor (<1000 m) is expected to grow by 26% while population is expected to grow by 12%. In the longer term, the Warden corridor would contain the highest number of residents and jobs. 5 Figure 5-8 presents a breakdown of population and employment by corridor, distinguishing between the north and south study areas. In 2001, the Don Mills/Leslie corridor had the highest concentration of employment north of Steeles Avenue. However, this will be exceeded by the Warden corridor by Overall, the Warden Avenue corridor has the highest combined concentration of population and employment. In the southern part of the study area, population is fairly evenly distributed by corridor with Victoria Park having the highest combined population and employment within 1000 m Impacts on Natural Environment None of the short-listed corridors would cross or impact any ESA s, provincially significant wetlands or Life Sciences Sites, which are located at the Unionville Marsh Area (See Figure 2-3 shown previously). Similarly, all of the routes pass through primarily urbanized areas, and therefore the impacts on habitat communities are similar for all routes. One area where the routes may differ in terms of environmental impacts is in the number of watercourses crossed. Accordingly, Table 5-4 provides a summary of the number of watercourses along each corridor. Table 5-4 Number of Watercourse by Corridor Don Mills/Leslie Woodbine Warden Cold Water Cool Water - Beaver Creek Rouge River Warm Water German Mills Creek German Mills Creek - TO1793 Markham North South Link Corridor Public Transit Improvements Environmental Assessment 28/02/
 (North and South Study Areas) 5 Allstate ParkwayB usiness Area 2001 Land Use 100,000 90,000 80,000 70,000 60,000 50,000 40,000 30,000 20,000 10,000 0 Population Employment")
57 Figure 5-6 Significant Employment Nodes Figure 5-7 Population and Employment in Proximity to Transit Corridors (Markham and Toronto Study Areas) Figure 5-8 Population and Employment in Proximity to Transit Corridors (2021) (North and South Study Areas) 5 Allstate ParkwayB usiness Area 2001 Land Use 100,000 90,000 80,000 70,000 60,000 50,000 40,000 30,000 20,000 10,000 0 Population Employment Population Employment Within 500 m to 1000 m Within 500 m Population Employment Markham Study Area 100,000 90,000 80,000 70,000 60,000 50,000 40,000 30,000 20,000 10, Employment <1000m Population <1000 m Don Mills/Leslie Street Woodbine Avenue Warden Avenue Don Mills/Leslie Street Woodbine/Highway 404 Warden Avenue/Victoria Park 2021 Land Use 100,000 90,000 80,000 70,000 60,000 50,000 40,000 30,000 20,000 10,000 0 Population Employment Population Employment Don Mills/Leslie Street Woodbine/Highway 404 Within 500 m to 1000 m Within 500 m Population Employment Warden Avenue/Victoria Park Toronto Study Area 100,000 90,000 80,000 70,000 60,000 50,000 40,000 30,000 20,000 10, Don Mills/ Leslie Street Hwy 404/ Gordon Baker Note: See Figure 5-3 for location of corridors Victoria Park Avenue Employment <1000m Population <1000 m Warden Avenue Note: See Figure 5-3 for location of corridors TO1793 Markham North South Link Corridor Public Transit Improvements Environmental Assessment 28/02/
58 Land Use Impacts The potential for transit to influence land use is a key planning goal of both York Region and City of Toronto. Ideally, a new rapid transit line should be located so as to maximize development potential. Figures 2-2 and Figure 5-6 shown previously provided an indication of the general land use in the study corridors. The following observations can be made on each of the potential transit corridors: Don Mills/Leslie Corridor includes large portions of lower density residential development north and south of Steeles Avenue, which is not expected to change in the next 20 years. Some potential for intensifying employment development exists in the Commerce Valley Drive area. Woodbine/404 Lands north of Steeles Avenue are largely commercial and are not planned for significant residential development. Opportunities to intensify employment development exist, specifically in the area just south of Highway 407. Warden Avenue In addition to Markham Centre, there are opportunities to develop or redevelop major blocks of land for more transit-supportive uses Ridership Potential For each of the three general corridors, the York Region Travel Demand Forecasting Model (described previously in Chapter 4) was used to estimate the number of transit riders that would use each line. In each case, the transit lines were coded as full bus rapid transit lines with equal speed and headway characteristics. Lines were also connected to the Highway 7 transitway in the north and the Sheppard Subway in the south. Actual line routings differs slightly from those shown on Figure 5-3; in order to equally compare corridors, lines were routed to the Sheppard Subway at Don Mills in the south portion of the study area. Ridership statistics for each line are summarized in Table 5-4. Consistent with the population and employment accessibility measures quantified in the previous section, an alignment starting in the Warden and Highway 7 area has the greatest total ridership potential as a single rapid transit line. Peak point volumes would be slightly higher for a Don Mills alignment, but this volume occurs just north of Steeles Avenue and tapers off significantly further north. Compared to the Warden and Don Mills alignments, a Woodbine Avenue alignment does not perform as well, primarily because it does not provide direct service to either the Highway 404/7 commercial node or Markham Centre. Table 5-5 Peak Period Ridership for Selected Lines in 2021 Leslie/Don Mills Woodbine/Gordon Baker/Finch/Don Mills Warden Avenue/Gordon Baker/Finch/Don Mills (Quick Start Alignment) Parameter Line Length 8.2 km 9.0 km 13.0 km Maximum Load SB 3,500 1,000 3,000 NB 2,100 1,000 1,600 Total Boardings 4,424 1,804 4,671 Boardings per kilometre Assumptions: 1) All lines terminate at Highway 7, with transfer to Hwy 7 transitway 2) All lines coded at 2 minute headway 3) Closed door policy in City of Toronto Compatibility with Other Improvements Potential transit improvements that have an impact on the selection of a corridor for north-south transit include the following: Through the Don Valley Corridor Transportation Master Plan, the City of Toronto has identified Don Mills Road as a potential corridor for Bus Rapid Transit. Victoria Park has been identified as a priority transit corridor. GO Transit is planning to introduce bus rapid transit in the Highway 407 corridor and potentially the Highway 404 corridor. It is expected that the Highway 404 service would include a stop at Don Mills Station on the Sheppard Subway. Table 5-5 provides a discussion of the compatibility of each of the three corridors with other planned improvements Costs Capital costs are dependant on the length of alignment, amount of property required and number of structures that need to be modified. The latter two cost factors are in turn dependent on the configuration of the surface rapid transit system and the degree of separation from other traffic. For example, providing for a median transitway by widening an existing roadway would be considerably more expensive than designating an existing lane for transit. These alternative methods, and their relative cost implications are discussed in Section 5.6. A major distinction between the three alternative routes is that Woodbine Avenue is already a six lane facility, whereas Leslie Street and Warden Avenue are 4/5 lane facilities. All corridors are of similar width: m R.O.W. Therefore, if lane widening is required, it will be more expensive to widen Woodbine Avenue to property acquisition costs. Proposed BRT in Don Mills corridor to Steeles Avenue Proposed Transit Priority corridor in Victoria Park to Steeles Avenue Proposed Highway 407 GO BRT Potential Highway 404 GO BRT Table 5-6 Compatibility of Alternative Corridors with other Improvements Don Mills/Leslie Woodbine Warden Avenue Extension of improved transit north of Steeles would be highly compatible Services on Don Mills may overlap with Victoria Park Connection at Leslie/Highway 407 is possible Services follow similar alignment, but serve different markets Woodbine corridor could be connected to Don Mills south of Steeles Woodbine corridor could be connected to Victoria Park south of Steeles Connection at Woodbine/Highway 407 is possible Services follow similar alignment, but serve different markets Summary and Evaluation of Route Alternatives Warden corridor could be connected to Don Mills south of Steeles Warden corridor could be connected to Victoria Park south of Steeles Services could be integrated at Unionville Station Corridors are generally distinct The preceding quantitative and qualitative analyses were used to inform an overall evaluation of each routing alternative. The evaluation follows the approach of other alternative methods in that it is structured around five objectives, for which a number of specific goals are identified. These objectives, goals and the resulting assessment of alternatives are summarized in Table TO1793 Markham North South Link Corridor Public Transit Improvements Environmental Assessment 28/02/
59 5 Table 5-7 Evaluation of Routing Alternatives Objectives and Goals Don Mills/Leslie Street Woodbine Avenue/Highway 404 Warden Avenue/Victoria Park Avenue PROTECT AND ENHANCE SOCIAL ENVIRONMENT Minimize adverse noise and vibration effects (proximity to sensitive receivers) Minimize adverse effects on cultural resources Minimize disruption of community vistas and adverse effects on street and - single family homes abut corridor from Finch to Highway one cemetery located north of Finch Avenue neighbourhood aesthetics - corridor includes wide boulevards and is well treed PROTECT NATURAL ENVIRONMENT Potential to utilize existing corridors Minimize impact on Wetlands and Watercourses PROMOTE SMART GROWTH/ECONOMIC DEVELOPMENT Maximize access to planned growth and intensification areas, including Markham Centre Potential to stimulate more transit-oriented development Consistency with Official Plan objectives PROVIDE AN EFFECTIVE TRANSPORTATION SERVICE Maximize ridership potential and relationship to existing and future travel patterns Maximize connectivity to existing and future transit Serves employment nodes Serves major residential areas Maximize access to intermodal terminals Consistency with York Region Transportation Master Plan MAXIMIZE COST-EFFECTIVENESS OF RAPID TRANSIT Minimize property impacts and acquisition Minimize impact on structures + Already a built-up route - 1 watercourse north of Steeles Avenue + does not involve new crossing - Does not connect with Markham Centre directly + Serves 7/404 employment node - Majority of corridor is primarily single family homes + Improves access to Highway 7/404 employment node - Not identified specifically in York O.P. + Don Mills South of Steeles Avenue is identified as Higher Order Transit corridor + highest boardings per kilometre and highest maximum ridership of three routes + connects into planned City of Toronto Don Mills Higher Order Transit facility; - Limited employment between Highway 407 and Finch Avenue + Serves 7/404 employment node and Seneca College (Newnham) - primarily low density residential uses North of Steeles Avenue + residential densities increase south of Finch Avenue - Does not connect to GO Rail station + direct north-south connection to Don Mills Station + identified as part of priority transit network + R.O.W. north of Steeles Avenue can accommodate widening - three structures (German Mills Creek, Hwy 407 and CN) + corridor is largely commercial and employment uses - some residential south of Steeles Avenue + corridor is largely commercial and employment uses - widening for transit would result in very wide corridor with minimal streetscaping opportunities + Already a built-up route - 2 watercourses north of Steeles Avenue + does not involve new crossing - Does not connect with Markham Centre directly; no growth nodes are identified for corridor - corridor is largely commercial and employment uses, which are relatively stable and not identified for change in Official Plans - Highway 404 is not identified as a major growth corridor; although it is being developed for employment uses - highest boardings per kilometre and highest maximum ridership of three routes - does not connect with City of Toronto higher order transit corridor; less desirable location of connection with Highway 7 transitway + Serves Allstate Parkway Business park and future Seneca College Campus - majority of the corridor is non-residential or low density residential - no direct connection to GO rail stations + connects to potential future Highway 407 Transitway station + identified as part of priority transit network + R.O.W. north of Steeles Avenue is already built out to 6 lanes and cannot be widened without acquiring property - three structures (Beaver Creek, Hwy 407 and CN); may be impacts on Highway 404 structures - Residential uses exist south of Denison Street and along Victoria Park Avenue + Facilities already have transit services - 2 cemeteries along route + R.O.W. south of 14 th Avenue can accommodate additional lanes; north of 14 th Avenue there are very few adjacent properties + Already a built-up route - 1 watercourse north of Steeles Avenue + does not involve new crossing - Provides most direct connection to Markham Centre + Can support growth of Markham Centre + Pockets of vacant land exist to intensify development - part of corridor is taken up by Highway 407 lanes + Warden Avenue connects to the regional growth node of Markham Centre + Victoria Park Avenue South of Steeles Avenue is identified as Priority Transit corridor in the Toronto O.P + similar ridership as Don Mills/Leslie, but higher proximity to population and employment in longer term - less direct connection to existing terminus of Sheppard Subway + connects with Highway 7 Transitway and Highway 407 Transitway at Markham Centre, a major transit node + Served Markham Centre, IBM, Amex and other major employment nodes - majority of corridor is non-residential or low density residential + large concentration of apartments exists on Warden south of Steeles Avenue + can be easily connected to Unionville GO station via Enterprise Drive; connects to potential future Highway 407 Transitway station + identified as potential rapid transit corridor + R.O.W. north of Steeles Avenue can accommodate widening - two structures (Highway 407 and CN) OVERALL ASSESSMENT TECHNICALLY PREFERRED ROUTE LEGEND: Least Responsive Most Responsive O.P. Official Plan, HOV High Occupancy Vehicle, TMP Transportation Master Plan, RT Rapid Transit TO1793 Markham North South Link Corridor Public Transit Improvements Environmental Assessment 28/02/

 commercial node. There is also less potential for Woodbine Avenue to be developed for more intensive transit oriented land use.")


60 Based on the above analyses, it can be concluded that both the Warden Avenue Corridor north of Steeles Avenue and the Don Mills/Leslie Corridor have strong potential for public transit improvements. A corridor following Woodbine Avenue is less desirable since it does not provide direct access for either Markham Centre or the Highway 404/7 (Beaver Creek and Commerce Valley) commercial node. There is also less potential for Woodbine Avenue to be developed for more intensive transit oriented land use. Figure 5-9 Alternative Physical Infrastructure Options In the longer term, Warden Avenue would have a greater potential to support a rapid transit system since it contains a high concentration of employment activities throughout the full length of the route. While the Don Mills/Leslie Street corridor contains significant concentrations of employment at each end of the corridor, a significant portion of the corridor contains low density residential uses. 5.6 ALTERNATIVE PHYSICAL INFRASTRUCTURE IMPROVEMENTS 5 Given the diversity of conditions in the Markham North-South Corridors, combined with the fact that the analysis of travel patterns indicates that public transit improvements should be considered in more than one corridor, it is appropriate to examine a range of physical infrastructure alternatives. Physical infrastructure alternatives essentially consist of alternatives for locating rapid transit, or enhanced transit, within the road R.O.W. and include the following: Queue Jump Lanes Median Bus Rapid Transit Queue jump lanes, which provide priority for transit vehicles at intersections or other bottle-necks; separate curbside lanes that are fully dedicated for buses, or operate as combined transit/hov lanes; an exclusive two way median in the centre of the roadway with northbound and southbound vehicular traffic either side of the transitway, A detailed evaluation of alternative physical infrastructure alternatives was undertaken for the Markham North South Link Corridor. This evaluation was based on three main factors; transportation, human environment and economic. The factors were further divided into indicators that were considered most pertinent to the evaluation. The results of this evaluation are summarized in Table 5-7. A description of the above alternatives is shown in Figure 5-9. Curb-side Transit Lanes TO1793 Markham North South Link Corridor Public Transit Improvements Environmental Assessment 28/02/
61 5 FACTOR & INDICATOR TRANSPORTATION Table 5-8 Evaluation of Alternative Physical Infrastructure Alternatives Median Transitway ALTERNATIVE Curb Side Transit lanes Queue Jump Lanes Transit Service Reliability Impact on Traffic Operations Overall Safety of Options Vehicle Access to Adjacent Properties HUMAN ENVIRONMENT Noise & Vibration Impacts Convenience & Comfort to Passengers Accessing Transit Facilities Streetscape Improvement Opportunities EXPLANATION OF EVALUATION/SCREENING In a median transitway the left turn centre lane will be eliminated and left turns will be prohibited mid block. Transit will have no interference from vehicular traffic except at intersections resulting in a reliable service especially if transit is given priority at signals. A two-way curb transitway will have interference only on one side of the roadway from vehicles entering driveways. Queue jump lanes will provide modest priority at intersections only. A median transitway will force all turning traffic to U-turns or intersections. This will decrease the capacity at intersections. The effect of mixed traffic with transit vehicles in the roadway and at signals for a curb side transitway will result in more conflicts than that compared with a median transitway. Queue jump lanes will reduce the interference between buses and regular traffic. A median transitway is considered the safest as it has the least number of conflicts with road traffic. Some conflicts still remain though at intersections with left turning vehicles. A curb transitway will be least safe due as transit vehicles will overlap with right turn traffic at intersections. Although the median option will prohibit left turn lane access to adjacent lands, the provision of U- turns, either dedicated or at intersections, will provide a balanced access to adjacent land use. A curb transitway will permit the most convenient access to adjacent lands except for interference from transit vehicles on the curb side. Queue jump lanes will afford full access to adjacent properties. A median transitway will be furthest from adjacent buildings and therefore have least impact on them. A two-way curb transitway or queue jump lanes will be closest to adjacent buildings on one side and will have worst vibration and noise impacts in areas where transit buses are passing each other. Curb-side transit is more familiar to passengers normally using transit. Curb side platforms can be wider and feel safer as they are away from transit and road vehicles Passengers will feel more uneasy especially in areas where platforms are located in the median and where there will be traffic on both sides of a platform such as in the case of a median transitway. A median transitway will allow better opportunity for a more uniform streetscaping arrangement. It will allow a separate transitway more of a distinct character. FACTOR & INDICATOR TRANSPORTATION Median Transitway ALTERNATIVE Curb Side Transit lanes Queue Jump Lanes Economic Environment Capital & Operating Costs Land Acquisition Costs OVERALL QUALITY RATING: Most Preferred Least Preferred EXPLANATION OF EVALUATION/SCREENING A curb transitway or mixed traffic transit will have little opportunity for streetscaping enhancements. A median transitway will have the highest capital costs due to having the widest cross section especially in platform areas. A curb transitway will have opportunities for combining platform construction with adjacent sidewalks. Queue jump lanes will have the lowest capital costs. Land acquisition costs ranking will be similar to that of construction cost rankings due to the effect of cross sectional impacts. Any alternative could be used for the preferred undertaking depending on location. However, median transitway provides the best level of transit service. The result of the evaluation indicated that a median transitway was generally preferred for the following reasons: It had the best transportation service quality; It was deemed the safest as it had the least number of conflict points at intersections; It provided good opportunity to mitigate the impact of local traffic and property access issues; and It was also considered more desirable as it allowed for better streetscaping opportunities. However, the choice of physical infrastructure depends on local conditions including: Available R.O.W. width Number of driveways and type of traffic using the driveways (e.g. cars or heavy trucks); and, Potential for routing changes (i.e. in the southern portion of the study area routings may be modified if the Sheppard Subway is extended). Therefore, all three alternatives are carried forward for more detailed assessment as part of the preferred design. However, the preferred technology for the ultimate rapid transit network is a median transitway. 5.7 STRATEGY FOR IMPROVING PUBLIC TRANSIT IN THE MARKHAM NORTH-SOUTH CORRIDOR Rapid transit modes and technologies can evolve in a particular corridor over time. As growth occurs and development patterns change, increases in transit demand may justify or even mandate more expensive and complex technologies over time. For example, rapid transit development in a corridor may begin with a conventional BRT service operating in mixed traffic with dedicated transit lanes along specific segments. Over time, as ridership increases, partially segregated transitways, station by-passes, larger, more complex vehicles, upgraded intelligent transportation systems and other technologies can be added. Eventually the point may be reached when ridership levels are high enough that partially segregated LRT or even fully segregated heavy-rail transit could become warranted. There are several factors that suggest a staged approach to the implementation of rapid transit in the Markham North-South corridor is appropriate: Existing transit ridership in the corridor is relatively modest compared to other corridors such as Yonge Street. Existing transit volumes would not justify immediate implementation of a full rapid transit system (e.g. dedicated right-of-ways). Some parts of the corridor required to support rapid transit have not yet fully developed, the most important of which is Markham Centre. There is a need to develop the rapid transit system to reflect the pace of development for Markham Centre. Forecasts for the VIVA Phase 1 service indicate that transit ridership in the short term could be handled by a bus-based system using existing right-of-ways combined with transit priority measures. The timing of potential transit or road improvements resulting from the Don Valley Corridor Transportation Master Plan is not known at this time. The timing of potential extensions of the Sheppard Subway as well as other higher order transit services identified in the City of Toronto Official Plan are uncertain. Funding constraints may not permit the development of a full rapid transit system in the short term. Furthermore, due to the nature of demand patterns in the corridor, and the fact that there are multiple employment nodes that would benefit from improved transit service, it is appropriate to implement public transit improvements in more than one corridor. Figure 5-10 provides an overview of the proposed method of improving public transit service in the Markham N-S Link Corridor. TO1793 Markham North South Link Corridor Public Transit Improvements Environmental Assessment 28/02/
62 The first stage of the evolution of rapid transit corridor is the implementation of a higher frequency, limited stop service utilizing modern buses to establish a transit connection between Markham Centre and the Sheppard Subway. This is referred to as the VIVA Phase 1 service, which has been in operation since Fall At such time when demand warrants, the next step for the preferred corridor would be to construct median transit lanes on Warden Avenue from Enterprise Drive to Denison Street. In the longer term, these median transit lanes could be extended south to connect with a future higher order transit service in Toronto such as the Finch Hydro corridor or an extension of the Sheppard Subway. Although not part of the preferred undertaking, an important enhancement to public transit in the study area would be the implementation of transit priority improvements on Don Mills/Leslie Street north of Steeles Avenue to allow for expedited transit services between Don Mills Station and the Highway 404/7 commercial node. These services would connect to the planned Don Mills Higher Order Transit corridor south of Steeles Avenue and be integrated with future initiatives in that corridor. Transit priority measures would also be implemented on other roadways as identified in the York Region Transportation Master Plan. The City of Toronto has initiated an EA to examine transit needs for Don Mills south of Sheppard. scope and nature of transit priority measures on Don Mills Road/Leslie Street will be determined through other process. Specifically, York Region will be undertaking a Class Environmental Assessment for a proposed Leslie Street widening as identified in the Transportation Master Plan. It is recommended that this Class EA consider, as an alternative solution, transit priority measures. Similarly, the City of Toronto will be advancing planning for the Don Mills corridor. It is important that York Region and the City of Toronto work together in this regard. In the remainder of this EA, alternative design concepts are developed and evaluated for a surface rapid transit facility in the Warden Avenue corridor, including connecting facilities to existing and potential future rapid transit networks in the City of Toronto. Figure 5-10 Preferred Alternative Method of Improving Public Transit in the Markham N-S Corridor and Relation to Other Corridors Highway 7 VIVA Corridor Highway 407 GO Transit Corridor Surface Rapid Transit on Warden Avenue (Subject to Detailed Investigation) 5 Based on the evaluation of technologies presented previously, the initial technology will be Bus Rapid Transit (BRT). This technology provides sufficient capacity to handle the projected transit ridership demands while allowing for flexibility of routing over time as the corridor develops and future rapid transit alternatives are established in the City of Toronto. Bus Rapid Transit also allows for seamless travel from other rapid transit corridors in York Region and can be implemented in a phased manner. In the longer term, Light Rail Transit (LRT) could also perform the function of providing surface rapid transit. LRT has similar operating characteristics and physical requirements as BRT, but generally provides for higher capacities. In order to maintain flexibility for evolving needs, and potential future opportunities in the corridor over the longer term, LRT technologies were carried forward as an alternative method of improving public transit. The decision to convert to LRT technology as defined in this EA would be subject to Regional Council Approval during an open session. The introduction of LRT in the York Region portion of the corridor would be predicated on the availability of LRT facilities connecting to the Sheppard Subway. The development of LRT in the City of Toronto would require a separate study and approvals process. Priority Transit on Don Mills/Leslie and other corridors (per York Region Transportation Master Plan) Potential Higher-Order Transit Corridors (City of Toronto O.P.) Potential Transit Priority Corridors (City of Toronto Official Plan) Potential Long Term Surface Rapid Transit Connection to City of Toronto (Subject to Detailed Investigation) Possible Surface Rapid Transit Connections to City of Toronto (Subject to Detailed Investigation) Bus Rapid Transit to Don Mills Station using Existing Corridors Implementation of the VIVA Phase 1 services do not require an Environmental Assessment as no major infrastructure will be required. The TO1793 Markham North South Link Corridor Public Transit Improvements Environmental Assessment 28/02/
63 6. DETAILED EXISTING CONDITIONS IN CORRIDOR Chapter 6 summarizes the existing conditions in the selected transit corridor Detailed information is provided for Warden Avenue where the dedicated transit lanes are proposed, while lesser detail is presented for the mixed traffic segments. 6.1 TRANSPORTATION ENVIRONMENT This Section introduces the various aspects of the transportation environment in which the project is proposed to take place. Supporting information on transportation operations is provided in Appendix D Local/Regional Transit Network As summarized in Chapter 2, there are a number of local and region bus service operating the study area. Warden Avenue is served by Route 68 operating out of Warden Station. TTC Route 68B operates every minutes during peak periods and every Minutes during the midday. TTC Route 224C/D services operate out of the Don Mills Subway during peak periods only. TTC Route 24D (off-peak service), operate out of the Victoria Park Subway. TTC Route 224C operates every 40 minutes during peak periods. TTC Route 24D operates every 30 minutes during the midday. TTC Route 224D operates every 40 minutes during peak periods. Service on Don Mills Road/Leslie Street north of Steeles Avenue is served by Route 25D out of Pape Station with connections to Don Mills Station at Sheppard, operating at 15 minute headways in the peak periods. This route is supplemented by YRT Route 90, which operates as a closed door service south of Steeles Avenue Existing Roadway Network Warden Avenue North Included in Table 6-1 is a summary of the basic lane cross-sections for Warden Avenue between Steeles Avenue and Highway 7. North of Steeles Avenue, Warden Avenue generally consists of 4 through lanes plus a centre left turn lane. The R.O.W. is typically m including a boulevard (3-5 m) on both sides of the road. Construction began in 2005 to widen the five-lane roadway to seven lanes north of 14 th Avenue. The posted speed on Warden Avenue is 70 km/hr through most of its length. Table 6-1 summarizes the existing conditions on Warden Avenue including the committed widening, where noted. Table 6-1 Roadway Cross-Section Summary for Warden Avenue North Section Existing Conditions Steeles Ave to Masseyfield Gate/Gibson Dr Masseyfield Gate/Gibson Dr to Denison St Denison St to McNabb St McPherson St/ McNabb St to Alden Rd/ 14 th Ave Alden Rd/14 th Ave to Cedarland Dr Cedarland Dr to Highway 7 ROW Number of lanes 37 m 4 lanes, centre lane 4 lanes, median and 1 left turn at intersection 37 m 4 lanes, centre lane 4 lanes, median and 1 left turn at intersection 37 m 4 lanes, centre lane 4 lanes, median and 1 left turn at intersection 37 m 4 lanes, centre lane 4 lanes, median and 1 left turn at intersection 39 m 4 lanes, centre lane 4 lanes, median and 1 left turn at intersection 39 m 4 lanes, centre lane 4 lanes, median and 1 left turn at intersection Left Turn location Steeles Ave Masseyfield Gate/ Gibson St Denison McPherson/ McNabb 14 th Ave Enterprise Dr Cedarland Dr Boulevard 5.25 m with sidewalk and tree line in both sides of the road 5.25 m with sidewalk and tree line in both sides of the road 5.25 m with sidewalk and tree line in both sides of the road 5.25 m with sidewalk and tree line in both sides of the road 5.25 m with sidewalk and tree line in both sides of the road 5.25 m with sidewalk and tree line in both sides of the road 5.25 m with sidewalk and tree line in both sides of the road 5.25 m with sidewalk and tree line in both sides of the road The following structures are located along Warden Avenue between Steeles Avenue and Highway 7: Over the CN York Subdivision: Presently a three span prestressed precast concrete girder bridge providing 2 lanes of travel in each direction plus 1.8 m sidewalks on both sides. This bridge is planned to be widened to six lanes in Over Highway 407: Presently a two span prestressed precast concrete girder bridge providing 3 lanes of travel in each direction plus sidewalks on both sides. Minor medications will be made to the lane geometry on this bridge with the widening of Warden Avenue; specifically the outside lanes presently taper into the Highway 407 ramps and will need to be modified provide for through. This structure is owned, maintained and operated by 407 ETR and any proposed changes to this structure would require the approval of 407 ETR. Over the Rouge River: This is a single span concrete girder bridge providing 4 lanes of traffic plus a large paved median, for a total of 20.5 metres of roadway surface. This structure has been designed to be expanded to provide for six lanes of through traffic, plus a centre median. Signalized intersections are located at: Steeles Avenue E New Century Plaza (New signal)* Gibson Dr. / Masseyfield Gt. Denison St. McPherson St. / McNabb St. 14th Avenue Highway 407 E/B Ramp Highway 407 W/B Ramp Cedarland Dr. Highway 7 * This signal was installed towards the end of completion of the EA and as a result some of the background reports and discussion following do not include detailed analysis for this signal. It is noted that the two signals at the Highway 407 ramps are owned by 407 ETR and operated by York Region under a legal agreement between both parties. Any proposed changes to the signals would require the approval of 407 ETR. U-turns at these ramp terminals will not be allowed. The average annual daily traffic (AADT) along Warden Avenue between Denison Street and varies from 32,000 to 38,500 vehicles. Truck movements make up approximately 3% of the vehicle composition during 6 TO1793 Markham North South Link Corridor Public Transit Improvements Environmental Assessment 28/02/
64 6 the peak hours. At present, pedestrian and cycling volumes on Warden Avenue are relatively low. The subject section of Warden Avenue serves two general functions for traffic movement: It provides a north-south alternative for traffic from Markham to Toronto, generally corresponding to commuter/work traffic; It provides access to the commercial and industrial properties east and west of Warden Avenue. As a result of these two traffic functions, the travel demands tend to be highly peaked during the weekday AM and PM peak hours. Off-peak and weekend traffic levels are considerably less than those experienced during the weekday AM and PM peak periods. Table 6-2 Average Annual Daily Traffic Counts on Warden Avenue Location Year AADT (Vehicles Per Day) Warden Avenue south of Highway ,100 Warden Avenue south of Highway ,470 Warden Avenue south of 14 th Avenue ,950 Notes: Based on automatic traffic recorder (ATR) counts provided by the Region of York Other Facilities Used by Markham N-S Link The Markham N-S Link will utilize a number of existing roadways to connect from Warden Avenue to the Sheppard Subway including: Denison Street Esna Park Drive Pharmacy Road Gordon Baker Road Finch Avenue Don Mills Road Table 6-3 provides a summary of the cross-section conditions on these facilities. Table 6-3 Cross-Section Features of Other Facilities Used by Markham N-S Link Street and Segment Existing Conditions Denison Street: Warden Avenue to Esna Park Road Esna Park Drive: Denison Street to Steeles Avenue Pharmacy Road Steeles Avenue to Gordon Baker Road Gordon Baker Road Victoria Park Ave to McNicoll Ave McNicoll Ave to Finch Avenue Finch Avenue Gordon Baker Rd to Highway 404 Highway 404 to Seneca Hill Dr ROW (Min) Number of lanes 26 m 4 lanes plus left turns at selected locations 26 m 4 lanes, centre lane4 lanes, 1 left turn at intersection 27 m 4 lanes, centre lane4 lanes, 1 left turn at intersection Left Turn location Warden Ave Hood Rd Esna Park Denison St Steeles Ave IBM Rd Gordon Baker Road Boulevard North side approx 3-5 m includes sidewalk and tree line South side approx m includes sidewalk and tree line Boulevard (approx 5m) include sidewalk and tree line in both sides of the road Boulevard (approx 5m) include sidewalk and tree line in both sides of the road 20 m 2 wide lanes Sparks Ave East side approx 2m includes sidewalk and tree line West side approx 2 m tree line 20 m 2 lanes and centre lane 27.3 m (North EP to South EP) 53.3 m at Gordon Baker 40.6 m before the structure 4 lanes, narrow median 4 lanes, 1 left turn, and 1 right turn at intersection 6 lanes and centre lane or median Finch Ave Gordon Baker Seneca Hill East side approx 2m includes sidewalk and some trees West side approx 2 m, no sidewalk Approx 5 m boulevard, sidewalk and trees in both sides of the road Approx m boulevard Finch Ave Van to Horne Ave Sheppard Ave to Van Horne Ave m 6 lanes 6 lanes, median and 1 left turn at intersection 36.6 m 6 lanes 6 lanes, median and 1 left turn at intersection There are two structures along these routes: Van Horne Ave Sheppard Ave Leith Hill Rd Eastbrook Ave Approx 3m includes sidewalk and trees in both sides of the road Approx 5m includes sidewalk and trees in both sides of the road On Gordon Baker under McNicoll Avenue: 14.2 m (2 wide lanes, sidewalks and concrete barrier in both sides of the structure) On Finch Avenue over Highway 404: 32.7 m (6 lanes, centre lane, shoulder, sidewalk and concrete barriers with handrail in both sides of the structure) Table 6-4 Average Annual Daily Traffic Counts on Other Facilities Location Year AADT (Vehicles Per Day) Esna Park Drive south of Steeles Avenue ,310 Finch Avenue east of Don Mills Road ,310 Don Mills Road south of Finch Avenue ,370 Don Mills Road north of Sheppard Avenue ,830 Notes: Based on automatic traffic recorder (ATR) counts provided by the Region of York and the City of Toronto Intersection Operations Intersection capacity analysis was undertaken using the Highway Capacity Manual (HCM) methodology and in particular, the Synchro 5.0 software package. The analysis reflects the 2002 counts, current signal timings, and existing lane configurations. The AM and PM peak hour analysis results for both the signalized and unsignalized intersections are included in Table 6-5 and Table 6-6. Full analysis summaries are included in Appendix D of the detailed report. The critical movements are defined as, turning movements approaching a v/c of 1.0 and/or Level of Service E or F (LOS). Seneca Hill Dr to Don Mills Rd Don Mills Road 37.8 m 5 lanes and 1 left turn lane at intersection Don Mills Rd Approx 5 m boulevard, sidewalk and trees TO1793 Markham North South Link Corridor Public Transit Improvements Environmental Assessment 28/02/
65 Table 6-5 Existing AM Peak Intersection Operations Signalized Intersection Operations Existing AM Peak Intersection Reference Overall Critical Warden Delay LOS Delay LOS V/C Comments Highway F 157 F >1.10 WB left, WB through, NB left and SB through are operating at capacity Cedarland Avenue 13 B 15 B 0.94 SB through is approaching capacity Enterprise Drive 9 A No capacity constraints Highway 407 E-NS Off- Ramp 15 B No capacity constraints Highway 407 W-NS Off- Ramp 14 th Avenue (W)/Alden Road (E) 32 C 75 C D 160 F >1.10 SB through is approaching capacity SB left is operating at capacity. SB through, WB through, NB left and NB through are approaching capacity. McPherson Street (W)/McNabb Street (E) 21 C No capacity constraints Denison Street 111 F 251 F >1.10 EB left, WB through, NB left, NB through, SB left and SB through are operating at capacity. Intersection Reference Overall Critical Denison Delay LOS Delay LOS V/C Comments Hood Road 53 D No capacity constraints Esna Park Drive 13 B No capacity constraints Intersection Reference Overall Critical Esna Park Delay LOS Delay LOS V/C Comments IBM Road 16 B No capacity constraints Steeles Avenue 43 D 275 F >1.10 EB left, WB left and NB left are operating at capacity Gordon Baker Road 13 B No capacity constraints Intersection Reference Overall Critical Gordon Baker Delay LOS Delay LOS V/C Comments Victoria Park Avenue 13 B No capacity constraints Finch Avenue EB left and NB through East/Highway 404 S-NS 35 C 153 F >1.10 are operating at Off-Ramp capacity Intersection Reference Overall Critical Finch Avenue Delay LOS Delay LOS V/C Comments Highway 404 N-EW Off- Ramp Seneca Hill Drive (S)/Au Large Boulevard (N) 59 E 229 F > C 165 F >1.10 SB right is operating at capacity and the SB left is approaching capacity SB left is operating at capacity Skymark Drive 6 A No capacity constraints WB left and WB Don Mills Road 58 E 132 F >1.10 through are operating at capacity Signalized Intersection Operations Existing AM Peak Intersection Reference Overall Critical Comments Delay LOS Delay LOS V/C Intersection Reference Overall Critical Don Mills Delay LOS Delay LOS V/C Comments Seneca Hill Drive 16 B 67 E 0.92 WB through is approaching capacity Van Horne Avenue 161 D No capacity constraints Goodview Road 2 A No capacity constraints Deerford Road 1 A No capacity constraints Godstone Road / Georges Vanier School 4 A No capacity constraints Oriole Park Community Centre 1 A No capacity constraints Esterbrooke Avenue (W)/Fairview mall Drive (E) 19 B No capacity constraints Leith Hill Road (W)/Fairview Mall Entrance 13 B No capacity constraints (E) TTC Bus Entrance 32 C 43 D 0.90 SB through is approaching capacity Sheppard Avenue East 192 F 511 F >1.10 WB left, NB left and SB through are operating at capacity. EB through is approaching capacity. Table 6-6 Existing PM Peak Intersection Operations Signalized Intersection Operations Existing PM Peak Intersection Reference Overall Critical Warden Delay LOS Delay LOS V/C Highway 7 87 F 212 F >1.10 Cedarland Avenue 31 C 65 C 1.00 Enterprise Drive 7 A Highway 407 E-NS Off- Ramp Highway 407 W-NS Off- Ramp 14 th Avenue (W)/Alden Road (E) McPherson Street (W)/McNabb Street (E) 24 C C 45 C F 214 F > F 952 F >1.10 Comments EB through, WB left, NB through, SB left are operating at capacity. NB left is approaching capacity. EB right is operating at capacity. No capacity constraints No capacity constraints SB through is approaching capacity EB left, WB left, WB right and NB through are operating at capacity. EB through and SB left are approaching capacity. East and West approaches are operating at capacity. SB left is also operating at capacity. Signalized Intersection Operations Existing PM Peak Intersection Reference Overall Critical Comments Delay LOS Delay LOS V/C Denison Street 74 E No capacity constraints Intersection Reference Overall Critical Denison Delay LOS Delay LOS V/C Comments Hood Road 19 B No capacity constraints Esna Park Drive 12 B No capacity constraints Intersection Reference Overall Critical Esna Park Delay LOS Delay LOS V/C Comments IBM Road 18 B No capacity constraints Steeles Avenue 85 F 815 F >1.10 EB left and WB left are operating at capacity. EB through is approaching capacity. Gordon Baker Road 16 B No capacity constraints Intersection Reference Overall Critical Gordon Baker Delay LOS Delay LOS V/C Comments Victoria Park Avenue 22 C 142 F >1.10 EB left is operating at capacity. Finch Avenue EB through is operating East/Highway 404 S-NS Off-Ramp 30 C 37 D 1.02 at capacity. SB right is approaching capacity Intersection Reference Overall Critical Finch Avenue Delay LOS Delay LOS V/C Comments Highway 404 N-EW Off- Ramp Seneca Hill Drive (S)/Au Large Boulevard (N) 21 C 64 E C 78 E 0.92 SB right is approaching capacity SB left is approaching capacity Skymark Drive 10 B No capacity constraints WB left and NB through Don Mills Road 50 D 133 F >1.10 are operating at capacity. Intersection Reference Overall Critical Don Mills Delay LOS Delay LOS V/C Comments Seneca Hill Drive 4 A No capacity constraints Van Horne Avenue 34 C 292 F >1.10 SB left is operating at capacity Goodview Road 2 A No capacity constraints Deerford Road 1 A No capacity constraints Godstone Road/Georges Vanier 9 A No capacity constraints School Oriole Park Community Centre 1 A No capacity constraints Esterbrooke Avenue WB left is operating at (W)/Fairview mall Drive 37 D 109 F 1.02 capacity (E) Leith Hill Road (W)/Fairview Mall Entrance (E) 71 E 448 F >1.10 TTC Bus Entrance 49 D 77 E 0.96 SB left is operating at capacity NB through is operating at capacity 6 TO1793 Markham North South Link Corridor Public Transit Improvements Environmental Assessment 28/02/
66 6 Signalized Intersection Operations Existing PM Peak Intersection Reference Overall Critical Warden Delay LOS Delay LOS V/C Sheppard Avenue East 357 F 706 F >1.10 Comments EB left, EB through, WB left, NB left, NB through, SB left and SB through are operating at capacity. Based on a review of the above analysis and from field operations, the following are apparent: The majority of the capacity constraints are located at intersections where two major arterial roadways intersect such as Don Mills Road/Finch Avenue, Don Mills Road/Sheppard Avenue or Warden Avenue/Highway 7; The 14 th Avenue intersection represents a key constraint on Warden Avenue during the AM and PM peak hours; A number of the left turn movements at the intersections are operating under permissive left turn control and thus are operating at capacity when opposing the peak through movement; Provided below is a summary of key operational constraints along the Markham North South link and the potential connecting route through the City of Toronto to Don Mills Station. Warden Avenue/Cedarland Avenue: Cedarland Avenue provides an alternative route for vehicles avoiding the Warden Avenue/Highway 7 intersection via Town Centre Boulevard. Therefore, the northbound left and eastbound right movements are significantly heavy during both peak periods. During the AM peak hour the intersection operates at a satisfactory level of service. During the PM peak hour the eastbound right turn movement is operating at capacity. Warden Avenue/14 th Avenue/Alden Road: 14 th Avenue/Alden Road serves a significant amount of vehicles in the east-west direction with volumes of approximately 1,000 vehicles in the peak direction. The southbound left and right turn movements during the AM peak hour and the reverse eastbound left and westbound right turn movements during the PM peak hour are significantly heavy with volumes ranging from approximately 410 vehicles to 870 vehicles per movement. As a result the intersection operates at capacity during both peak periods. The critical movement during the AM peak hour is the southbound left and during the PM peak hour the eastbound left, westbound left, westbound right and northbound through operate at capacity. From field observations, the southbound queue extends to the Highway 407 W-NS Off-Ramp during the AM peak period. It is noted that at the time of this EA, Warden Avenue was being widened to six lanes north of 14 th Avenue. Warden Avenue/McPherson Street/McNabb Street: McPherson Street/McNabb Street acts as a diversion route to 14 th Avenue/Alden Road/Warden Avenue intersection for vehicles avoiding the critical movements. This is apparent from observing the volumes as the southbound left and right turn movements during the AM peak hour and the reverse eastbound left and westbound right turn movements during the PM peak hour are similarly heavy to those volumes at 14 th Avenue/Alden Road. During the AM peak hour the intersection is operating at a satisfactory level of service. During the PM peak hour the east and west approaches are operating at capacity as well as the southbound left. Warden Avenue/Denison Street: The eastbound left, northbound left and southbound left movements are operating at capacity during the AM peak hour. From field observations, the eastbound left queue extended to Hood Road due to the heavy opposing westbound traffic and minimal gaps in the traffic flow. During the PM peak hour the intersection operates at a satisfactory level of service. Esna Park Drive/Steeles Avenue: During the AM peak hour the eastbound and westbound left turn movements are operating at capacity, as the advance phase of 11 seconds is not adequate to accommodate the 7 to 10 vehicles per cycle. The northbound left also operates at capacity, as a northbound advance is not provided. During the PM peak hour the eastbound and westbound left turn movements continue to operate at capacity as an east west left turn advance phase is not provided. Gordon Baker Road/Victoria Park Avenue: During the AM peak hour the intersection operates at a satisfactory level of service. During the PM peak hour the eastbound left is operating at capacity as an eastbound advance phase is not provided. Gordon Baker Road/Finch Avenue East/Highway 404 S-NS Off- Ramp: The eastbound left and northbound through movements operate at capacity during the AM peak hour. During the PM peak hour the eastbound through and southbound right turn movements operate at capacity. The southbound right movement is significantly heavy with approximately 950 vehicles exiting the industrial/office park area on Gordon Baker Road. Finch Avenue/Highway 404 N-EW Off-Ramp: The southbound right turn movement during the AM peak hour is approaching capacity as approximately 650 vehicles exit Highway 404 onto Finch Avenue. During the PM peak hour the southbound right turn movement operates at capacity and the southbound left turn movement is approaching capacity as a majority of the green time is allocated to the east west movements. Finch Avenue/Seneca Hill Drive/Au Large Boulevard: The intersection on Finch Avenue at Seneca Hill Drive and to Seneca College operates at capacity during the AM peak hour. The southbound left turn movement of approximately 200 vehicles operates at capacity. During the PM peak hour this movement is approaching capacity with volumes in excess of 500 vehicles per hour. Finch Avenue/Don Mills Road: It is apparent from observing the traffic volumes at this intersection that the peak direction during the AM peak hour is in the westbound direction on Finch Avenue and southbound direction on Don Mills Road. The reverse is observed during the PM peak hour. This intersection is operating at capacity during both peak periods. The westbound left and through movements are operating at capacity during the AM peak hour and the westbound left and northbound through movements are operating at capacity during the PM peak hour. Don Mills Road/Esterbrooke Avenue/Fairview Mall Drive: During the AM peak hour the intersection is operating at a satisfactory level of service. During the PM peak hour, the westbound left is operating at capacity as the north south movements demand a significant amount of green time. Don Mills Road/Leith Hill Road/Fairview Mall Entrance: During the AM peak hour, all the movements are operating below a v/c ration of 1.0. The southbound left is operating at capacity during the PM peak hour as a southbound advance is not provided and the opposing northbound volumes are approximately 1,750 vehicles per hour. Don Mills Road/Sheppard Avenue East: Approximately 1,500 to 3,000 vehicles per approach travel through this intersection during the peak hour. The southbound through, westbound left and northbound left turn movements operate at capacity during the AM peak hour. During the PM peak hour, the left and through movements in the southbound, eastbound and northbound direction operate at capacity. Long queues are observed especially in the left turn movements, which exceed the available storage lengths and have a tendency to block a through lane. TO1793 Markham North South Link Corridor Public Transit Improvements Environmental Assessment 28/02/
67 Neighbourhood Traffic Concerns land use. The following are high or active pedestrian locations or areas along the corridor: 6.2 NATURAL ENVIRONMENT In general, the route passes through commercial and industrial areas. There is only one neighbourhood that could potentially be affected by reduced traffic capacity on Warden Avenue: Underwood Neighbourhood: The Underwood Neighbourhood is located in the northeast quadrant of Steeles Avenue and Warden Avenue and is centred on Birchmount Road. Reduced traffic capacity on Warden Avenue could put more traffic onto Birchmount Road, a major collector facility through this area. Most of the residences in this neighbourhood are backloted (i.e. facing away from Warden Avenue) Pedestrian/Cycling Network Sidewalks are provided along the entire length of the Markham North South corridor including Warden Avenue, Denison Street and Esna Park Drive. The roadways along the proposed route within the City of Toronto including, Gordon Baker Road, Finch Avenue East and Don Mills Road also include a sidewalk on at least one side of the roadway. Presently, there are no on-road bicycle facilities provided on Warden Avenue, nor are there bicycle paths or bikeways provided within the Markham North South corridor. Pedestrian signal heads are provided at a majority of the signalized intersections in the study area. At the following locations Audible Pedestrian Signals (APS) have been installed to accommodate the visually challenged: Cedarland Drive / Warden Avenue; Steeles Avenue / Pharmacy Avenue / Esna Park Drive; and Don Mills Road / Sheppard Avenue. Pedestrian signals have been installed on Don Mills Road at Goodview Road and the Oriole Community Centre. Pedestrians actuate the signal and are permitted to cross Don Mills Road by the demand of a pedestrian push button Pedestrian/Cycling Demand Pedestrian Demand Pedestrian activity varies considerably along the Markham North South corridor within the project limits and is generally a function of the adjacent Location Table 6-7 High Pedestrian Areas Characteristics Highway 7 / Warden Avenue Key transit transfer area Markham Town Square and Markham Theatre Esna Park Avenue / Pharmacy Avenue / Steeles Avenue Key transit transfer area Office / industrial area Victoria Park Avenue / Steeles Avenue Key transit transfer area IBM Finch Avenue / Seneca Hill Drive Seneca College Newnham Campus Seneca Village Community Centre Don Mills Road / Finch Avenue Key transit transfer area to other surface bus routes Specialty commercial, retail, personal services, and institutional uses. Don Mill Road / Van Horne Avenue Residential area Don Mills Road / Godstone Road 3000 Don Mills Road Georges Vanier Secondary School for grades 10 to 12 Don Mills Road / Esterbrooke Avenue / Fairview Mall Drive Don Mills Road / Leith Hill Road (W) / Fairview Mall Residential area Fairview Mall 35 Fairview Mall Drive Fairview Library Fairview Mall Don Mills Road / Sheppard Avenue Key transit transfer area to Sheppard Subway Line and other surface bus routes Cycling Demand During field investigations and from existing turning movement count data, little bicycle travel was observed on the preferred route and potential link within the City of Toronto. Given the volume, speed of traffic on Warden Avenue and the nature of the land uses on the remaining road along the Markham North South Link, bicycle travel is limited to commuter/recreational intermediate to serious riders, i.e., inexperienced, casual and young cyclists would generally not be comfortable riding on these roadways. Typical bicycle volumes on Steeles Avenue at Esna Park Drive ranged from 2 to 6 bikes per approach per hour. Bicycle volumes on Don Mills Road, specifically at Finch Avenue were observed to be higher ranging from 5 to 11 bikes per approach per hour. This Section describes the existing conditions in the study area related to natural sciences, including physiography and soils, geology/hydrogeology, aquatic habitat and communities, vegetation and vegetation communities, wildlife and wildlife habitat and designated natural areas. The detailed description of the Natural Environment is presented in Appendix E. A summary of the main Natural Environment features is presented in Figure Physiography and Soils The study area is located primarily in the South Slope and Peel Plain physiographic regions. The South Slope is a till plain that was formed by retreating glaciers. The slope in the study area is smooth to gently rolling with low drumlins. The soils of the South Slope are relatively impermeable which results in extensive run-off to local watercourses. The Peel Plain is a level to undulating tract of clay soils. The dominant soil is Peel Clay, which is fine and poorly drained. As a result, infiltration is low and groundwater supply is limited as more precipitation ponds on the surface or is lost through evaporation or surface runoff. The underlying geological material of the Peel Plain is a till or boulder clay which contains large amounts of Palaeozoic shale and limestone. The general elevation of the Peel Plain is from 500 to 750 feet above sea level and there is a gradual and fairly uniform slope towards Lake Ontario. Soils surrounding the alternative routes in the study area are classified as Brady sandy loam, Peel clay, Malton clay, Cashel clay, Berrien sandy loam, Woburn loam, Simcoe clay loam, Milliken loam, Chinguacousey clay loam and Bottom Lands. On Woodbine Avenue and Highway 404 the soils include Brady sandy loam, Peel clay, Malton clay, Cashel clay, Woburn loam, Milliken loam, Chinguacousy clay loam and Bottom Lands. Along the Hydro corridors running both north-south and east-west soils include Peel clay, Brady sandy loam, Cashel clay, Woburn loam, Milliken loam and Bottom Lands. On Warden Avenue soils include Berrien sandy loam, Brady sandy loam, Woburn loam, Simcoe clay loam, Milliken loam and Bottom Lands. On Victoria Park Avenue soils consist of Malton clay, Cashel clay, Peel clay, Woburn loam, Chinguacousy clay loam, Milliken loam and Bottom Lands. On Don Mills Road the soils include Cashel clay, Peel clay, Woburn loam and Bottom Lands. On Steeles Avenue the soils consist of Cashel clay and Malton clay. Surrounding Gordon Baker Road the soils include Woburn loam, Malton clay and Cashel clay. On Finch Avenue the soils consist of Woburn loam, Milliken loam and Bottom Lands. 6 TO1793 Markham North South Link Corridor Public Transit Improvements Environmental Assessment 28/02/

68 6 A detailed description of the types of soils and their main characteristics within the study area is presented in Appendix E to this document. Figure 6-1 Existing Natural Environment in Warden Avenue Corridor Geology/Hydrogeology Jagger Hims Limited assessed the hydrogeological conditions within a study area that is bounded by Don Mills Road, Kennedy Road, Highway 7 and Sheppard Avenue, including lands within 500 m of the preferred route. The following summary provides a general interpretation of the existing physical setting based upon information obtained from the MOE Water Well Database, published geological maps, aerial photography, surface topography, and field reconnaissance Surficial Geology Surficial geologic mapping indicates that the study area is dominantly underlain by the following types of soil units: glacial till deposits, primarily Newmarket Till, that is comprised of dense sandy silt to sand matrix soils, glacial lake deposits that are comprised of silt and clay, glacial lake deposits that are primarily comprised of sand and silty sand, The distribution of these units is shown in Appendix E. Other types of soil units are present in the study area to a minor degree Distribution of Aquifers Subsurface conditions within the study area were reviewed using cross sections that were prepared by Earthfx Inc. These sections were created using information in the Ministry of the Environment (MOE) water well database that includes subsurface materials encountered and static water levels at the time of drilling. The cross sections prepared for the study area indicate that the geology consists of at least a 50 m thickness of overburden (soil) resting upon bedrock. The vertical profile of overburden materials described by the well drilling contractors, indicates variable soil conditions ranging from clay to gravel. Fine-grained materials are dominant in the subsurface, with some internal layers of granular materials that are capable of serving as localized groundwater aquifers. A sandy aquifer is present between about 14 th Avenue and 500 m northward, which is near to the location of a former aggregate extraction operation. Subsurface information is sparse for large portions of the study area, limiting interpretation Horizontal Groundwater Movement Given the physical setting of the study area, the water table surface is likely to be a subtle reflection of the ground surface topography. As such, shallow groundwater is interpreted to move in the local down grade direction. Generally, in areas within 100 to 200 m of a watercourse, shallow groundwater movement will be directed toward the watercourse. Several surface water subcatchments are crossed by the preferred route. It is probable that the boundaries of shallow groundwater subcatchments will be similar to surface water subcatchments, so groundwater will move within the subcatchment. In some areas the presence of underground service trenches can result in locally complex shallow groundwater flow patterns. The probable direction of groundwater movement was interpreted along the preferred route, as shown in Appendix E and is based on topographic contours of 1:10,000 scale OBM mapping. The direction of groundwater movement as indicated on the figures may change with distance away from the preferred route, depending on local conditions Groundwater Recharge/Discharge Areas A groundwater recharge area is land where groundwater movement below the water table has a downward component. Infiltration through the ground surface in a recharge area will contribute to the available volume of groundwater. Infiltrated water merges and mixes with the groundwater, so the quality of infiltrated water can affect the overall water quality of the groundwater. The rate of recharge per unit area depends on the climatic moisture surplus and local conditions such as soil type, ground slope, vegetation, and the proportion of impervious cover. A groundwater discharge area is land where groundwater movement at the water table has an upward component. The water table at a discharge area is usually close to or at ground surface. Discharge areas usually include permanent watercourses and wetlands, depending on site-specific conditions. In general, recharge areas provide the source of water that supplies discharge areas. In turn, discharge areas contribute base flow to watercourses, if hydraulically connected. Thus, a decrease in recharge can result in a decrease of base flow to a watercourse. Groundwater recharge areas and discharge areas were interpreted for the study area based on local topographic conditions. Discharge areas are interpreted to occur at watercourses, and in floodplain areas adjacent to them. There is only one watercourse crossed by the preferred route, which is Rouge Creek along Warden Avenue. Wetlands are sometimes indicators of groundwater discharge areas, but none were identified on published mapping within the study area. A pond is present, located west of the preferred route from Warden Avenue between 14th Avenue and Miller Avenue, which apparently originated as part of the former sub-aqueous aggregate extraction operations. Potential artesian water pressures are inferred, based on a static water level of 1.0 metres below grade or higher elevation in wells, as listed at the time of their construction. Wells with potentially artesian conditions are found near Highway 7, and at the northwest corner of Highway 404 and Steeles Avenue. Artesian conditions could occur at other locations but available information limits the interpretation. TO1793 Markham North South Link Corridor Public Transit Improvements Environmental Assessment 28/02/
69 Groundwater recharge will occur to varying degrees (depending on soil type and other factors) over the majority of the study area that is located between the discharge areas. Areas substantially covered by impervious surfaces, such as buildings, roads, and parking areas, will not contribute significant groundwater recharge. Recharge will mostly occur in areas that have exposed pervious soil, or vegetation covered soils, which near the preferred route includes portions of the floodplain adjacent to Rouge Creek, public parkland, school yards, playing fields, high-voltage electrical transmission corridors, grassed apron areas adjacent to Highway 407 and Highway 7, isolated undeveloped lots contained within developed areas, and maintained grass lawns Well Distribution An inventory was compiled of the water supply wells that historically have been present in the study area based on the MOE database. The MOE database documents the historic presence of water supply wells within the study area, most being located north of Steeles Avenue. There are no municipal supply wells in operation within the study area. Additional water supply wells may be located in the study area, but records of them are not included in the MOE database. Based on discussions with Regional staff and the obvious urbanized conditions, it is considered likely that most historic wells are no longer active and were demolished, buried or abandoned properly following urbanization. Most residential, commercial and industrial sites in the area are fully serviced by municipal water supplies. The construction details of supply wells that may still be in use are not known from available data Aquatic Habitats and Communities A reconnaissance level survey of watercourse crossings along the entire study corridor was performed in March A field investigation of aquatic habitat was undertaken in May 2003 and November A total of eleven watercourses crossings were investigated in the larger study area. None of these watercourses are directly crossed by the proposed transitway, although northern portion of the transitway (where it intersects with the Highway 7 transitway) is close to the Rouge River (See Figure 6-1). system within this reach. A list of fish species collected by the TRCA from the Rouge River and its tributaries in the vicinity of the preferred route is presented in Appendix E Rare, Threatened or Endangered Aquatic Species According to the Town of Markham Natural Features Study (1992) and fisheries data obtained from the TRCA, the main branch of the Rouge River and its tributaries support redside dace. Redside dace is designated Special Concern by the Committee on the Status of Endangered Wildlife in Canada (COSEWIC), designated Threatened by the Ministry of Natural Resources (MNR) and has a Provincial Rank (SRank) of Rare to Uncommon (S3). Redside dace have been documented in the main branch of the Rouge River surrounding Woodbine Avenue south of 16 th Avenue. This watercourse crosses the Warden Avenue route just south of Highway 7 (downstream). A second species with an SRank of S3, American brook lamprey, has been collected by the TRCA in Bruce Creek and Berczy Creek north of 16 th Avenue. Both Bruce Creek and Berczy Creek are coldwater tributaries of the Rouge River. A third species with an SRank of S3, central stoneroller, has also been collected by the TRCA in the main branch of the Rouge River just downstream of Woodbine Avenue south of 16 th Avenue. This watercourse crosses the Warden Avenue route just south of Highway 7 (downstream) Vegetation and Vegetation Communities The geographical extent, composition, structure and function of vegetation communities were identified through air photo interpretation and field investigations. Air photos were interpreted to determine the limits and characteristics of communities. Reconnaissance level field investigations of natural/semi-natural vegetation were conducted within the study area by LGL on May 8 and September 12, 2003 and November 15, The investigation included vegetation within/adjacent to the right-of-way of all of the short-listed transit improvement corridors within the Regional Municipality of York and the City of Toronto. The purpose of this investigation was to verify the limits of communities and to collect information on community composition, structure and function. southern Ontario was also reviewed against the Natural Heritage Information Centre (NHIC) database (NHIC 1997). Vascular plant nomenclature follows Morton and Venn (1990), with a few exceptions. The study area is situated in an urban environment and much of the vegetation within/adjacent to the study area is of anthropogenic origin resulting from past/present land use. Land use within/adjacent to the study area along the preferred alternative routes is predominantly industrial, institutional, commercial and residential. A total of eight vegetation communities have been identified within/adjacent to the study area along the preferred alternative routes. These communities include cultural meadows, cultural plantations, cultural savannahs, cultural thickets, cultural woodlands and deciduous forests. The vegetation communities identified are considered widespread and common in Ontario and secure globally (NHIC 1997). To date, a total of 183 vascular plant taxa have been recorded. Sixty-seven (67) taxa, 37 percent of the recorded flora, are considered introduced and non-native to southern Ontario. A list of vascular plants identified within the study area is presented in Appendix E Rare, Threatened or Endangered Plant Species No plant species considered rare, threatened or endangered (R, T, E) in Ontario were noted during field investigations. A total of 19 species considered regionally and/or locally uncommon or rare (Varga et al. 2000) were documented during field investigations for the short-listed routes and are described Appendix E. All regionally and/or locally uncommon or rare species were found in the Fresh-Moist Willow Lowland Deciduous Forest (FOD7-3) community associated with the Rouge River, and/or the Dry-Fresh Sugar Maple Deciduous Forest (FOD5-1) community Wildlife and Wildlife Habitat The study area comprises urban or near urban lands. The built environment is discontinuous but generally accommodates a large number of people, diverse human activities and high volumes and frequencies of road use. 6 Appendix E provides a detailed description of the watercourses and their characteristics along with a photographic record Rouge River The main branch of the Rouge River crosses Warden Avenue between Highway 7 and Highway 407. The Rouge River is designated a cool water Vegetation communities were classified according to the Ecological Land Classification for Southern Ontario: First Approximation and Its Application (Lee et al. 1998). The community was sampled using a plotless method for the purpose of determining general composition of the vegetation. Plant species status was reviewed for the Greater Toronto Area (GTA), the Regional Municipality of York, the City of Toronto (Varga et al. 2000) and for Ontario (Oldham 1999). The status of vegetation communities in Wildlife habitat comprises a blend of urban land uses including areas fully developed for residential, industrial, commercial and institutional uses, active and passive parkland, tableland open space, transportation and hydro/utility corridors and hazard lands. The CNR right-of-way and hydro/utility corridors provide wildlife pathway opportunities and may serve to link locally important units for wildlife occupants. Remnant natural vegetation communities were not noted within the alternative routes TO1793 Markham North South Link Corridor Public Transit Improvements Environmental Assessment 28/02/
70 6 although naturalized conditions have developed within the CNR right-of-way and within watercourse riparian habitat. No significant wildlife habitat was identified or has been reported by others. Resident and summer resident terrestrial vertebrate species encountered as part of this investigation comprise urban tolerant species, generally species which can be categorized as adaptive and/or exploitive of anthropogenic conditions. Wildlife use of the alternative route corridors comprises a range of important life cycle functions; street corridors are frequented by fewer species than off-road corridors (migrants notwithstanding). Boulevard landscaping comprises the most important habitat feature for wildlife within the alternative routes proposed within existing transportation corridors while wildlife uses are more widespread within open space, hazard lands and hydro/utility corridors. Migrant birds were documented throughout the study area within a range of habitats, as may be expected within the settled landscape through Southern Ontario. To date 77 species of birds, 16 species of mammals, four species of amphibians and two species of reptiles have been documented in the study area Rare, Threatened or Endangered Wildlife Species No wildlife species of management concern beyond the local (upper tier municipal jurisdiction) level were noted within the alternative route corridors during field investigations. Twenty birds have been identified by Bird Studies Canada (BSC) as species of conservation priority for the Region of York. Twenty-six wildlife species have been identified by the TRCA as species of concern within TRCA s jurisdiction (TRCA 2003). Six birds and one reptile are protected under the Fish and Wildlife Conservation Act and 62 birds are protected under the Migratory Birds Convention Act. Nine mammals are considered game or furbearing species under the Fish and Wildlife Conservation Act. No terrestrial wildlife listed under the Species at Risk Act or the Endangered Species Act were observed in the larger study area Designated Natural Areas Designated natural areas include areas identified for protection by the OMNR, TRCA and upper tier and lower tier municipalities. The location of designated areas within the broader study area is presented in Figure 3-2 above and further described below Environmental Significant/Sensitive Areas There are no Environmentally Significant/Sensitive Areas (ESAs) located in the vicinity of the alternative routes/preferred alternative routes for the Markham North-South Link Corridor Transitway. One environmentally significant area, Unionville Marsh, is located within the overall study area just west of Kennedy Road and south of 16 th Avenue in the Town of Markham along the Rouge River. Three environmentally significant areas, Milne Woods, East Don Valley Swamp and William s Area, are located just outside the overall study area limits. Milne Woods is located immediately east of McCowan Road between Highway 7 and Highway 407 in the Town of Markham. East Don Valley Swamp is located just west of Leslie Street (and the CNR tracks) between Finch Avenue and Sheppard Avenue along the East Don River in the City of Toronto. William s Area is located just west of Leslie Street (and the CNR tracks) just north of Finch Avenue along the East Don River in the City of Toronto Provincially Significant Wetlands There are no Provincially Significant Wetlands (PSWs) located within the vicinity of the alternative routes/preferred alternative routes for the Markham North-South Link Corridor Transitway. One PSW, Unionville Marsh, is, however, located within the overall study area in the Town of Markham just west of Kennedy Road and south of 16 th Avenue along the Rouge River. Unionville Marsh has also been designated a Life Science Site by the MNR. One PSW, East Don Valley Swamp, is located just outside the overall study area limits in the City of Toronto just west of Leslie Street (and the CNR tracks) between Finch Avenue and Sheppard Avenue along the East Don River Areas of Natural and Scientific Interest There are no Areas of Natural and Scientific Interest (ANSIs) located within the vicinity of the alternative routes/preferred alternative routes for the Markham North-South Link Corridor Transitway. One Life Science ANSI, the East Branch of the Don River, is, however, located just outside the overall study area limits just west of Leslie Street (and the CNR tracks) from just north of Finch Avenue to Sheppard Avenue in the City of Toronto Designated Woodlots Very few woodlots exist within/adjacent to the study area. Hedgerows are located near the watercourses and hydro corridors/highway 407 right-ofway while other small Woodlots/Significant Vegetation Communities exist mainly surrounding the watercourses Natural Corridors The CNR right-of-way, hydro/utility corridors and wooded areas along watercourses in the study area act as corridors/wildlife pathways for wildlife tolerant of an urban environment and may serve to link locally important units for wildlife occupants. These areas allow for wildlife movement along the watercourses to and from more protected areas surrounding the study area such as ESAs, PSWs and ANSIs. The study area is highly urbanized and very few natural areas in locations other than along watercourses are linked together Natural Heritage System According to the Region of York Official Plan, the entire study area is designated an Urban Area. Lands surrounding the Rouge River and its tributaries are designated part of the Regional Greenlands System and the Unionville Marsh is designated an Environmental Policy Area. No designated Significant Forested Lands are located in the overall study area within the Region of York, although two small areas located at the northeast corner of Highway 7 and Kennedy Road and along the Rouge River west of Kennedy Road between 16 th Avenue and Highway 7 are designated Conservation Area Regional Forests. Some of these natural heritage features are connected to other regional natural heritage features to the north of the study area and provide linkages that facilitate wildlife movement within/adjacent to the study area. According to the Town of Markham Official Plan, the land surrounding Woodbine Avenue between Highway 7 and Highway 407 and between just north of Shields Court to just north of John Street is designated Commercial, with the exception of the valley and stream corridors surrounding Beaver Creek which are designated Hazard Lands, Valley Lands and Environmental Protection Areas as part of the Town of Markham s Greenway System. The land surrounding Woodbine Avenue between just north of Highway 407 and just north of Shields Court is designated Parkway Belt West. The remaining land surrounding Woodbine Avenue is designated Industrial. According to the Town of Markham Official Plan, the land immediately west of the hydro corridor (between Woodbine Avenue and Warden Avenue) between Highway 7 and Yorktech Drive and the land immediately east of the hydro corridor between Yorktech Drive and Highway 407 is designated Commercial, with the exception of the valley and stream corridors surrounding the Rouge River and Beaver Creek which are designated Hazard Lands, Valley Lands and Environmental Protection Areas as part of the Town of Markham s Greenway System. The land surrounding the hydro corridor between just north of Highway 407 and 14 th Avenue is designated Parkway Belt West. The remaining land surrounding the hydro corridor is designated Industrial. TO1793 Markham North South Link Corridor Public Transit Improvements Environmental Assessment 28/02/

71 According to the Town of Markham Official Plan, the land surrounding Warden Avenue between Highway 7 and just north of Highway 407 is designated Commercial, with the exception of the valley and stream corridors surrounding the Rouge River which are designated Hazard Lands, Valley Lands and Environmental Protection Areas as part of the Town of Markham s Greenway System. The land surrounding Warden Avenue between Highway 407 and the CNR line is designated Parkway Belt West. The land immediately east of Warden Avenue between Denison Street and Steeles Avenue is designated Urban Residential, with the exception of a very small piece of land located immediately east of Warden Avenue at Epping Court which is designated Institutional. The remaining land, including a small piece of land located just north of Highway 407, is designated Industrial. Hedgerows are located near the watercourses and hydro corridors/highway 407 right-of-way while other small Woodlots/Significant Vegetation Communities exist mainly surrounding the watercourses. Portions of the main branch of the Rouge River and Beaver Creek are also designated Activity Linkage Areas according to the Town of Markham Official Plan. According to the City of Toronto Official Plan, the land located between Pharmacy Avenue, Warden Avenue, Steeles Avenue and McNicoll Avenue, as well as the land located at the northeast and southwest corners of Highway 404 and Sheppard Avenue, are designated part of the City s Natural Heritage System. According to the City of Toronto Official Plan, the majority of the land surrounding the alternative routes/preferred alternative routes is designated Neighbourhoods, with the exception of the area bounded by Steeles Avenue, Pharmacy Avenue, the hydro/utility corridor (just south of McNicoll Avenue) and Highway 404 which is designated an Employment Area. There are also small pockets of land surrounding the alternative routes that are designated Apartment Neighbourhoods, Institutional Areas, Mixed Use Areas, Parks, Other Open Space Areas, and Utility Corridors Contaminated Sites Information on contaminated sites is documented in Appendix I. The analysis focused on the preferred routing identified in the previous chapter consisting of Warden Avenue, Denison Street and Esna Park Drive. A review of data collected through searches of the Ontario Ministry of the Environment databases and publications, the Technical Standards and Safety Authority, research at the Metro Toronto Reference Library, York Region and a visual reconnaissance of the Markham North-South Link route alignment was completed. A summation of properties which TO1793 represent a potential environmental concern to transit route development is presented in Table 6-8. to their mouths at Lake Ontario. All watercourses fall within the jurisdiction of the TRCA and MNR Aurora District. Table 6-8 Total Number of Properties Representing Potential Environmental Concern Figure 6-2 Watersheds and Drainage Total Number of Properties Representing Potential Environmental Concern for the Markham North-South Link Route Alignment Environmental Risk Rating Esna Park Drive Denison Street Warden Avenue Other Total Low Medium High Total The properties identified in the table below lie primarily adjacent to the alignment option listed. Although the properties with a ranked risk for potential environmental concern are listed, the potential for actually encountering environmental affected soils or groundwater within the construction for the transit corridor is unknown at this time. If the ranked properties are found to exhibit environmental degradation, the effects of this degradation may or may not be encountered within the proposed construction since the work may be shallow (e.g. associated with pavement reconstruction), or be outside the immediately affected area (e.g. a spill may be registered for a property, but outside the area of construction). Additional investigation will be required for future design phases of this work Drainage Patterns Watersheds The study area lies within the Don River, Rouge River and Highland Creek watersheds, although the majority of the study area lies within the Rouge River and Highland Creek watersheds. The watersheds and drainage pattern are shown on Figure 6-2. The extreme western portion of the study area (west of Victoria Park Road) lies within the Don River watershed. The northern portion of the study area, generally between Denison Street and Highway 7, lies within the Rouge River watershed. The southern and eastern portions of the study area (east of Victoria Park Road) lie within the Highland Creek watershed. The watercourses within the study area flow generally in a north to south direction from their headwaters in the Oak Ridges Moraine and South Slope Regulatory Flood Lines Fill regulation lines have been established for Rouge River in the study area. The fill regulation lines encompass the flood plain area and are used to define erosion hazard impact zone. The fill regulation line contains the area in which the placing or dumping of fill is regulated by the Conservation Authority in order to control flooding, pollution, and conservation of land. Fill regulation line extensions have been defined by TRCA for the other Markham North South Link Corridor Public Transit Improvements Environmental Assessment 28/02/

72 6 watercourses within the study area however these lines not gone through the registration process and do not have the same legal standing as the registered fill regulation lines. The TRCA regulates all activities within Regulatory flood plain areas, whether currently mapped or not, as well as the lands within Fill Regulation Lines. Therefore, all proposed construction activities involving work that crosses or is adjacent to a watercourse will require approval from the TRCA Water Quality Surface Water Quality and Quantity The aquatic habitat provided by the watercourses is an indication of the current water quality. There are three watercourses in the study area that cross any of the alternative transit routes. Rouge River (cool/warm water), Beaver Creek (cool water) and German Mills Creek (cool water). The Toronto and Region Conservation Authority collects water quality data at a number of locations within the each watershed. The closest stations to the study area are as follows: Station DGM 17.0 German Mills Creek at Steeles Avenue and Leslie Street Station R 9777 Warden Avenue south of Highway 7; Samples are usually taken during dry weather periods and the available data for the two stations covering the period from 1996 to 2001 are summarized in Tables 6-9 and 6-10 below. Parameter Table 6-9 Water Quality at Station #DGM 17.0 Don River, German Mills Creek, Leslie Street south of Steeles Avenue Station # D GM 17.0 (data collected from May 30, 1996 to October 27, 1998) 1 Monitoring Season #Obs Min Max Mean 2 Median Guideln % Meet Guideln E. Coli (counts/100 May - Oct % ml) Water Temp. (ºC) May -Oct % Obs. = observations. i. Samples were not collected during the cold season (Nov.-Apr.) ii. Geometric mean used for E. Coli. iii. Approximate upper threshold for cold water fisheries. Parameter Table 6-10 Water Quality at Station #R Rouge River, Warden Avenue south of Highway 7 Station #R (data collected from June 26, 2001 to May 30, 2002) 1 Monitoring Season #Obs Min Max Mean 2 Media n Guideln % Meet Guideln Suspended May - Oct % Sediment (mg/l) 25.0 Nov - Apr all % Chloride (mg/l) May - Oct Nov - Apr all Phosphorus May - Oct (mg/l) 0.03 Nov - Apr all Unionized May - Oct Ammonia (mg/l) Nov - Apr all Nitrate (mg/l) May - Oct Nov - Apr all Water Temp. (ºC) May -Oct Nov - Apr all Obs. = observations. iv. Prior to 1999 samples were not collected during the cold season (Nov.-Apr.) v. Geometric mean used for E. Coli. vi. Approximate upper threshold for cold water fisheries. 6.3 SOCIAL ENVIRONMENT This Section introduces all aspects pertaining to the Social Environment within the study area. It includes a summary of the land use distribution, the cultural environment and quality of life indicators such as air quality, noise and vibration Land Ownership Patterns Town of Markham The Warden Avenue corridor has, and will continue to evolve in terms of land uses. In general, land uses are more established in the south end of the corridor while the north end of the corridor is still undergoing change. The north end of the Warden Corridor is dominated by Markham Centre. This comprises the land east of Rodick Road to just west of Kennedy Road on the south side of Highway 7. This area is designated as a Regional Centre by the Region of York. For the most part, this land remains vacant, with the exception of a few spots of development on and around Warden Avenue, including the Hilton Suites Toronto/Markham Conference Centre & Spa at 8500 Warden Avenue (500 room facility). On the north side of Highway 7 east of Rodick Road, new medium density residential development is occurring around the Town of Markham s Municipal Offices at the NE corner of Highway 7 and Town Centre Blvd. On the NE corner of Highway 7 and Warden Avenue is the Markham Town Square (179,706 SF). IBM is a major land owner on the west side of Warden Avenue. Hilton Suites, Warden and Highway 7 South of Enterprise Drive and north of Highway 407, major existing developments include Markham Hydro (west side of Warden) and Motorola Lands along the Highway 407 were designated as Parkway Belt West lands in the 1960 s and have generally remained vacant since. Most of these lands are owned by the Ontario Realty Corporation (ORC). South of Highway 407 between Rodick Road and the north-south hydro corridor, there are a select number of industrial land owners including Lafarge (concrete manufacturing), a town storage yard, Magna and Ontario Hydro. Miller Paving owns the majority of lands west of Rodick Road (86 ha.) and has indicated that they are interested in redeveloping their property. Ontario Hydro owns and controls a strip of lands parallel to the north-south hydro corridor and is planning to expand their hydro transformer station in this area. Ontario Hydro is also planning to construct a new transmission TO1793 Markham North South Link Corridor Public Transit Improvements Environmental Assessment 28/02/


73 line from 14 th Avenue north, although the status of this project was uncertain at the time of this EA. Between the parkway belt lands and Denison Street, the majority of lands are zone industrial and have been developed for office and light manufacturing purposes. On the east side of Warden Avenue, tenants/land owners include Wyeth-Ayerst Canada, Eagle Holdings Limited, Bank of Nova Scotia, Telecom Inc and Telus. Major occupants on the east include Novopharm and Erinview Holdings Ltd. One of the most significant developments along Warden Avenue in this area is American Express, who occupy the lands east of Warden and south of McNabb Street. There are currently four vacant parcels of land along Warden Avenue that have the potential for development including the southeast quadrant of Warden and 14ht Ave, the northwest corner of McPherson and Warden, the northeast quadrant of Denison and Warden and a parcel on the west side of Warden Avenue north of Denison. Warden Avenue and 14 th Avenue NW corner South of Denison Street, lands on the west side of Warden Avenue are industrial and similar to those to the north with a wide variety of office and industrial uses. Lands to the east of Warden are privately held residential lots with access from local streets. Just north of Steeles Avenue on the west side of Warden a new shopping plaza has been developed. Along Denison Street, lands are generally occupied by single storey industrial buildings with multiple tenants. Example businesses include: Michelin, MURCorp, PE Enterprises, MCC Enterprises, Small Businesses, CWP Solutions. Denison Street at Warden Avenue North of Steeles Avenue the IBM and Liberty Centre Buildings dominate the landscape on either side of Esna Park Drive. The Liberty Centre site extends from Esna Park to Victoria Park while the IBM site extends from Esna Park to the hydro corridor City of Toronto The preferred alternative for the Markham N-S link is to utilize existing corridors in the City of Toronto to connect with the Don Mills Station on the Sheppard Subway. No changes to existing R.O.W s is planned as part of the undertaking. Accordingly, the level of detail provided here on land ownership patterns is not as detailed as the York Region segments; however there are several land owners that are significant. South of Steeles Avenue, the Bank of Montreal owns a major parcel of land between Victoria Park and Pharmacy Avenue. A large portion of these lands along Steeles Avenue are not occupied by buildings. West of Victoria Park Avenue is what is known as the Steeles Technology Campus. The Steeles Technology Campus is a planned 1.3 million square foot technology office park comprising two existing buildings, two recently completed buildings, 3381 and 3389 Steeles Avenue East, being Phases I and II, respectively and one planned for future development. Further south, the lands between Highway 404 and Victoria Park Avenue, north of the Finch Hydro corridor are referred to as the Gordon Baker Business Park. These lands are home to numerous office towers with tenants such as Sprint, Motorola, Yamaha, Hummingbird, Volvo, Honeywell, Dell, Sony, and CAW. Further south, Seneca College is a major land owner, with its Newnham Campus stretching from Don Mills Road to Highway 404. Finally, at the south terminus of the Markham N-S link, Fairview Mall owned by Cadillac Fairview (2.0 million sq. ft.) a major land use Land Use Designations Regional Official Plan The Regional Municipality of York s Official Plan establishes an urban structure for the region, which is comprised of Regional Centres, which are connected by Regional Corridors, served by rapid transit. Map 5, Regional Structure of the Plan designates the lands located at Highway 7 and Warden Avenue (Markham Centre) as a Regional Centre. The Plan identifies Regional Centres as focal points, which contain concentrations of residential, human service, commercial and office activities. The Plan states that Regional Centres should have the highest concentration and intensity of uses in the Region. In addition, the plan intends designated Regional Centres to be compact, pedestrian oriented, safe and accessible. Map 5 of York Region s current Official Plan designates Highway 7 as a Regional Corridor but not Warden Avenue. The Official Plan does not make specific reference to rapid transit in the Markham North-South Link corridor; however, the conceptual transit network identifies a series of Regional Transit Grid Truck Routes on all major north-south arterials in the corridor. The Commissioner of Planning and Development Services (senior management team) submitted a report to York Region s Planning and Development Committee for their February 5, 2003 meeting entitled Advancing the Region s Urban Structure Policy Principles. This report recommended transit supportive development with the highest densities being located within the Regional Centres. Further it recommended overall densities in the Regional corridors and centres should achieve an average density of 2.5 FSI while simultaneously supporting stable residential communities. The development of high-density uses in Markham Centre will support the introduction of a rapid transit system along the Warden Avenue corridor. Without the development of intensified areas, the extent of potential benefits from the transit system would not be realized. With the principles put in place by the Region, it will ensure that the right form of development takes place that would complement a rapid transit system and the Region should work proactively and not allow for the possibility of lower density development along the corridor. 6 TO1793 Markham North South Link Corridor Public Transit Improvements Environmental Assessment 28/02/
74 Municipal Official Plans Town of Markham The Markham Official Plan (Office Consolidation, January 1999) outlines policies of the Town of Markham in regard to land use planning and development control and establishes a framework for growth management within the context of senior government policies and initiatives and Town objectives. Section 5 addresses policies related to transportation. Transportation policies are guided by two overall goals: a) to develop a transportation system which will provide for the safe, convenient and efficient movement of people and goods and b) to support a balanced transportation system within which there is sufficient public transit service to allow the road network to function at or above capacity. To address these goals the Town of Markham has set out policies for public transit that address transit supportive land use objectives, the use of major transit rights-of-way and/or exclusive lanes, local and high speed bus services, commuter rail services and accessibility for physically challenged persons to public transportation. While the Markham Official Plan references improved transit, it does not specifically discuss the Markham North-South Link, which was not identified until the 2002 Transportation Master Plan. With the exception of Markham Centre, the Official Plan does not envision significant changes in land use for the Warden Avenue corridor. All of the lands South of the Parkway Belt (Highway 407) and north of Denison Street are zoning Industrial in the Official Plan for Markham. Industrial means lands use primarily for manufacturing, assembly, processing, warehousing, or storage, with associated commercial uses allowed City of Toronto The City of Toronto Official Plan provides a basis for managing change through sustainable development in the next 30 years. One of the City s methods of maintaining growth is by improving and putting the existing infrastructure and services to better use. Most of the changes in land use in the City of Toronto in the study area will occur along Sheppard Avenue, which is designated as an Avenue in the context of the Official Plan. Avenues are corridors along major arterial streets where transit-supportive re-urbanization can create new employment and housing and improve local streetscape, infrastructure and amenities. The City of Toronto identifies the Gordon Baker Business Park and Steeles Technology Campus as Employment Areas and the Fairview Mall area as a Mixed Use Area. The majority of the remainder of the corridor is designated as Neighbourhoods Land Use along the Corridor Residential Neighbourhoods Residential uses in the Warden Avenue corridor north of Steeles Avenue are presently limited to the area east of Warden Avenue and South of Denison Street. Within this neighbourhood, residences virtually all single detached homes. Conversely, the Toronto portion of the study corridor is dominated by residential uses with high density apartments along Victoria Park Avenue and Don Mills Road south of the Finch Hydro Corridor. Residential densities are typically highest along the arterials and lower along local streets and collectors. Many single family homes exist along the Don Mills corridor Commercial Areas For the majority of the Warden Avenue corridor, most commercial uses are ancillary to the office and industrial developments. There are several commercial uses, including a grocery store, along Steeles Avenue west of Warden and again along Woodbine Avenue Business Areas A wide variety of business areas exist within the Warden Avenue corridor. Most of the business uses are employment generators consisting of small manufacturing firms, technology centres, financial businesses and servicetype businesses. In addition, there are several major businesses included IBM, American Express and Liberty Health as mentioned previously. Town of Markham staff have indicated that the employment lands in the Warden corridor are highly coveted; in particular the low density industrial buildings are not being built in other areas of the GTA and as a result are in high demand. Not withstanding this, it was indicated that there is some potential for intensifying the uses in the existing employment lands Future Development Plans The majority of future development in the study corridor will take place in Markham Centre. These lands are covered by OPA 21 which refers to the area east of the north-south hydro corridor near Rodick Road, north of Highway 407, west of Kennedy Road and south of Highway 7. OPA 21 outlines the vision for the area, which is to become a mixed-use Town Centre development within a live/work environment. Outside of Markham Centre, there are no major development plans for lands along Warden Avenue, although it is anticipated that development plans will be submitted for the vacant parcels in the near future. A major development that may occur is the Rodick Road Employment Lands. The Town of Markham initiated a study for these lands in In May 2003, staff submitted a draft Official Plan Amendment to re-designate the lands from Parkway Belt West to Industrial. This is reflective of the intent to increase the use of these lands for employment similar to lands to the south Recreation and Tourism Areas The Warden Avenue corridor does not include many recreation uses. Outside of the primary corridor, the Markham Theatre is a major recreation use. It is also anticipated that Markham Centre will include significant recreation and cultural uses. Although not a designated park, the Rouge River corridor is a significant greenspace Services and Utilities The major utilities located in the vicinity of the Warden Avenue alignment have been identified through direct contacts with the respective companies, and these utilities are the following: TransCanada Pipeline; Markham Hydro; Watermains; Sanitary Sewers; Enbridge Gas; Bell Canada; Rogers Cable; Futureway Communications Inc.; Highway 407 ETR Allstream Corporation (formerly AT&T Canada). TO1793 Markham North South Link Corridor Public Transit Improvements Environmental Assessment 28/02/
75 A thorough review of the necessary relocations or modification of utility plants will be undertaken during the detailed design stage. Gas mains, Bell Cable (aerial and buried), Rogers Cable and Hydro are located within the study limits along Warden Avenue, Denison Street, Esna Park Drive and Victoria Park Drive. Watermain, storm sewer and sanitary sewer are located within the R.O.W. of Warden Avenue. Hydro One operates a north-south transmission line west of Warden Avenue. Enbridge Gas operates a 30 inch diameter natural gas pipeline in the Hydro One corridor. Enbridge plans to add an additional 36-inch diameter, extra high pressure natural gas pipeline in this corridor. 407 ETR operates both a fibre optic cable and power distribution system on Warden Avenue and Highway 407 ETR. The main east west fibre optic cable for the 407 ETR crosses Warden Ave on both the north and south side of the structure. 6.4 CULTURAL HERITAGE RESOURCES This section summarizes the main feature of the Cultural Heritage Resources found within the study area. It presents a synopsis of the historical development of the study corridor and identifies built heritage features and cultural landscape units that may be affected by the undertaking. A full report on Built Heritage and Cultural Heritage Landscapes can be found in Appendix F Environmental Assessment & Cultural Heritage Resources The need for the identification, evaluation, management and conservation of Ontario's heritage is acknowledged as an essential component of environmental assessment and municipal planning in Ontario. This analysis of cultural heritage resources in the study area addresses those above-ground, person-made heritage features over 40 years old. The application of this rolling forty year principle is an accepted federal and provincial practice for the preliminary identification of cultural heritage features that may be of heritage value. Its application does not imply however that all built heritage features or cultural landscapes that are over forty years old are worthy of the same levels of protection or preservation. The analysis throughout the study process addresses that part of the Environmental Assessment Act, subsection 1(c), that defines environment to include:...cultural conditions that influence the life of humans or a community ; as well as, any building, structure, machine or other device or thing made by humans. Roadway design and construction may potentially affect cultural heritage resources in a number of ways. The effects may include displacement through removal or demolition and/or disruption by the introduction of physical, visual, audible or atmospheric elements that are not in keeping with the character of the cultural heritage resources and, or their setting Historical Development Overview The British Government bought the territory that became York County from the native Mississaugas in The County, which was created as a territorial unit and electoral division within the Home District in 1792, included the townships of York, Markham and Scarborough. In the 20 th century York Township was subdivided with the creation of the Township of North York as a separate municipality in North York Township became a Borough in the Regional Municipality of York in With the creation of Metropolitan Toronto in 1967, North York and Scarborough became Boroughs within that governmental unit. North York became and a city in Scarborough Township a city in The City of North York and the City of Scarborough became part of the City of Toronto on January 1, Markham Township became the Town of Markham in the Region of York in th Century Development York Township and North York York Township, which was surveyed in 1793, extended from Scarborough Township on the east to the Humber River in the west and from the Lakeshore North in the south to Steeles Avenue in the north. The Town Of York was set aside as a separate municipal entity on the lakeshore to the west of the Don River. As various parts of York Township were amalgamated into the City Of Toronto, the northeast corner of the township thrived as an agricultural community with a few crossroad hamlets such as L Amoreux and O Sullivan s Corners on Victoria Park Road at Finch Avenue and Sheppard Avenue, respectively. Victoria Park Avenue, formerly Dawes Road, was an early north-south land transportation route in the area as well as the boundary between Scarborough Township and York Township. The Zion Primitive Methodist Cemetery (L Amoreaux) was built on the north side of Finch Avenue to the east of Don Mills Road east around The church building was constructed in Scarborough Township Augustus Jones first marked out the front of Scarborough Township for survey in The rest of the township was surveyed between The first settlers located along Kingston Road. The northwest corner of the Township was largely settled from the 1830s onwards as an agricultural area with a few crossroad hamlets. Sheppard Avenue, Finch Avenue, Passmore Road and Steeles Avenue were opened as east-west township roads by the mid 19 th century. The north-south roads of Victoria Park, Kennedy, Pharmacy, Warden and Birchmount were opened for local traffic by the 1870s. Markham Township William Berczy was granted 64,000 acres in Markham Township as part of Lieutenant-Governor John Graves Simcoe s settlement plan for Upper Canada. Under Berczy s leadership German settlers arrived in Upper Canada from New York State and were assigned land in the newly surveyed township by the winter of An immigration initiative of French émigrés under Comté de Puisaye settled in Markham along Yonge Street in Most of the émigrés had returned to France by Pennsylvania German settlers under Peter Reesor s leadership came to Markham in the early 1800s. British and American immigrants began settling in the township circa Most of the land is quickly cleared for agricultural use. Smith s Canadian Gazetteer (1846) describes Markham Township as well-settled, and contains many excellent and well cultivated farms. As transportation improved along Yonge Street along with a growing population, urbanization occurred. By 1857, most of the township had been cleared of timber and the land was under cultivation. Several 19 th century historical hamlets and settlements including Brown s Corners, Unionville, Markham and Locust Hill were established along the present Highway th Century Development For the most part the Townships of North York, Scarborough and Markham remained agricultural in use and retained their rural in character during the first half of the 20 th century. A major intervention in the landscape occurred in the early 20 th century when the Ontario Department of Highways extended Highway 7 easterly from Brampton, through the Townships of Vaughan and Markham and then onto to Highway 12 at Brooklin and Peterborough in At the end of World War II North York still comprised a few small population centres separated by large areas of farmland. This rapidly changed 6 TO1793 Markham North South Link Corridor Public Transit Improvements Environmental Assessment 28/02/
76 6 between 1945 and 1967 as residential suburbs were built at a rapid pace for the families of W.W. II veterans and the influx of immigrants to the Toronto area. The land north from Sheppard Avenue to Steeles Avenue and east from Leslie Street to Victoria Park Avenue was largely developed by the As part of the development Don Mills Road was extended north of Sheppard Avenue between Leslie Street and Woodbine Avenue in the 1940s. The Highland Memory Gardens Cemetery was established to the east of Woodbine Avenue south of Steeles Avenue in Highway 401 was opened through North York in the 1950s and the area to its north was rapidly developed. The residential suburb of Don Mills was developed to the south of the study area by Highway 404 was built in the late 1970s along Woodbine Avenue below Steeles Avenue. Don Mills Road was extended north between Finch Avenue and Steeles Avenue at this time and present entrance to Highland Memory Gardens Cemetery from Don Mills Road was established. In the 1950s the character of the area began to undergo a perceptible change in land use with the development of residential subdivisions, commercial areas and individual residential subdivision. Urbanization along Highway 7 accelerated in the late 1980s and 1990s. The Province of Ontario downloaded significant portions of Highway 7 in Highway 407 was opened in June The responsibility for Highway 7 was transferred to the Region of York from Highway 404 easterly to Highway 48 in Markham in January Cultural Landscapes & Built Heritage Features The Ontario Heritage Act gives the Ontario Ministry of Culture (MCL) the responsibility for the conservation, protection and preservation of Ontario s culture heritage resources. Section 2 of the Ontario Heritage Act charges the Minister with the responsibility to, Environmental Assessments (1980). The Guidelines on the Man-Made Heritage Component of Environmental Assessments state: When speaking of man-made heritage we are concerned with works of man and the effects of his activities in the environment rather than with moveable human artifacts or those environments that are natural and completely undisturbed by man. Both Guidelines state that one may distinguish broadly between two basic ways of visually experiencing cultural heritage resources in the environment, that is, as cultural landscapes and as built heritage features. Cultural landscapes units are a geographical area perceived as a collection of individual person-made built heritage features set into a whole such as historical settlements, farm complexes, waterscapes, roadscapes, railways, etc. They emphasize the interrelationship of people and the natural environment and convey information about the processes and activities that have shaped a community. Built heritage features are individual, personmade or modified, parts of a cultural landscape such as buildings or structures of various types, cemeteries, planting and landscaping structures, etc. The MCL Guidelines describe the attributes necessary for the identification and evaluation of any discrete aggregation of person-made features or cultural landscapes and the attributes necessary for the identification and evaluation of cultural features or built heritage features. Aggregations of individual cultural features usually form areas of homogenous character such as a rural area, a village, and a streetscape, etc. Heritage attributes, in relation to a property, are defined in the OHA as the attributes of the property that cause it to have cultural heritage value or interest Assessment Methodology and Highlights preparation of an existing conditions report for the proposed transitway route alignment; and, evaluation of the impacts to the preferred transitway route alignment alternatives/link Identification of Built Heritage Features & Cultural Heritage Landscapes For the purposes of built heritage feature and cultural heritage landscape identification, this section provides a brief description of the existing environment, the principal built heritage features and the principal cultural heritage landscapes identified within the Markham North-South Link study area Description of the Existing Environment The North-South Link study area is located within two municipalities, namely, the Town of Markham and the City of Toronto, The character of the study is primarily one of late 20 th century urban development consisting of residential, commercial, industrial areas and discrete of parkland or open spaces, and linear transportation corridors such as roads and railway lines. The CN Railway maintains two lines, one freight line crosses east west and a north-south GO Transit line servicing Markham and Stouffville in the study area. Individual 19 th century and early twentieth century buildings of varying types are located within the study area. Usually these cultural heritage resources indicate the location of former 19 th or twentieth farm complexes or historical settlements. Late twentieth century commercial and municipal development and access roads to residential subdivisions are prominent features in the study area....determine policies, priorities and programs for the conservation, protection and preservation of the heritage of Ontario The Ministry of Culture describes heritage buildings and structures, cultural heritage landscapes and archaeological resources as cultural heritage resources. Since cultural heritage sources may be adversely impacted by both public and private land development, it is incumbent upon planning and approval authorities to consider heritage resources when making planning decisions. Two MCL guidelines assist in the assessment of cultural heritage resources as part of an environmental assessment. They are, Guideline for Preparing the Cultural Heritage Resource Component of Environmental Assessments (October 1992), and, Guidelines on the Man-Made Heritage Component of For the purposes of this built heritage and cultural heritage landscape assessment of alternative routes for York Rapid Transit Plan and Markham North-South Link Unterman McPhail Associates undertook the following tasks: the identification of major historical themes and activities of the study area through historical research and a review of historical mapping; the identification of built heritage features and cultural heritage landscape within the Markham North-South Link study area through historical themes and mapping; a windshield survey of the North-South Link study area from to identify any of built heritage features and principal cultural heritage landscape within and adjacent to the study corridor area; and, Description of Identified Built Heritage Features (BHF) and Cultural Heritage Landscapes (CHL) Table 6-11 lists the cultural heritage landscapes and built heritage features that were identified as standing within or beside the preferred alternative route within the Markham North-South Link study area. Generally the cultural heritage features are numbered from north to south and the locations are shown on Figure 6-3: Route Alternative Considered with Existing Heritage Conditions. Three (3) cultural heritage landscapes, all cemeteries, were identified within the preferred alternative route. One (1) built heritage feature, residence, was identified. Table 6-11 Cultural Heritage TO1793 Markham North South Link Corridor Public Transit Improvements Environmental Assessment 28/02/
 On The West Side Of Warden Avenue, North Of 14th Avenue Near The Highway 407 Ramp Entrance. Town of Markham The residence located at No.")
. It Is Located On The East Side Of Warden Avenue North Of Steeles Avenue.")
77 Number Feature 1 2 CHL CHL Type Cemetery Cemetery Figure 6-2 Built Heritage Location/Description The Bethel Cemetery/Lunau Cemetery Is Located N The Town Of Markham (Part Of N.E. ¼ Lot 8, Conession4) On The West Side Of Warden Avenue, North Of 14th Avenue Near The Highway 407 Ramp Entrance. Town of Markham The residence located at No Warden Avenue is listed in Markham Inventory of Heritage Buildings. This information was confirmed in conversation with the Heritage Planner for the municipality. St. John s 5th Line Cemetery (West Part Of Lot 2, Concession 5, Town Of Markham). It Is Located On The East Side Of Warden Avenue North Of Steeles Avenue. 3 CHL Cemetery The Zion Primitive Methodist Cemetery Located (E. ½ Of Lot 21, Concession 3e, City Of Toronto) On The North Side Of Finch Avenue East, East Of Don Mills Road. Ontario Heritage Act Designated Church Building.(1980) 1 BHF Residence No Warden Avenue is listed in Markham Inventory of Heritage Buildings. The building is set back from the road right-ofway. Note: BHF CLU Built Heritage Feature Cultural Landscape Unit Recognized heritage buildings and landscape within the study area noted below and described in Tables 1 and 2. The Ontario Genealogical Society, Toronto Branch, has recorded three cemeteries along the preferred rapid transit alignment. Bethel Cemetery/Lunau Cemetery is located in the Town of Markham (Part of N.E. Lot 8, Conession4) on the west side of Warden Avenue, north of 14th Avenue near the Highway 407 ramp entrance. It was opened in St. John s 5th Line Cemetery (West Part of Lot 2, Concession 5, Town of Markham) is located on the east side of Warden Avenue north of Steeles Avenue. The cemetery is now part of a larger, more recently developed cemetery. Zion Primitive Methodist Cemetery is located (E. of Lot 21, Concession 3E, City of Toronto) on the north side of Finch Avenue East, east of Don Mills Road. The church structure on the site is designated under the Ontario Heritage Act. City of Toronto The Zion Church, which is located at 1650 Finch Avenue East, is municipally designated (December 15, 1980) under the Ontario Heritage Act and is included in the City of Toronto Inventory of Heritage Buildings Public Consultation and Recognition The Town of Markham and City of Toronto were not contacted directly as part of this project. Each municipality was represented on the TAC of the project. All designated and listed heritage buildings within the study area and heritage conservation districts within the study area were noted. Individual heritage features within the heritage conservation districts were included within the noted cultural heritage landscape. There are no national or provincially recognized built heritage features along the preferred alignment alternative in this study area. TO1793 Bethall Cemetery Warden Avenue and Highway 407 Markham North South Link Corridor Public Transit Improvements Environmental Assessment 28/02/

78 6 St. John s 5 th Line Cemetery Warden Avenue and Denison Street Archaeological Resources The detailed report examining the potential for Archaeological resources within the study area is presented in Appendix J Previous Archaeological Research and Retained Sites Three sources of information were consulted in order to compile an inventory of archaeological resources in the vicinity of the study area: the site records for registered archaeological sites (housed at the Ministry of Culture), published and unpublished documentary sources, and the files of Archaeological Services Inc. In Ontario, information concerning archaeological sites is stored in the Ontario Archaeological Sites Database (OASD) maintained by the Ontario Ministry of Culture. This database contains archaeological sites registered within the Borden system. Under the Borden system, Canada has been divided into grid blocks based on latitude and longitude. A Borden Block is approximately 13 kilometres east to west, and approximately 18.5 kilometres north to south. Each Borden Block is referenced by a four-letter designator, and sites within a block are numbered sequentially as they are found. The study area under review is located in Borden Blocks AkGt and AlGt. The assessment only included portions north of Steeles Avenue as no construction is planned in the City of Toronto. According to the OASD, there are no previously registered sites within the study area. A total of twenty sites, however, have been registered within approximately two kilometres of it (Table 6-12). Table 6-12 Archaeological Sites Within ~2 Kilometres Of The Study Area Borden Cultural/Temporal Site Name No. Affiliation Site Type Researcher(s) AkGt-21 Hood Undetermined Precontact Campsite V. Konrad AkGt-53 Alexandra Late Woodland Village ASI* 2001 AkGu-22 Held Undetermined Precontact Campsite V. Konrad AkGu-26 Fieheller Undetermined Precontact Campsite, V. Konrad MPP** 1986 AlGt-194 SLF Undetermined Precontact Isolated Findspot G. Warrick 1991 AlGt-211 CNR Historic Euro Homestead W.B. Stewart 1995 Uxbridge 2 Canadian AlGt-219 J.J. Lunau 1 Historic Euro Homestead W.B. Stewart 1995 Canadian AlGt-235 CNR Historic Euro Homestead W.B. Stewart 1995 Uxbridge 3 Canadian AlGt-236 J.J. Lunau 2 Historic Euro Homestead W.B. Stewart 1995 Canadian AlGt-239 Undetermined Pre Isolated Findspot ASI 1997 contact AlGt-262 Undetermined Pre Isolated Findspot ASI 2000 contact AlGt-263 Undetermined Pre Isolated Findspot ASI 2000 contact AlGt-264 Undetermined Pre Isolated Findspot ASI 2000 contact AlGt-265 Undetermined Pre Isolated Findspot ASI 2000 contact AlGt-266 Undetermined Pre Isolated Findspot ASI 2000 contact AlGt-267 Historic Euro Homestead ASI 2000 Canadian AlGu-24 Nicholson Woodland Village A.J.Clark 1930, MPP 1986,V. Konrad 1972 AlGu-220 Late Archaic Isolated Findspot ASI 1999 AlGu-221 Undetermined Pre Isolated Findspot ASI 1999 contact AlGu-222 Undetermined Pre Isolated Findspot ASI 1999 contact *ASI- Archaeological Services Inc. **MPP Mayer, Pihl, Poulton & Associates The Stage 1 archaeological resource assessment for the York Rapid Transit Program -- Markham North-South Link Transitway determined that although 20 archaeological sites have been registered within two kilometres of the 2.5 kilometre long study corridor, none are immediately adjacent to or within the study area. Additionally, a review of the general physiography and local nineteenth century land use of the study area suggested that it exhibits archaeological site potential. A field review conducted by ASI in July 2005 determined that almost the entire study area is disturbed. Existing roads have typically disturbed urban rights-of-way, and adjacent lands are almost entirely developed as commercial and industrial properties. In light of these results, the following recommendations are made: 1. Prior to any land-disturbing activities in the vicinity of the St. Johns Cemetery on the east side of Warden Street south of the Denison Street intersection (STA ), the construction impact area (Figure 3-1 of Appendix J) should be subject to Stage 3 investigation. Such work would entail the controlled removal of overburden by a Gradall or backhoe equipped with a smooth bucket under the supervision of a licensed archaeologist. If, following shovel-shining of the exposed subsoil, no burial shafts are observed, a recommendation will be made to the appropriate government agencies that the construction impact area be cleared of any further archaeological concern. Alternatively, any earthmoving construction activity in the vicinity should be monitored by a licensed archaeologist. Should any burials be encountered within this area, avoidance of these features should be considered the preferred mitigative option. 2. In the vicinity of the Bethel Lunau Cemetery (STA ), the limit of construction at the top of the ramp should be fenced to avoid impact in the vicinity of the cemetery. Construction impact should extend no further south or west than STA as depicted in Figure 3-9 in Appendix J. 3. With the exception of the concerns regarding the St. Johns and Bethel Lunau Cemeteries detailed above, the balance of the study area (Figures 3-1 to 3-10) does not require any additional archaeological assessment and should be considered free of further archaeological concern. 4. Should deeply buried archaeological remains be found during construction activities, the Heritage Operations Unit of the Ministry of Culture should be immediately notified. 5. In the event that human remains are encountered during construction, the proponent should immediately contact both the Ministry of Culture, and the Registrar or Deputy Registrar of the Cemeteries Regulation Unit, Ministry of Consumer and Business Services. TO1793 Markham North South Link Corridor Public Transit Improvements Environmental Assessment 28/02/
79 6.5 EXISTING NOISE AND VIBRATION LEVELS This Section presents the results of the background noise and vibration monitoring within the study area. The detailed report for these topics can be found in Appendix G Predominant Land Uses From a noise and vibration point of view, the predominant land use within the study area consists of a mix of residential, commercial, industrial, institutional and park/open space land uses. While the majority of the study area below 14 th Avenue is generally built-out, much of the northern portion of the study area is under-development or planned for development. For the most part, the areas adjacent/closest to the Markham North South Corridor along the entire route are characterized by commercial or industrial uses. Residential uses are generally set back from Sheppard Avenue, Finch Avenue and Steeles Avenue. Most of the residential neighbourhoods are typical of newer suburban areas with houses focusing on local streets or backing onto arterial roadways. The study area also contains several business parks as well as older industrial areas situated north of Steeles Avenue between Highway 404 and Kennedy Road. Several office and institutions including elementary and secondary schools, and churches are also located within the study area or along the corridor Approach Used that mitigation be considered if the existing established sound levels at the closest receptor be exceeded by > 5 dba; stationary noise sources be assessed in accordance with NPC-205; construction noise be assessed in accordance with NPC-115; and vibration impact be assessed in accordance with the MOEE/TTC Protocol. Table 3.1 of the detailed report summarizes the key criteria specified in the above mentioned protocols and additional details on NPC-205 and NPC- 115 are included in Appendix A of that report. Information on sound level terminology is also contained in this appendix Traffic Noise Prediction Results for Existing Conditions Table 6-13 below shows the traffic noise prediction results for existing conditions (2003) at the closest receptor location for each of the road segments that were retained for the study for both daytime and nighttime. Table 6-13 Predicted Existing Daytime and Nighttime Traffic Noise Levels Predicted Sound Level (dba) Closest Receptor Distance Location Nighttime Daytime (m) Northeast of Warden Avenue/Cedarland Drive Southeast of Warden Avenue/Denison Street Background/ambient Sound Level Monitoring Results The background sound level monitoring program was carried out in accordance with the procedures specified in Publication NPC-103. The monitoring was scheduled to include weekdays and weekends. However, most of the monitoring was conducted on weekends to obtain conservatively low background levels. The detailed monitoring results are included in Appendix C of the Noise and vibration report. The data indicate that for the most part, daytime (7 am 11 pm) sound levels at the receptors along the Yonge Street Corridor exceeded 50 dba. Even at night time (11 pm 7 am), the minimum measured sound levels were generally higher than 50 dba. The detailed monitoring results are detailed in Appendix G of the main report show the following key trends: consistently high sound levels during the daytime until at least midnight; lowest sound levels were generally recorded between 2 am and 5 am; weekend sound levels were generally lower than weekday sound levels; sound levels were highest for receptors closest to Yonge Street; and the range and distribution of sound levels at the monitoring locations indicate that the sound environment at these locations is typical of a Class 1 Area as defined earlier in Chapter 3. 6 Noise limits applicable to transit development projects are contained in provincial protocols and the Ontario Model Municipal Noise Control By-law. Local municipal noise control by-laws also contain time and place restrictions on construction activities that in turn may have implications for such undertakings. To determine the appropriate noise requirements for this project, meetings were held with the various relevant representatives from the Ontario Ministry of the Environment, including the Ministry s Environmental Assessment and Approvals Branch, Central Region Office and Air and Noise Unit. On the basis of these consultations, and the review of existing protocols for other transit projects, specific protocols for noise and vibration were developed for assessing this project. These are: The table shows high daytime and nighttime sound levels at both receptor locations along the corridor. The high existing noise levels reflect the high traffic volumes on Warden Avenue Sound Level Monitoring at Receptor Locations The monitoring program consisted of 53 and 73 hours of noise monitoring at R1 and R2 in proximity to Warden Avenue as shown on Table 6-14 below. The receptor locations are shown below. The monitoring locations were selected based on their proximity to the preferred route and their potential to be affected by lane realignment on Warden Avenue. Table 6-14 Summary of receptor locations Comparison of Traffic Noise with Measured Background Noise Levels To assess the impact of road traffic noise at the receptor locations, a comparison was made between the measured background sound levels and STAMSON predicted sound levels at the same locations, based on the AADT traffic volumes. Equivalent daytime (16 hrs) and nighttime (8 hrs) Leq sound levels were calculated for all complete days (24 hrs) of monitoring. The results are summarized in Table 6-15 below. for existing/future noise, the impact were established based on the higher of either a daytime limit of 50 dba or existing levels, and that nighttime limits be based on the higher of either 45 dba or existing levels, determined either by traffic noise predictions and/or measurements; Receptor # Address Monitoring Date Monitoring Hours Warden Avenue February Epping Court February TO1793 Markham North South Link Corridor Public Transit Improvements Environmental Assessment 28/02/
80 6 Location 1 Address 8293 Warden Avenue 2 12 Epping Court NA- not available Table 6-15 Comparison of Measured With Predicted Traffic Noise Levels Monitoring Date Measured Equivalent Daytime (16 hr) and Nighttimes (8 hr) Leq Sound Level February February February 7 65 N/A February February February February 7 62 N/A Predicted Leq Sound Levels from AADT Traffic Volumes Closest Receptor Distance (dba) (dba) (m) Day Night Day Night The data in the table show that the predicted daytime and nighttime traffic noise levels are most often within the range of the average measured sound levels at each receptor location, indicating the strong influence of road traffic on existing sound levels. However, as noted earlier, there are other factors which impact existing sound levels including institutional, commercial and industrial buildings in close proximity to the receptors Existing Vibration Levels along Warden Avenue Background noise levels were measured as part of the detailed noise and vibration study at same two locations chosen for vibration measurements. The vibration levels were measured on the ground surface through a mounted accelerometer. The accelerometer was connected to a vibration meter, whose output drove a paper chart. The whole system was calibrated using a Bruel and Kjaer vibration calibrator. The calibrator produces a level of 10 mm/sec velocity at 160 Hz. The vertical vibration at both locations was collected over a 20-minute period. The period included pass-bys (at various speeds) of cars, vans, buses and trucks of various sizes. The results shown in Figures 6.1 through 6.8 in Appendix K present a sample of the collected data. The results show that there are no perceptible vibration levels from existing traffic at the closest sensitive receptor locations along the Markham North South Corridor. Most of the values are well below 0.1 mm/sec. This is as expected since the traffic basically consists of rubberized-tire vehicles and the levels from such traffic is negligible unless there are some anomalies, such as an expansion joint, in the roadbed. The only vibration sensation that was detected by the transducer occurred when the equipment operator tapped adjacent to it. 6.6 AIR QUALITY This section presents a brief description and the results of the air dispersion modelling in order to assess the air quality within the study area. A detailed report on Air Quality Impacts can be found in Appendix K. Air quality is a measure of the number of molecules of a chemical in a given volume of air, namely the concentration of the chemical constituent. In order to assess the future air quality resulting from this project, a two level approach was used. The modelling methodology will be introduced in a later section, Section Existing Environmental Conditions Data on existing environmental conditions was collected and applied in the air dispersion modelling for the study area. These data include: Climate and Meteorological Data; Air Quality Standards; Historical and Measured Air Quality Data; Predicted Atmospheric/Vehicle Emissions; Odours from Diesel Exhaust; and, Greenhouse Gas Emission Climate and Meteorological Data The key parameters of the meteorological and climatological conditions that must be taken into account are wind, temperature and atmospheric structure. Wind Wind fluctuations over a very wide range of time and space scales accomplish dispersion and strongly influence other processes associated with it. There are two significant components direction and speed. Direction Wind direction is reported as the direction from which the wind blows and is based on surface (10 m) observations. Over the course of a year, wind usually blows in all directions, but with varying frequencies. Certain directions occur more frequently than others. These are known as the prevailing wind directions. Figure 6-3 presents a wind rose for Pearson International Airport for the years Wind direction in the area varies considerably over the period. The prevailing winds are from the north and the west, with winds blowing from these sectors approximately 45 percent of the time. A single year of meteorology (2001) was used. The year 2001 was used because it was the base year for the study and it is the same year of traffic counts used for emission calculations. Speed Figure 6-3 Wind Rose for Pearson International Airport Wind Rose Figure 6-3 Wind Rose Toronto for Pearson Int'l International Airport Airport WNW W WSW Wind Direction Frequency (%) NW SW WNW W WSW NNW SSW NW SW N 15 S 10 5 NNE SSE N NE SE Average Wind Speed (m/s) NNW SSW S NNE SSE ENE E ESE NE SE ENE E ESE Percentage of Calms = 5.23 % The concentration of dust in the air decreases with increasing wind speed, as a result of dilution and good dispersion of gases and particles throughout the atmosphere. The distribution of average wind speed at the Pearson International Airport station is presented in Figure 6-3. The average wind speed, based on the period, is 4.0 m/s, with calms (i.e. wind speeds less than 1 m/s) occurring approximately 5% of the time. TO1793 Markham North South Link Corridor Public Transit Improvements Environmental Assessment 28/02/
81 Temperature There are two key temperature effects that influence air quality temperature near the surface and temperature aloft. Temperature Near the Surface Temperature near the surface can greatly affect dispersion of particulates. When it is hot, the surface can dry out making particulate available to be picked up by the wind. Cool temperatures, on the other hand, enable the surface to retain moisture longer, reducing windblown dust. The project location is typical of the Southern Ontario lakes region with relatively cool spring and fall seasons, hot humid summers and cold, wet winters. Temperature Aloft The change in temperature vertically is a key controlling parameter in the dispersion of gases and particles. Atmospheric stability is an inherent feature of the vertical temperature structure. It is a measure of the amount of vertical motion in the atmosphere, and hence the atmosphere s ability to mix pollutants. A stable atmosphere has little vertical motion (is less turbulent) and cannot disperse pollutants as well as a more turbulent, unstable atmosphere. A number of classification schemes have been developed for describing stability classes. The details of the classification schemes can be found in Appendix K Section A statistical summary of the atmospheric stability using the Turner method, based on the results of the PCRAMMET Model (U.S. EPA regulatory meteorological pre-processor) is presented in Table This table outlines the distribution of stability classes for Pearson International Airport for the 1996 to 2001 period. Stable conditions can produce higher concentrations near the ground because of reduced vertical mixing. These conditions occur approximately 30% of the time. Table 6-16 Stability Class Distribution Toronto Pearson Int'l Airport Stability Period Average A B C D E F Atmospheric Structure The structure of the atmosphere is also defined by the vertical temperature change in another fundamental way by setting a limit on the vertical dimension through which pollutants can mix. This vertical extent through which a plume of pollutants can be mixed is called the mixing height. With a higher mixing height there is a larger volume of air available within which the pollutants can mix, producing lower concentrations. With a lower mixing height, the plume may become trapped close to the ground, resulting in higher concentrations. For modelled 1-hour ground level concentrations as opposed to the annual and 24-hour average, mixing height can be very important. The use of variable mixing heights, that are as close as possible to the actual conditions, improves the ability of the model to accurately predict downwind concentrations. Mixing height is calculated from the vertical temperature profile measured by weather balloon ascents. The data measured in Buffalo, the closest upper air station to Toronto, is representative of conditions over Toronto since mixing height is a regional parameter. The surface values and the twice-daily upper air measurements are processed through the U.S. EPA meteorological pre-processor (PCRAMMET) to combine surface and upper air measurements into the hourly mixing heights, which are required by the model. Mixing heights calculated to be less than 10 m, were set to 10 m Air Quality Standards Total Suspended Particulate (TSP) Total Suspended Particulate (TSP), is often used to characterize air quality near a dust source. TSP is measured with a high-volume (Hi-Vol) sampler over 24 hours and consists of particles less than 44 µm in diameter. An annual average is calculated as the geometric mean of these samples measured every six days. Under Ontario Regulation 337, an ambient air quality criterion is set for TSP. The ambient air quality criterion for TSP is 120 µg/m 3 averaged over 24 hours, and the annual geometric mean of the 24-hour samples is 60 µg/m 3. The air quality criteria for TSP are summarized in Table Table 6-17 Provincial Air Quality Criteria for TSP Provincial: Ontario Ministry of the Environment Pollutant Averaging Period Ambient Air Quality Criteria Total Suspended 24 hours 120 µg/m 3 Particulates (TSP) 1 year* 60 µg/m 3 Source: MOE (1999) * Geometric Mean ½ hour POI 100 µg/m 3 The ambient TSP standards and criteria were set to prevent a reduction in visibility. Particles with a radius of 0.1 to 1.0 µm are most effective at reducing visibility. In a rural area where particulate levels are on the order of 30 µg/m 3, the visibility would be about 40 km. At 150 µg/m 3, a common urban concentration, the range would be reduced to about 8 km (NAPCA 1969). The MOE 24-hour criterion of 120 µg/m 3 is based on a visual range of about 10 km. It is noted that TSP was not assessed in detail as part of this study because the larger particles only affect visibility, while PM10 and PM2.5, discussed below, have been associated with health impacts. Fine Particulate Matter PM 10 and PM 2.5 Many studies over the past few years have indicated that fine particulate matter (PM 10 and PM 2.5 ), a mixture of chemically and physically diverse dusts and droplets, in the air is associated with various adverse health effects in people who already have compromised respiratory systems such as asthma, chronic pneumonia and cardiovascular problems. However, the available studies have not been able to link the adverse health effects in such people to any one component of the pollution mix. The current 24-hour regulatory limits for fine particulate matter are presented in Table 6-18 as follows: Table 6-18 Air Quality Criteria for PM10 and PM2.5 Provincial: Ontario Ministry of the Environment Pollutant Averaging Period Guideline Level Ambient Air Quality Criteria PM10 24 hours Ontario Interim 50 µg/m 3 PM hours Proposed CWS 30 µg/m 3 6 TO1793 Markham North South Link Corridor Public Transit Improvements Environmental Assessment 28/02/
82 6 Dustfall In developing an Ambient Air Quality Criterion (AAQC) for dustfall of 7 g/m 2 /30 days, the MOE used soiling data (e.g. surface build-up of dust) from various Ontario towns between 1951 and 1955, which indicated areas of relatively low soiling (11 to 15 g/m 2 /30 days), relatively moderate soiling (17 to 24 g/m 2 /30 days) and relatively heavy soiling (26 to 34 g/m 2 / 30 days) (WHO, 1961). The air quality criteria for dustfall are summarized in Table Dustfall Table 6-19 Air Quality Criteria for Dustfall Provincial: Ontario Ministry of the Environment Pollutant Averaging Period Ambient Air Quality Criteria 1 month 7.0 g/m 2 /30 days 1 year+ 4.6 g/m 2 /30 days Source: MOE (2001a) + Arithmetic Average Criteria Air Contaminants (NO X, SO 2, CO, O 3 ) Criteria Air Contaminants (CACs), including nitrogen oxides, sulphur oxides and carbon monoxide are common air pollutants released into the air typically by activities such as the combustion of fossil fuels. Nitrogen dioxide (NO 2 ) is a reddish brown, highly reactive gas that is formed in the ambient air through the oxidation of nitric oxide (NO). Nitrogen oxides (NO x ), the term used to describe the sum of NO, NO 2 and other oxides of nitrogen, play a major role in the formation of ozone (O 3 ). Sulphur dioxide (SO 2 ) is a colourless gas that smells like burnt matches. It can be oxidized to sulphur trioxide, which, in the presence of water vapour, is readily transformed to sulphuric acid mist. SO 2 can be oxidized to form acid aerosols. SO 2 is a precursor to sulphates, which are one of the main components of respirable particles in the atmosphere. Carbon monoxide (CO) is a colourless, odourless, and at high levels a poisonous gas, formed when carbon in fuel is not burned completely. It is a component of motor vehicle exhaust, which contributes about 60 percent of all CO emissions nationwide. High concentrations of CO generally occur in areas with heavy traffic congestion. Ozone (O 3 ) is formed via a complex, non-linear chain of photochemical reactions involving reactive species of VOCs, NO x and the hydroxyl radical (OH). The amount of O 3 formed depends on the strength of the sunlight, the concentrations of NO x and the availability of OH radicals to drive the reaction mechanisms. O 3 toxicity occurs in a continuum in which higher concentrations, longer exposure duration, and greater activity levels during exposure cause greater effects. Short-term acute effects include pulmonary function changes, increased airway responsiveness and airway inflammation, and other symptoms. The MOE AAQCs for NO x, SO x, CO and O 3 are shown in Table Table 6-20 MOE Ambient Air Quality Criteria for Criteria Air Contaminants Ambient Air Quality Criteria (AAQC) Compound CAS No Annual (µg/m 3 ) 24-hour (µg/m 3 ) 8-hour (µg/m 3 ) 1-hour (µg/m 3 ) Nitrogen Oxides NS 200 NS 400 Sulphur Dioxide NS 690 Carbon Monoxide NS NS 15,700 36,200 Ozone NS NS 134* 165 NS No Standard * Canada-wide Standard Since Ozone is largely driven by regional emissions, it has not been considered in the assessment since any impact from the small transit vehicle increment will be hidden within the error in the larger change to the future baseline Historical and Measured Air Quality Data Table 6-21 outlines the measurement history at the MOE monitoring locations in, or near, the study area, and presents a summary of the parameters monitored. The table shows that historically SO 2 and CO have been well within the accepted standards, while O 3 and PM 10 concentrations have been occasionally observed at values about 50% higher than the standard. NO x and PM 2.5 have exceeded the standard from time to time by as much as double the allowable concentration. In summary, the historical data outlines a reasonably clean airshed with occasional periods during which it is significantly compromised. Pollutant Averaging Time Table 6-21 Historical Air Quality Data Sampling Period MOE Criteria Location #1 Stouffville Works Yard Location #2 Yonge and Hendon Min. Max. Min. Max. SO2 24-hr (µg/m 3 ) ND ND % of Standard 100% 1% 16% O3 24-hr (µg/m 3 )* 82* % of Standard 100% 21% 196% 23% 151% NOX 24-hr (µg/m 3 ) % of Standard 100% 4% 129% 7% 189% CO 1-hr (µg/m 3 ) 36, , ND ND % of Standard 100% 0% 21% 8-hr (µg/m 3 ) 15, , ND ND % of Standard 100% 0% 22% PM10 24-hr (µg/m 3 ) % of Standard 100% 10% 130% ND ND PM hr (µg/m 3 ) ND ND % of Standard 100% 13% 193% Note: * Calculated equivalent 24-hour standard based on 1-hour standard of 165 ND = Do Data Measured Ambient Monitoring Data Figure 6-3 presents the location of the existing MOE, as well as the study initiated, air quality monitoring locations. These locations were used to characterize the existing air quality in the study area by dividing the study area into four zones. These zones are defined as follows: 1. The Stouffville Works Yard Monitoring Location, where the MOE currently has an Ozone (O 3 ) and Weather Monitoring Station (Station 48002), is representative of the area between Highway 48 and York/ Durham Line; 2. The Yonge and Hendon Monitoring Location was co-located with the MOE Station (Station 34020) that measures Sulphur Dioxide (SO 2 ), Ozone (O 3 ), Oxides of Nitrogen (NO x ), Carbon Monoxide (CO) and Fine Particulate (PM 10 ). Measurements at this station will be representative of the air quality along the Yonge Street Corridor from Highway 400 to Highway 404; 3. The #2 Aitken Circle Monitoring Location was sited near the intersection of 16 th Avenue and Kennedy Road and will be representative of the air quality from Highway 404 to Highway 48; and 4. The Woodbine Centre Monitoring Location was sited in the snow removal works yard near the intersection of Highway 27 and Rexdale TO1793 Markham North South Link Corridor Public Transit Improvements Environmental Assessment 28/02/
83 Boulevard. This location will be representative of the air quality between Highway 50 and Highway 400. Pollutant Averaging Time Table 6-22 Summary of Project Air Quality Monitoring MOE Criteria Location #1 Works Yard Stouffville (48002) Location #2 Yonge and Hendon (34020) Location #3 16 th & Kennedy (EAST) Location #4 Woodbine Centre (WEST) Vehicle Emissions Tailpipe emissions from vehicles are a function of many variables. Some of the more important parameters are listed below. SO2 O3 Max. Min. Avg. Max. Min. Avg. Max. Min. Avg. Max. Min. Avg. 24-hr (µg/m 3 ) % of Standard 100% 4% 3% 3% 2% 1% 1% 3% 1% 2% 1% 1% 1% Equiv.24hr based on 30 day sample (µg/m 3 ) % of Standard 5% 4% 5% 9% 8% 8% 7% 5% 6% 11% 10% 11% 24-hr (µg/m 3 )* 82* % of Standard 100% 24% 12% 19% 21% 9% 13% 19% 3% 10% 43% 3% 20% Equiv.24hr based on 30 day sample (µg/m 3 ) % of Standard 359% 336% 349% 297% 260% 272% 297% 263% 279% 278% 266% 273% 24-hr (µg/m 3 ) % of Standard 100% 26% 24% 25% 75% 70% 73% 39% 9% 21% 53% 10% 31% Equiv.24hr based on 30 day sample (µg/m 3 ) % of Standard 37% 35% 36% 121% 108% 115% 79% 76% 77% 136% 0% 87% 1-hr (µg/m 3 ) 36, , % of Standard 100% 1% 1% 1% 2% 1% 1% 4% 1% 1% 2% 1% 1% 24-hr (µg/m 3 ) 50 ND ND ND ND ND ND % of Standard 100% 259% 28% 89% 202% 29% 103% 24-hr (µg/m 3 ) 30 ND ND ND ND ND ND % of Standard 100% 194% 24% 89% 293% 48% 146% 30-day (µg/m 3 ) ND ND ND ND ND ND ND ND ND ND % of Standard 100% 228% 164% age of the vehicle (newer vehicles emit less); number of kilometres which the vehicle has driven; emission control equipment that may have been tampered with; type of fuel (gasoline, diesel); Reid Vapour Pressure (RVP) of gasoline used (adjusted seasonally); ambient air temperature; vehicle speed; rate of acceleration; time spent idling; type of vehicle (automobile, light truck, heavy truck, bus, etc.); and cold or hot start mode. 6 NOX CO PM10 Vehicular emissions predicted are expressed in terms of mass emitted per distance travelled per vehicle and are generally estimated from emission factors in units of mass of contaminant emitted per vehicle, per distance travelled. These emission factors are a function of the length of the road section, travelling speed and vehicle registration distributions. The fleet average emission factors were used for the large-scale simulation in this assessment. Figure 6-4 MOE Monitoring Locations PM2.5 Dustfall (inorganic fraction) Note: * Calculated equivalent 24-hour standard based on 1-hour standard of 165 ND = Do Data Table 6-24 summarizes the emission factors used in the base and future scenario years, for the average Ontario fleet travelling on streets (32.8 km/hr) and highways (66.6 km/hr). Table 6-23 Tailpipe Emission Factors For Vehicles Table 6-22 presents a summary of the data from the project sampling stations in terms of average, maximum, minimum and percentage of the Ambient Air Quality Criteria (AAQC) set by the Province of Ontario. This table confirms the historical data, with SO2 and CO well within the applicable standards. It further shows that PM can be up to 3 times the standard from time to time. This is further confirmed by the dustfall results that show, for the period of sampling, loadings over double the applicable standard. Daily average NOx and O3 concentrations during the monitoring period were below the standard. The data also show, for the Highway 7 Corridor, that NOx levels are equivalent to those in other corridors. These data are used as part of the model characterization of the existing and future scenarios Predicted Atmospheric/Vehicle Emissions Traffic Volumes The rate of contaminant emissions from a section of road is proportional to the number and type of vehicles travelling along that road. Traffic flows for the York Region in general and the Markham North-South Corridor specifically were provided by the York Consortium 2002 for peak morning, peak afternoon and annual average daily traffic (AADT) for the year 2001 and 2003 respectively. For the York Region large-scale modelling approach, the AADT counts for 2001 were used for emission calculations, whereas the 2003 AADT counts were used for the Markham North-South Corridor. Emission factor (g/km) Pollutant Base year (2001) Future year (2021) street highway street Highway CO SO NOx PM Odours from diesel exhaust are generally acknowledged to be associated with aldehyde constituents in the exhaust. These are largely comprised of formaldehyde, but acrolein and possibly acetaldehyde may contribute to the odour as well. Using the fact that diesel odour is associated with formaldehyde (HCHO) and the Internal Combustion Engines Emission TO1793 Markham North South Link Corridor Public Transit Improvements Environmental Assessment 28/02/
84 6 Calculation, the ratios between emission factors for PM10, NOx, CO, SO2 and HCHO were determined for both gasoline and diesel engines. These ratios are: Table 6-24 Ratio Between Emission Factors for Both Gasoline and Diesel Engines Formaldehyde Gasoline Engines Diesel Engines HCOH/PM HCOH/NOX HCOH/CO HCOH/SO These ratios were then used to estimate the HCOH emissions based on the emissions of other pollutants. The maximum emission rate calculated was used as representative of the odorous constituents in order to model odour distribution across the study area Greenhouse Gases For comparison, the estimated CO 2 -equivalent emissions from the Ontario fleet for 2001 are 49,400 kilotonnes and from all sources, approximately 200,000 kilotonnes. The existing CO 2 emissions are approximately 4% of the Ontario fleet CO 2 -equivalent emissions. The introduction of the BRT will result in a net decrease of CO 2 emissions of approximately 54 kilotonnes. Therefore, this project is considered to be of net benefit with respect to Greenhouse Gas emissions, and no further analysis is considered necessary Air Dispersion Modelling Methodology Two-level approach was used to assess the future air quality. The first level, the large-scale approach, examined concentrations of pollutants over the whole study area to delineate any significant patterns or hot-spots. The second level, the small-scale approach, examined an area in more detail if sensitive receptors were found very close to the corridor that might be adversely affected. The modelling results indicate that the maximum concentrations for all pollutants occur at the virtually the same locations for the future base case 2021 scenario as the base scenario. In the case of CO, NO x and SO 2, the predicted concentrations in the future base case 2021 scenario will decrease from 2003 levels. This decrease is attributable to the growth in stringent regulatory emission standards and associated advancements in vehicle pollution control technologies, outpacing the growth in traffic volumes. In the case of PM 10, though actual vehicular emissions will be lower because of improvements in technology, the amount of re-suspended road materials, which accounts for approximately 95% of the total PM 10 emissions, increases due to the higher traffic volumes, thereby creating a higher overall emission Overall Assessment of Air Quality CEAA has provided draft guidance on incorporating climate change considerations in an Environmental Assessment. With respect to greenhouse gases, the guidance document (CEAA, 2003) outlines a procedure for assessing whether greenhouse gas emissions associated with the project are sufficient to be addressed in greater detail within an EA, and whether greenhouse gas management plans would be required. The preliminary scoping involves identifying whether the project s greenhouse gas emissions are likely to be of relatively low, medium or high volumes or intensity. If the project s emissions are likely to be of only low intensity or volume, then there may be no need to conduct further analysis. To determine the intensity of the project s greenhouse gas emissions on the large scale, the CO 2 emissions from the vehicle fleet were estimated using the same methodology described for SO 2, NO x and CO emissions in Appendix K. The vehicle CO 2 emission factor, for the current conditions, is estimated to be g/mile and the CO 2 emission factor, for the future conditions, is estimated to be g/mile. The methane and nitrous oxide emissions from vehicle emissions are only a small fraction of the CO 2 emissions (<3% CO 2 -equivalent) and are considered insignificant. Therefore the analysis presented here discusses only CO 2 emissions Air Dispersion Model Large Scale Approach An atmospheric dispersion model is used along with at least one (1) year of historical meteorological data from a local weather station. This model is to be run twice - once for the existing conditions and a second time, using the same meteorological conditions, to assess any changes that would occur as a result of the project. In order to ensure that the worst-case impact was assessed, it was assumed that the emissions from the day, with the highest emission rate, occurred every day for the entire year modelled. Several atmospheric dispersion models were considered for use in this air quality assessment. The description and assessment of these models can be found in Appendix K. The ISC3 dispersion model was selected for the modelling of the emissions from the regional modelling domain Air Dispersion Model Large Scale Approach To evaluate the potential impact of the Markham North-South Corridor, the same general modelling methodology as the large scale modelling approach was used with a number of refinements. Specifically the refinements included: The existing air quality in the area can be described as fairly good because: the historical SO 2 and CO concentrations are well within all applicable standards; the historical data also shows that PM concentrations can be up to two times the standard from time to time. This was confirmed by project specific sampling that found values up to three times the standard; daily average NOx concentrations, measured during the project sampling, were confirmed to be below the standards, historically there have been occasional exceedances of the O3 standard. This was also confirmed by the additional sampling; and the estimated CO2-equivalent emissions from the Ontario vehicle fleet are 49,400 kilotonnes of a total of 200,000 Kt for all sources. The CO2 emissions from the study area are approximately 4% of the Ontario fleet CO2-equivalent emissions. The estimated annual CO 2 emissions for each scenario are estimated to be: existing 1,906 kilotonnes; future Base Case 2,995 kilotonnes; and future BRT 2,941 kilotonnes. simulating the Corridor with as a series of smaller links, thereby increasing resolution at various sections along the main Corridor; spacing Cartesian receptors at a 200 metre spacing vs 250 metre; introducing a series of discrete / specific receptors at 50 metre spacing running parallel to either side of the Corridor TO1793 Markham North South Link Corridor Public Transit Improvements Environmental Assessment 28/02/

85 7. PLANNING AND DESIGN PARAMETERS 7.1 RAPID TRANSIT DESIGN OBJECTIVES As with all York Region rapid transit corridors, rapid transit services and infrastructure in the Markham N-S Corridor will be designed to provide the essential features for its role as an important new member of the family of transit services available to the Region s communities, as defined in the Transportation Master Plan. This family is intended to comprise: Local services through neighbourhoods and business districts using conventional buses of various sizes; Rapid Transit service operating on a regional network fed by local services and inter-connected with commuter services and rapid transit in Toronto and adjacent regions; Long distance inter-regional commuter service provided by GO Transit buses and trains. The primary objectives in designing the rapid transit infrastructure and service are to achieve the following: A flexible, permanently integrated high-performance system with a strong customer-oriented identity; An integrated assembly of elements appropriate urban environment for current and future market(s) to be served; High service speeds offering superior travel times competitive with those of the private automobile; Demonstrated service reliability providing high frequency (an average wait of 5 min) and a high degree of on-time performance; Comfort and convenience by providing a smooth ride, level boarding in a user-friendly, quality station environment, easy transfers between systems and innovative fare pre-payment and passenger information services; Environmental compatibility manifested by reductions in energy use, pollution, noise and visual intrusion as well as environmentally sensitive urban design. The key components of the Markham N-S rapid transit link are as follows: An exclusive two-lane, at-grade transitway that uses the centre median of the existing Warden Avenue right-of-way to enable rapid transit services with no loss of current traffic capacity; with continuation of this service south to the Sheppard Subway in existing corridors, with buses operating in mixed traffic until future dedicated corridors become available. High-frequency BRT or LRT service of 3 minute headway or less during peak travel periods; Transit signal priority to speed the movement of transit vehicles through busy intersections and limited stops (at major cross-roads only) to improve overall travel times; Attractive transit stations, designed and landscaped for integration with the surrounding communities, which are primarily large commercial properties; Access facilities at stations to encourage and support pedestrian and bicycle modes of transportation; Proof-of-payment fare policy and systems to speed passenger boarding and facilitate smart card technology; Real-time passenger information displays at stations and on-board vehicles; Intelligent Transportation Systems (ITS) technology to track vehicles and interface with transit priority measures for reliable service; Integrated communications to increase public awareness and overall ridership with a corresponding decrease in automobile use. 7.2 DESIGN CRITERIA As described in Chapter 5, rapid transit facilities in the Markham N-S Corridor will comprise of surface rapid transit only and there are no plans for grade separated technologies. Surface rapid transit could include Bus Rapid Transit (BRT) or Light Rail Transit (LRT). This section outlines the basic criteria adopted for the planning and design of the main components of the facilities for surface rapid transit technology. Transitway alignment geometry will influence the system riding quality, especially for standing passengers. The design aims to provide alignments which reduce sags, crests and directional changes to a minimum, consistent with reasonable economy. In developing the rapid transit alignment, consideration must be given to the following: Safety; Alignment standards; Sight distance and visibility; General appearance; Passenger comfort; Impact on at-grade Crossings; Intended operating and service plan; Adjacent roadways and railways; Vehicle performance; Impact on adjacent property; Underground and overhead utilities; Cost-effectiveness; Horizontal and vertical clearances; and Type of construction General Description of Surface Rapid Transit The ultimate surface rapid transit system is one in which predominantly exclusive rights-of-way with on-line stations are provided for the use of the rubber-tired vehicles delivering the service. These rapid transit vehicles can operate on and off the rapid transit right-of-way and therefore offer the opportunity to link certain feeder and line haul express services to reduce the need for passengers to transfer. Wherever practical, station designs will allow vehicles to pass other vehicles that are picking up and dropping off passengers. This means that skip stop and express services can be combined with local stopping services in the same right-of-way. The typical operating configuration consists of a high frequency service running the full length of the corridor and stopping at each station. On top of this service various express services can be overlain and, where appropriate, services can be started or terminated off of the transitway. Passengers access the service as they would an any rapid transit service by walking or cycling to the stations, transferring from feeder buses and by using park-and-ride and pick-up/drop-off facilities where provided. In addition, some trips could be made without a transfer Principal Design Criteria Table 7.1 and Table 7.2 summarize the principal design criteria adopted for the development of alternative designs for transitway facilities for LRT and BRT respectively. 7 TO1793 Markham North-South Link Corridor Public Transit Improvements Environmental Assessment 28/02/

86 7 Table 7-1 Summary of Geometric Design Criteria for BRT CRITERIA Preferred min./max. Absolute min./max. Design Speed Transitway between stations 90 kph 40 kph Design Speed Station and Business Dist. Areas 50 kph Design Speed - Arterial Ramps and Access Roads 40 kph Stopping Sight Distance: 90 kph design speed 60 kph design speed 236 m 84 m Minimum Horizontal Curve Radius, Transitway 200m 50 m Minimum Horizontal Curve Radius, Stations and CBD 120m 50 m Minimum Horizontal Curve Radius, Access Ramps 45 m Minimum Horizontal Curve Radius in Maintenance Facility 30m 15m Minimum Turning Radii at Intersections 25m 15 m Maximum Transitway Superelevation (above 50 kph) 7% Maximum Superelevation at Stations 2% Minimum Tangent at end of Station Platforms 20 m 14 m Maximum Grade of Transitway 3% 7% Minimum Transitway Grade between Stations 0.5% 0.35% Maximum Grade in Stations 0.5% 4% Transitway Grade: Access Roads and Ramps 6% 10% Minimum Grade in Stations 0.5% 0.3% Table 7-2 Summary of Geometric Design Criteria for LRT CRITERIA Preferred min./max. Absolute min./max. Minimum Radius of Curcular Curves: On Running Line 250 m 100 m In Stations Tangent 800 m In Yards 50 m 35 m Minimum length of circular curves Design Speed (V) /2 35 m Minimum length of spiral curves, the greater of the following: - considering roll rate or - considering vehicle torsion - considering lateral acceleration 8.75Ea x V 14 m 14 m 14 m 400Ea 6.45 Eu X V Minimum length of tangent between spiral curves 100 m 25 m Minimum length of tangent preceding a point of switch 15 m 10 m Minimum length of tangent beyond the ends of platforms 20 m 15 m VERTICAL ALIGNMENT Maximum gradient: On running line In stations 4.5% 0.3% 6.0% 0.5% Minimum grade on running lane 0.3% 0.0% Minimum length of vertical curves 100 m 60 m Maximum length of vertical curves m Maximum applied superelevation on running track (Ea) 110 mm 130 mm Maximum unbalanced superelevation on running track (Eu) On running line In turnouts Ea = LRT superelevation Eu Unbalanced superelevation 75 mm 100 mm 90 mm 7.3 STATION DESIGN FEATURES The stations are normally unattended and their design will emphasize passenger safety, convenience, comfort, low maintenance and accessibility. The station location and layout will facilitate convenient transfer between the Rapid Transit service and local service and also to any pick-up/drop-off facility, where provided. Stations will be fully accessible to persons with disabilities and configured to allow convenient access by pedestrians and cyclists. Where appropriate, space for bike lockers will be identified adjacent to sidewalks near key stations. Stations are normally spaced such that the majority of walk-in passengers walk less than 400 m to and from the station; however, some passengers can be expected to walk further if they are coming from the lower density industrial sections of the corridor. For the 4.5 km portion of the line north of Steeles Avenue, there are six stations providing an average station spacing of 0.9 km. The preferred station layout consists of two parallel side-loading platforms preferably offset head-to-head on either side of an intersection or mid-block pedestrian crossing as illustrated in Figure 7-1. Passenger shelters, benches, system maps, real-time passenger information and other amenities are provided on each platform. All designs emphasize durability and minimal ongoing maintenance needs. 7.4 FARE COLLECTION The facilities provided at the stations will be those required for a fare system based on the off-board purchase of passes and tickets. Provision for pass and ticket dispensing machines and sufficient space for totally offboard fare collection in a protected environment wherever practical is a requirement of the station design. Figure 7-1 Typical Two-Lane Exclusive Transitway Warden Avenue TO1793 Markham North-South Link Corridor Public Transit Improvements Environmental Assessment 28/02/
87 8. DEVELOPMENT AND SELECTION OF PREFERRED DESIGN 8.1 EVALUATION METHODOLOGY In order to select the Technically Preferred Design for the undertaking the following methodology was adopted: Each primary route alternative was developed to a level that allowed all benefits and effects to be determined; For each of the route alternatives, section design alternatives were developed; Segment route/section alternatives were evaluated against a set of Objectives corresponding to the five objectives identified in Chapter 5; For each primary objective, Goals were developed as factors considered important in choosing between alternatives; For each factor, quantifiable and qualitative Indicators were identified; The Objectives, Goals and Indicators were distributed to the project team and TAC members (as part of the overall rapid transit EA process) and comments received to ensure that they were appropriate. The input of discipline subconsultants was of paramount importance to ensure that the indicators reflected the effects of the alternatives as they relate to the discipline; An evaluation methodology was developed to rank alternatives; The evaluation was conducted by the project team and presented to the TAC members in summary form prior to presentation to the public; The evaluation was presented in summary form to the public for review; A Preferred Design was then selected. The evaluation process ranked each alternative in terms of the indicators using a relative ranking between alternatives. An overall most responsive alternative was then chosen for each objective by summarizing the degree to which each of the goals and objectives were met. A general synopsis of route evaluation findings was tabulated for each objective to explain the rationale behind the selection. This included a description of the advantages and disadvantages of each alternative and its merits regarding the objective and goals. 8.2 EVALUATION OBJECTIVES, GOALS AND INDICATORS Table 8-1 Evaluation Objectives, Goals and Indicators Objectives and Goals Typical Indicators measuring route s ability to achieve goals Measure PROTECT AND ENHANCE SOCIAL ENVIRONMENT Minimize adverse effects on and maximize benefits for adjacent Number of properties affected communities Potential for traffic infiltration Subjective based on design plans Maintain or improve road traffic and pedestrian circulation Number of properties with access restricted Availability of turning movements at intersections Change in pedestrian pathways Subjective Maintain a high level of public safety & security in the corridor Number of locations with potential to decrease public safety Ease of access for emergency vehicles Subjective Minimize adverse noise and vibration effects Number of residences impacted by sound or vibration Analysis based on background report Minimize adverse effects on cultural resources Number of built heritage features displaced or disrupted Analysis based on background report Minimize disruption of community vistas and adverse effects on street and Visual impact on people living and working in area neighbourhood aesthetics Subjective PROTECT NATURAL ENVIRONMENT Minimize adverse effects on Aquatic Ecosystems Potential effect on watercourses and fish habitat Analysis based on background report Minimize adverse effects on Terrestrial Ecosystems Potential effect on wildlife habitat (loss of habitat area) Analysis based on background report Improve regional air quality & minimize adverse local effects Potential effect on air quality Analysis based on background report Minimize adverse effects on corridor hydro geological, geological and Potential effect on groundwater hydrological conditions Subjective PROMOTE SMART GROWTH/ECONOMIC DEVELOPMENT Minimize adverse effects on business activities Number of businesses with entrances/exits affected Number of businesses with parking lost Subjective based on aerial photos Protect provisions for goods movement Ability for trucks to access commercial/industrial areas Subjective based on Traffic Analysis Opportunities for re-development Promote transit-oriented development Potential opportunities for development and higher order uses at Subjective based on land use inventory stations, terminals and along the corridor TO PROVIDE AN EFFECTIVE TRANSPORTATION SERVICE Ability to maintain adequate level of service for road vehicles Volume to capacity ratios, Intersection level of service Analysis based on background report Maximize convenience of access to rapid transit system Ease of access to stations Subjective based on design profiles MAXIMIZE COST-EFFECTIVENESS OF RAPID TRANSIT Minimizes capital costs Estimate of the cost of capital works including running way, stations, $ systems and major utility relocation works. Minimizes cost effects of/on adjacent properties Area of property required Area Minimizes adverse effects of alignment characteristics on operating and Influence of alignment characteristics on operating and maintenance Subjective maintenance costs costs 8 The following table presents the Evaluation Objectives, Goals and Indicators used in the evaluation of alternative methods for the location of the transitway. TO1793 Markham North South Link Corridor Public Transit Improvements Environmental Assessment 28/02/

88 8 8.3 DEVELOPMENT OF SEGMENT ALIGNMENT ALTERNATIVES In Chapter 5, three basic route alternatives were developed and compared and the Warden Avenue route alternative was selected as the preferred alternative. No changes to infrastructure south of Steeles Avenue are proposed. Therefore this section develops and evaluates alternative methods for providing rapid transit within the Warden Avenue Corridor as well as the Denison Street Corridor, which is used as an east-west connector to existing routes in the City of Toronto. As characteristics vary along the Warden Avenue corridor, alternative methods were developed for five sections as follows: Segment A Highway 7 to Enterprise Drive: This is the area were the Markham N-S Link Corridor will interface with the Highway 7 Corridor, which utilizes Enterprise Drive through Markham Centre. As alignment alternatives north of Enterprise Drive are assessed as part of the Highway 7 Transitway EA, the environmental impacts of these alignments are not developed in this EA. However, potential routing options using the Highway 7 Transitway are discussed. Segment B Enterprise Drive to 14 th Avenue: Alternatives related to different cross-sections for Warden Avenue. Segment C 14 th Avenue to Denison Street: Alternatives related to different cross-sections for Warden Avenue. Segment D East/South Connecting Routes: Two alternative routes are initially developed and assessed followed by alternative cross-sections for the preferred route. Segment E Denison Street to Steeles Avenue: This section provides a possible connection to future City of Toronto rapid transit networks Segment A Preferred Alignment and Potential Future Opportunities The Technically Preferred route for the Highway 7 Transitway (separate EA) is to travel across Warden Avenue on Enterprise Drive to a new dedicated transit facility that would swing north into Town Centre Boulevard. Stations would be located east of Warden Avenue as well as in front of IBM opposite IBM s private access road. The extension of Enterprise Drive across Warden Avenue and the Rouge River valley, nor any potential environmental impacts, is not considered part of the Markham N-S Link. The most direct route to connect the Markham N-S Link into the Highway 7 Transitway is to do so at the intersection of Warden Avenue and Enterprise Drive with the station just east of Warden Avenue being used for passenger transfer. This alignment has been selected as the preferred design. However, at such time as the Highway 7 Transitway connection across Warden Avenue becomes available, other routing options using these corridors may be pursued for the Markham N-S Link. Figure 8-1 illustrates a potential concept that would provide for the integration of the Markham N-S Link and the Highway 7 Transitway while providing improved access for IBM. This routing option would utilize the IBM ramp and the new extension of Enterprise Drive as follows: Northbound vehicles would travel through Enterprise Drive to the existing IBM ramp and then circle back south to the proposed Highway 7 Transitway station across from IBM. Vehicles would then continue east on the Highway 7 Transitway Corridor. Southbound vehicles would travel across Warden Avenue following the Highway 7 Transitway, then east on Cedarland Drive, turning south in mixed traffic on Warden Avenue and into the dedicated transitway south of Enterprise Drive. As this alignment option would be using existing/future infrastructure, no approvals would be required under the EA process (other than those for the Highway 7 Transitway). Other approvals, including permission to use the privately owned IBM Ramp would be sought. It is noted that a preliminary investigation of the structural capacity and geometric design of the IBM ramp was conducted by Marshall Macklin Monaghan in This preliminary analysis concluded that the ramp had been designed to handle the load of an articulated bus and that horizontal clearances were sufficient. There is presently a height restriction on the ramp to discourage large vehicles Segment B Alternative Methods There are basically two alternatives for providing rapid transit in the Warden Avenue corridor across Highway 407 as illustrated in Figure 8.2. Alternative (B1) would widen Warden Avenue to provide for the additional median transit lanes while maintaining the planned 6 lanes for regular vehicles. Alternative B2 would maintain the ultimate configuration of 6 lanes; meaning that the soon to be constructed additional vehicle lanes would be utilized for rapid transit. Both of these alternatives were developed fully and carried forward for detailed evaluation. Figure 8-1 Preferred Alignment and Potential Future Opportunities Segment A Highway 7 to Enterprise Drive Stations for this segment would be located at Enterprise Drive (east of Warden) and at 14 th Avenue. An intermediate station could be provided in the future to connect with the planned long term Highway 407 transitway, although this is not considered part of the preferred design. More details on this station are provided in Section TO1793 Markham North-South Link Corridor Public Transit Improvements Environmental Assessment 28/02/
89 Alternative B1: Median Transitway plus 6 traffic lanes As discussed previously in Chapter 6, Warden Avenue will be widened to 6 lanes from north of Highway 7 to 14 th Avenue in There is sufficient property to widen Warden Avenue further to provide for dedicated transit lanes while maintaining six lanes for regular vehicles. This alternative would require modifications to the Warden Avenue and Highway 407 ramps, specifically the E-N/S Ramp and the N-W Ramp. It would also involve extending the existing fill sections and potentially providing retaining walls in some sections. In this alternative, both the Highway 407 bridge and the CN bridge would be widened by one additional lane in each direction, beyond the planned near term widening (for the CN structure). Any changes to these structures would require a legal agreement between York Region and 407 ETR and York Region and CNR Alternative B2: Median Transitway plus 4 Traffic Lanes Property impacts of the widening alternative are not significant as most of the segment is currently fronted on either side by vacant land and the Parkway Belt/Highway 407 corridor. As noted in Section , it will be important to review the changes in traffic patterns and growth on this segment prior to implementing any road widening, given the many development and road network changes that are expected to take place over the next few years Segment C Alternative Methods As with Segment C, two basic alternatives were evaluated for this segment as illustrated in Figure 8.3. A major difference is that construction has not been slated for widening Warden Avenue to six lanes south of 14 th Avenue, although it is identified in York Region s ten-year capital plan. Therefore, two alternatives were developed fully and carried forward for detailed evaluation: an alternative where Warden Avenue is widened for rapid transit only and an alternative where Warden Avenue is widened for rapid transit plus two additional lanes for regular vehicles. this section, it would be difficult to provide for six traffic lanes plus a transitway without significant property impacts. Assuming a 5 m boulevard, m each and a 6.8 m transitway, the required R.O.W. width would be 39.6 m. Therefore, on average, an additional 2.6 m would be required. This is significant since many properties have parking areas that abut the existing R.O.W. Based on the evaluation, Alternative C2 is preferred because: The traffic level of service analysis indicates that projected future traffic demand could be accommodated with 4 through lanes in this segment; Providing 6 lanes plus a transitway would have significant property impacts and associated costs, and would limit the amount of space that is dedicated to pedestrians. South of Steeles Avenue Warden is four lanes only and this may limit the amount of traffic that would benefit from the widened lanes to the north. This alternative would essentially use the additional pavement width provided by the planned near term widening for the dedicated median transitway. No major modifications would be required for the Highway 407 ramps and the existing/planned structures would remain six lanes Alternatives Evaluation Findings and Recommendation Evaluations were performed comparing Alternatives B1 and B2 and are presented in Table 8.2. Because both alternatives follow the same basic alignment, the alternatives are fairly similar for most criteria. The evaluation essentially is a trade-off between additional costs and minor property impacts with the widening alternative vs. reduced level of service for road vehicles for the nonwidening alternative. Based on the evaluation, Alternative B1 is preferred because: Traffic level of service analysis indicates that significant congestion would occur in peak hours if only two through lanes of traffic are provided in each direction and this may be a limitation to growth in the corridor and in Markham Centre. Taking-away traffic capacity in the future may have effects in terms of spill-over to other routes, as well as access for goods movement to the industrial areas. Stations for this segment would be located at McPherson Street/McNabb Street and at Denison Street. The station at McPherson/McNabb is located closer than the desirable spacing of 1-2 km for efficient BRT operations; however, it represents a primary catchment area being located near American Express Alternative C1: Median Transitway plus 6 traffic lanes This alternative would provide for 6 through lanes plus left turn lanes at major intersections. Dedicated rapid transit lanes would be provided in the median resulting in a total effective width of eight lanes Alternative C2: Median Transitway plus 4 Traffic Lanes This alternative would utilize the planned roadway expansion width to provide for the dedicated median transit lanes. No additional road capacity would be provided beyond what exists presently. The total effective width would be six lanes including the transitway Alternatives Evaluation Findings and Recommendation Alternatives C1 and C2 were compared using detailed criteria as summarized in Table 8.3. As with the northerly segment, the evaluation is a trade-off between traffic capacity and costs/property impacts. Because the R.O.W. is only 37 m in 8 TO1793 Markham North South Link Corridor Public Transit Improvements Environmental Assessment 28/02/

90 ALTERNATIVE B1 - Median Transitway plus 6 traffic lanes 8 ALTERNATIVE B2 - Median Transitway plus 4 traffic lanes MARKHAM NORTH-SOUTH LINK PUBLIC TRANSIT IMPROVEMENTS ENVIRONMENTAL ASSESSMENT FIGURE 8.2 TO1793 Markham North-South Link Corridor Public Transit Improvements Environmental Assessment 28/02/
91 Table 8-2 Evaluation of Alternatives- Segment B Objectives and Goals Alternative B1 Median Transitway Plus 6 lanes Alternative B2 Median Transitway Plus 4 lanes PROTECT AND ENHANCE SOCIAL ENVIRONMENT Minimize adverse effects on and maximize benefits for adjacent communities Maintain or improve road traffic and pedestrian circulation Maintain a high level of public safety & security in the corridor Requires property from commercial developments at Warden/14 th Lack of road capacity may cause motorists to seek other routes, potentially through Minimizes potential for traffic infiltration residential areas (e.g. Birchmount) Provides capacity for regular vehicles to access area Allows for exclusive SB right turn at Warden Avenue/14 th Avenue Congestion will reduce road vehicle access Requires modifications to Highway 407 ramps Higher traffic volumes and potentially higher traffic speeds Higher density of traffic makes cycling more difficult Minimize adverse noise and vibration effects Increase in noise is expected to be marginal, no vibration impacts Increase in noise is expected to be marginal, no vibration impacts Minimize adverse effects on cultural resources Reconfiguration of ramps avoids Bethel Cemetery, but construction will be required in close proximity No known built heritage features or archeological features within R.O.W. affected Minimize disruption of community vistas and adverse effects on street and neighbourhood aesthetics PROTECT NATURAL ENVIRONMENT Minimize adverse effects on Aquatic Ecosystems Wider roadway is less aesthetically pleasing for pedestrians; however, adjacent development in this section is limited by Highway 407 corridor. More compact and visually acceptable cross-section Route does cross any watercourses Widening Warden Avenue may help avoid widening of parallel streets with more significant watercourses Route does cross any watercourses Minimize adverse effects on Terrestrial Ecosystems No significant habitat area effected No significant habitat area effected Air quality is improved over existing situation Congestion may increase localized emissions Improve regional air quality & minimize adverse local effects Air quality is improved over existing situation due to introduction of transit Minimize adverse effects on corridor hydro geological, geological and hydrological conditions Increase in stormwater quantity over existing No impact beyond approved road widening PROMOTE SMART GROWTH/ECONOMIC DEVELOPMENT Minimize adverse effects on business activities All entrances/exits are at signalized intersections All entrances/exits are at signalized intersections Protect provisions for goods movement Additional road capacity improves access for trucks Capacity restrictions will cause delays for trucks Promote transit-oriented development PROVIDE AN EFFECTIVE TRANSPORTATION SERVICE Vacant land parcels including Rodick Road employment lands may be developed to take advantage of transitway. Wider roadway width reduces space for pedestrians Vacant land parcels including Rodick Road employment lands may be developed to take advantage of transitway. 8 Ability to maintain adequate level of service for road vehicles Satisfies corridor demand to at least 2021 Maximize convenience of access to rapid transit system MAXIMIZE COST-EFFECTIVENESS OF RAPID TRANSIT Pedestrians required to walk across more lanes Reduces width available for potential future integrated station with Highway 407 transitway Projected link volumes will exceed capacity Significant back-ups will occur at Warden and 14 th Avenue Stations accessible for pedestrians Presence of congestion may reduce access for park and ride, drop-off Minimizes capital costs $28.5 million excluding vehicle costs $7.1 million excluding vehicle costs Minimizes cost effects of/on adjacent properties No property required other than from Hwy 407 corridor Retaining walls are required to minimize impacts of fill on existing properties No property required Minimizes adverse effects of alignment characteristics on operating and maintenance costs Operating and maintenance costs for regular traffic lanes will increase with widening Operating costs are less relative to alternative B1 Technically Preferred Alternative LEGEND: Least Responsive Most Responsive TO1793 Markham North South Link Corridor Public Transit Improvements Environmental Assessment 28/02/

92 ALTERNATIVE C1 - Median Transitway plus 6 traffic lanes 8 ALTERNATIVE C2 - Median Transitway plus 4 traffic lanes MARKHAM NORTH-SOUTH LINK PUBLIC TRANSIT IMPROVEMENTS ENVIRONMENTAL ASSESSMENT FIGURE 8.3 TO1793 Markham North-South Link Corridor Public Transit Improvements Environmental Assessment 28/02/
93 Table 8-3 Evaluation of Alternatives- Segment C Objectives and Goals Alternative C1 Median Transitway Plus 6 lanes Alternative C2 Median Transitway Plus 4 lanes PROTECT AND ENHANCE SOCIAL ENVIRONMENT Minimize adverse effects on and maximize benefits for adjacent communities Maintain or improve road traffic and pedestrian circulation Requires property from most land uses Minimizes potential for traffic infiltration Minimal impacts Provides capacity for regular vehicles to access area Allows for additional turning lanes Isolated congestion may reduce access for vehicles Maintain a high level of public safety & security in the corridor Higher traffic volumes and potentially higher traffic speeds Higher density of traffic makes cycling more difficult Minimize adverse noise and vibration effects Increase in noise is expected to be marginal, no vibration impacts Increase in noise is expected to be marginal, no vibration impacts Minimize adverse effects on cultural resources No known built heritage features or archeological features within R.O.W. affected No known built heritage features or archeological features within R.O.W. affected Minimize disruption of community vistas and adverse effects on street and neighbourhood aesthetics PROTECT NATURAL ENVIRONMENT Minimize adverse effects on Aquatic Ecosystems Wider roadway is less aesthetically pleasing for pedestrians; however, adjacent development in this section is limited by Highway 407 corridor. More compact and visually acceptable cross-section Route does cross any watercourses Widening Warden Avenue may help avoid widening of parallel streets with more significant watercourses Route does cross any watercourses Minimize adverse effects on Terrestrial Ecosystems No significant habitat area effected No significant habitat area effected Improve regional air quality & minimize adverse local effects Air quality is improved over existing situation Air quality is improved over existing situation Minimize adverse effects on corridor hydro geological, geological and hydrological conditions Slight increase in stormwater quantify Slight increase in stormwater quantify PROMOTE SMART GROWTH/ECONOMIC DEVELOPMENT Minimize adverse effects on business activities One (1) property affected One (1) property affected Protect provisions for goods movement Additional capacity improves access for trucks No significant impacts Promote transit-oriented development PROVIDE AN EFFECTIVE TRANSPORTATION SERVICE Vacant land parcels may be developed to take advantage of transitway. Wider roadway width reduces space for pedestrians Vacant land parcels may be developed to take advantage of transitway. Ability to maintain adequate level of service for road vehicles Satisfies corridor demand to at least 2021 Satisfies corridor demand to at least 2021 Isolated congestion may occur in peak hours Maximize convenience of access to rapid transit system Pedestrians required to walk across more lanes Reduced road width compared to Alternative C1 MAXIMIZE COST-EFFECTIVENESS OF RAPID TRANSIT 8 Minimizes capital costs $24.1 million excluding vehicle costs $14.1 million excluding vehicle costs Minimizes cost effects of/on adjacent properties Property required from all properties No property required Minimizes adverse effects of alignment characteristics on operating and maintenance costs Operating and maintenance costs for regular traffic lanes will increase with widening Operating costs are less relative to alternative C1 Technically Preferred Alternative LEGEND: Least Responsive Most Responsive TO1793 Markham North South Link Corridor Public Transit Improvements Environmental Assessment 28/02/
94 Segment D Alternative Methods Segment D is where the transitway turns easterly and southerly to connect with existing City of Toronto transit corridors. It is an important connection through the Markham employment lands and is also the transition to routes in the City of Toronto. Based on the preliminary screening of route options in Chapter 5, Denison Street is the preferred corridor for the rapid transit system. Initially, the Steeles Avenue corridor was also examined, but this was eliminated from consideration early on due to the close proximity of residential uses on the south side and the inability to widen the road for transit. Along Denison there are two possible north-south connecting routes: Esna Park Drive and Victoria Park Avenue, as shown on Figure 8.4. Each of these alignment alternatives were developed as generic facilities (i.e. with or without dedicated transit lanes) and evaluated. A second evaluation was conducted to compare the advantages and disadvantages of a dedicated transitway vs. an option that would utilize existing lanes Alternative D1: Denison Street to Esna Park Drive From Warden Avenue, this alternative would extend west on Denison Street to Esna Park Dr and then south on Esna Park Drive, continuing south across Steeles Avenue to Pharmacy Avenue. This alignment follows the planned VIVA Phase 1 routing. It was selected for VIVA Phase 1 because it bisects two large employment centres on Steeles Avenue IBM Canada and the Liberty Centre. An advantage of maintaining the VIVA Phase 1 alignment for the future rapid transit service is that the infrastructure for stations will be in place and VIVA Phase 1 will have built a ridership base along this alignment. In addition, it would be beneficial to have more certainty on the location and timing of new infrastructure in the City of Toronto before altering alignments north of Steeles Avenue Alternative D2: Denison Street to Victoria Park Avenue From Warden Avenue, this alignment alternative would extend west on Denison Street to Victoria Park Ave, then south on Victoria Park Avenue across Steeles Avenue. The Victoria Park alignment is advantageous in that it provides a direct connection to Victoria Park Avenue south of Steeles Avenue, which is identified as a transit priority route in the City of Toronto Official Plan. There are also two undeveloped parcels of land west of Victoria Park north of Steeles Avenue that could incorporate transit-supportive development Alternatives Evaluation Findings and Recommendation Based on the advantages and disadvantages of the two local routing options, Alternative D1 is preferred because: It bisects two major developments, IBM and Liberty Centre, maximizing ridership potential; It reduces capital costs by maintaining VIVA Phase 1 stations; It provides consistency for riders that will be established from the VIVA Phase 1 routing Segment D Alternative Cross-Sections For the preferred alignment, two alternatives were considered for locating the transit service, one with a dedicated median and one involving mixed traffic operations. These alternatives are illustrated in Figure 8.5. An option that involved taking two of the regular traffic lanes and converting them to dedicated transit lanes was not considered as there is already a congestion problem in the peak hours Alternative D1 (a): Denison/Esna Park with Transit in mixed traffic except at approach to Warden This alternative consists of mixed traffic operations with Queue Jump lanes on Denison Street at Warden Avenue Denison/Esna Park with median transitway plus 4 lanes of general traffic This alternative consists of an exclusive two-way median transitway in the centre of the roadway with eastbound and westbound vehicular traffic either side of the transitway. This option would maintain four lanes for regular traffic as exists today Alternatives Evaluation Findings and Recommendation Widening Denison Street to provide for a full median transitway would provide the best service for rapid transit. However, it would have significant impacts on adjacent properties as additional R.O.W. would be required. In many cases, the only parking for adjacent buildings is abutting the R.O.W and any further widening would impact this parking. As most properties on Denison Street have direct access to the street, introducing a dedicated transitway in the median would have significant impacts on business access, with drivers having to incur significant out-of-way travel. Based on an analysis of traffic volumes, and visual observations, traffic on Denison Street is highly peaked and during off-peak hours there are no capacity concerns. Considering the impacts on adjacent properties and the lack of serious congestion problems outside of relatively short peaks, the preferred alternative is to operate the rapid transit system in mixed traffic on Denison Street and Esna Park Drive, but mitigate any traffic capacity issues by providing queue jump lanes. Specifically, transit vehicles would access a median transit lane between Hood Road and Warden Avenue, which would allow them to by-pass eastbound traffic queues approaching Warden. It should be noted that the preferred undertaking would not preclude widening of Denison Street or Esna Park Drive in the future should it be justified to expedite transit Segment E Alternative Alignment In the evaluation and selection of potential routing options presented in Chapter 5, Warden Avenue was chosen as the preferred routing. In the short term, Denison Street was the preferred routing for the east-west connection to Pharmacy Avenue and Gordon Baker Road (to connect with the VIVA Phase 1 alignment) and existing/future City of Toronto transit corridors. In the longer term, it would be logical to connect surface rapid transit routes using Warden Avenue north of Steeles Avenue to potential future rapid transit services in the City of Toronto, specifically the planned extension of the Sheppard Subway and a potential rapid transit network in the Finch Hydro corridor. For this reason, the preferred undertaking includes the portion of Warden Avenue between Denison Street and Steeles Avenue in the Region of York. This segment could augment or replace the routing using Denison Street and Esna Park Drive. Within the City of Toronto, the system could operate in mixed traffic or potential future dedicated lanes. The impacts of providing dedicated transit lanes on Warden Avenue between Denison Street and Steeles Avenue are detailed in the next Chapter, which describes the Preferred Undertaking. TO1793 Markham North-South Link Corridor Public Transit Improvements Environmental Assessment 28/02/

95 8 ALTERNATIVE D1 Denison/Esna Park ALTERNATIVE D2 Denison/Victoria Park MARKHAM NORTH-SOUTH LINK PUBLIC TRANSIT IMPROVEMENTS ENVIRONMENTAL ASSESSMENT FIGURE 8.4 TO1793 Markham North South Link Corridor Public Transit Improvements Environmental Assessment 28/02/

96 8 D1 (a) Denison/Esna Park with Transit in mixed traffic except at approach to Warden D1 (b) Denison/Esna Park with median transitway plus 4 lanes of general traffic MARKAM NORTH-SOUTH LINK PUBLIC TRANSIT IMPROVEMENTS ENVIRONMENTAL ASSESSMENT FIGURE 8.5 TO1793 Markham North-South Link Corridor Public Transit Improvements Environmental Assessment 28/02/
97 Table 8-4 Evaluation of Alternatives- Segment D Objectives and Goals Alternative D1 (a) Denison/Esna with Transit in Mixed Traffic Alternative D1 (a) Denison/Esna with median transitway plus 4 lanes of general traffic PROTECT AND ENHANCE SOCIAL ENVIRONMENT Minimize adverse effects on and maximize benefits for adjacent communities Requires small amount of property at transition point to Warden Avenue, all other properties are unaffected Maintain or improve road traffic and pedestrian circulation Maintains left turn access to all properties Maintain a high level of public safety & security in the corridor Buses would not be segregated from regular traffic, thereby increasing conflicts Required R.O.W. widening would impact surface parking areas for several properties, with limited opportunities to replace parking Median transitway would restrict limit left turn access into businesses, pedestrians would be discouraged from crossing at mid-block locations Buses are segregated from regular traffic, reducing conflicts Requires vehicles to make U-turns at intersections, potentially reducing safety Minimize adverse noise and vibration effects Increase in noise is expected to be marginal, no vibration impacts Increase in noise is expected to be marginal, no vibration impacts Minimize adverse effects on cultural resources No changes required to pavement width No known built heritage features or archeological features within R.O.W. affected Minimize disruption of community vistas and adverse effects on street and neighbourhood aesthetics No change in road profile or cross-section R.O.W widening would reduce available boulevard width PROTECT NATURAL ENVIRONMENT Minimize adverse effects on Aquatic Ecosystems Route does cross any watercourses Route does cross any watercourses Minimize adverse effects on Terrestrial Ecosystems No significant habitat area effected Street trees would be impacted Improve regional air quality & minimize adverse local effects Negligible change in emissions at local level, overall air quality is improved due to mode shifts to transit Slightly less congestion than mixed traffic option Minimize adverse effects on corridor hydro geological, geological and hydrological conditions No Change in stormwater quantity from existing Additional lanes would increase run-off PROMOTE SMART GROWTH/ECONOMIC DEVELOPMENT Minimize adverse effects on business activities No change from current operations Median transitway would reduce access R.O.W expansion would impact parking supply for employees and customers Local access for trucks would be more onerous due to access restrictions; turning radii at intersections may be reduced due to median intrusions Protect provisions for goods movement Maintains access for trucks Promote transit-oriented development Absence of permanent infrastructure does not create incentives for development/redevelopment Provides permanent transit service for development to focus on PROVIDE AN EFFECTIVE TRANSPORTATION SERVICE 8 Influence on transit service, speed safety and ride comfort Buses will be delayed by regular traffic Buses are not impacted by congestion and high speeds can be maintained Ability to maintain adequate level of service for road vehicles Regular vehicles may be delayed by buses, but impacts are likely to be small Maximize convenience of access to rapid transit system Pedestrians required to walk across more lanes Allows for full median transit stations MAXIMIZE COST-EFFECTIVENESS OF RAPID TRANSIT Minimizes capital costs $4 million excluding vehicle costs $22 million excluding vehicle costs Maintains current number of traffic lanes but forces vehicles to make left turns at signalized intersections. Additional left turns at signalized intersections will impact level of service. Minimizes cost effects of/on adjacent properties No property required Property is required from all adjacent properties; costs will be incurred to replace parking supply lost Minimizes adverse effects of alignment characteristics on operating and maintenance costs Operating costs limited to stations Operating and maintenance costs for regular traffic lanes will increase with widening Technically Preferred Alternative TO1793 Markham North South Link Corridor Public Transit Improvements Environmental Assessment 28/02/
98 9. THE PREFERRED DESIGN 9.1 DESCRIPTION OF THE PREFERRED DESIGN Figure 9-1 Preferred Alignment and Station Locations From analyses and evaluations of alternative transportation solutions, alternative methods and alternative designs, a dedicated facility for rapid transit service located along the existing Warden Avenue was recommended as the preferred design alternative. The service would connect to similar services in the Highway 7 corridor and also connect to existing rapid transit services in the City of Toronto along existing routes. The length of dedicated transitway would extend from Enterprise Drive south of Highway 7 to Steeles Avenue. The Region is requesting Environmental Assessment Act (EAA) approval for: A median transitway on Warden Avenue between Enterprise Drive and Denison Street that will initially utilize BRT technology with potential conversion to LRT subject to ridership demands; Transit operation in mixed traffic from Warden Avenue, west on Denison Street to Esna Park Drive, south on Esna Park Drive across Steeles Avenue to Pharmacy Avenue; and The protection of the right of way on Warden Avenue south of Denison Street to Steeles Avenue for potential future transit expansion. The preferred design is shown in Plates M-1 to M-8 at the end of this chapter. Figure 9-1 illustrates the overall alignment and station locations. The following is a description of the main components of this design solution: A two lane median transitway from Enterprise Drive to Denison Street; Stations including appropriate amenities located at arterial or major collector east-west roads at: Enterprise Drive (considered under Highway 7 transitway EA) 14 th Avenue/Alden Road McNabb Street/McPherson Street Denison Street Esna Park Drive In addition, the preferred transit routing would connect to existing VIVA Phase 1 stations at: Steeles Avenue Gordon Baker Road/McNicoll Avenue Seneca College Note: Preferred alignment south of Steeles Avenue will be confirmed upon completion of future studies of potential transit improvements by the City of Toronto/TTC. 9 The cross-sections for the transitway are shown in Figures TO1793 Markham North South Link Corridor Public Transit Improvements Environmental Assessment 28/02/


99 Figure 9-2 Typical BRT Transitway Cross-section 6-lane Traffic with 1.0 m Raised Median Figure 9-3 Typical LRT Transitway Cross-section 6-lane Traffic with 1.0 m Raised Median 9 TO1793 Markham North South Link Corridor Public Transit Improvements Environmental Assessment t 28/02/


100 Figure 9-4 Typical BRT Station Cross-section 6-lane Traffic with Left Turn Lane Figure 9-5 Typical LRT Station Cross-section 6-lane Traffic with Left Turn Lane 9 TO1793 Markham North South Link Corridor Public Transit Improvements Environmental Assessment 28/02/


101 Figure 9-6 Typical BRT Transitway Cross-section 4-lane Traffic with 4.0 m Streetscape Median Figure 9-7 Typical BRT Station Cross-section 4lane Traffic with Left Turn Lane 9 TO1793 Markham North South Link Corridor Public Transit Improvements Environmental Assessment t 28/02/

102 9.1.1 Transitway Elements There are two basic cross-sections for the dedicated transitway one with six traffic lanes for the segment north of 14 th Avenue and one with four traffic lanes for the segment south of 14 th Avenue. The preferred design generally maintains all existing left turn lanes at intersections. Similarly, where dedicated right turn lanes are currently provided, these are maintained for traffic capacity reasons. Warden Avenue differs from the other York Region Rapid Transit facilities on Yonge Street and Highway 7 in that the majority of the properties do not have direct access onto Warden Avenue; access is provided via side streets. There are only two driveways were left turn access is provided to or from Warden Avenue. This results in very efficient operation of the rapids transit, and Warden Avenue as a whole, as there are no conflicting turning movements across the transitway. Lane Widths: Warden Avenue is a relatively new road and consists of a typical urban cross-section. The existing cross-section (prior to widening north of 14 th Avenue) includes two m lanes in each direction and a centre left turn lane in some locations. These will be replaced with 3.5 m transit lanes, 3.5 m general purpose traffic lanes and 3.75 m curb lanes. A 300 mm width rumble strip is proposed to delineate and provide separation between the transit and general purpose lanes. The transit lanes and the traffic lanes are proposed flush next to each other so as to facilitate crossing of emergency vehicles and for easier snow clearance in the winter. Existing boulevard and sidewalks will be maintained, generally providing a 5.0 m or greater boulevard width. Where it was not possible to provide a 5.0 m boulevard within the existing R.O.W. small strips of property will be required. Urban Design Principles: The following are some of the Urban Design Principles on which the current planning design or future detail design should be based on: Consistency and Coherency: to avoid a circumstantial and inconsistent look to the corridor it is important to establish a consistent cross-section and curb line. The corridor should also communicate a legible and understandable look that clearly puts forward the idea of transit as the future. Identity: The transit system should be broken down into subsystems that have their own character and sense of place that riders can identify with. Green Technology should be the principle on which amenities should be designed to such as solar power for everything from lighting, to ticket dispensing to heating of bus shelters. Landscaping and tree planting are identified as essential in portraying a green image. Environment: A range of climate issues can be dealt with through careful planning, e.g. trees can be planted to provide shelter from the wind and shade for pedestrians as well screening from the road for adjacent buildings. Trees also act as a solid body for air pollutants to settle on and therefore reduce negative effects in the atmosphere. The type of materials and colour in paving the transitway itself and the sidewalks, splash strips, etc. should be carefully chosen to reinforce the identity and character of the transitway that is proposed. Network: The transitway is part of a complex network reflecting how people move through the community. The linkages that connect private vehicles, drop off, Park n Ride, bicycles, local transit buses, GO buses, etc. to the future transitway should be designed with an integrated approach making the experience of transitioning to transit services efficient and effortless. Signage: A consistent approach to all types of signage, directional, proprietary advertising, etc. should be developed for the corridor to minimize visual clutter and the chronic symptom of competitive sign wars. Snow Plowing: The clearing, storage and removal of snow along traffic and transit lanes must be carefully planned. A generous splash and storage strip must be provided on the sidewalk side of the curb. Streetscaping: One of the main features of the preferred design is that it maintains the existing number of traffic (i.e. four lanes) lanes south of 14 th Avenue as opposed to providing six lanes plus a transitway. In this regard, the design is maximizing opportunities for streetscaping. In the section between 14 th Avenue and Enterprise Drive, the corridor is mainly taken up by the Highway 407 corridor and the associated ramps and there are few places where pedestrians would interact with surrounding development. At the outset of developing the preferred design, a number of options were considered for providing a landscaping plan within the corridor: a median landscape area with transit either side; two landscape areas either side of the transitway separating the transit from the roadway; a minimal separator in the median (1 metre) with landscaping at the outer curb areas only; Maximizing landscaping opportunities in the boulevard combined with landscaping in the median at transitway stations. Consistent with the overall rapid transit development program, the preferred alternative is to maximize median landscaping opportunities by providing a 4.0 m landscaped median between the two transitway lanes. Because of R.O.W. limitations combined with the relatively short length of the corridor, there are only two opportunities were a landscaped median could be provided: a mid-block location between Denison Street and McNabb/MacPherson Street and a mid-block location between McNabb/MacPherson Street and 14 th Avenue. Figure 9-8 illustrates a typical station layout and landscaping opportunities. Figure 9-8 Station Layout and Landscaping Opportunities. 9 TO1793 Markham North South Link Corridor Public Transit Improvements Environmental Assessment 28/02/

103 Other items: These included street lighting, emergency vehicle access and public art. For street lighting it was stressed that light spillage is to be avoided and excess light reduced. For public art it was articulated that the design components, such as paving, light standards, benches, stations, etc. should include the provision for a rich variety of public art that will express community character throughout the corridor. Emergency Response Services (ERS) Considerations: Presently, Warden Avenue has no restrictions in the median for emergency vehicle access. However, most emergency vehicle access routes within sites are access from side streets or parallel streets. Under the preferred design, two median sections will be introduced on Warden Avenue between Denison Street and 14 th Avenue, each resulting approximately 200 m of roadway where emergency vehicles cannot cross from one side to another. In the section between Denison Street and McNabb Street, there is one property on the east side that has an access onto Warden Avenue. At this location, it would be appropriate to include a break in the median to allow southbound emergency vehicles to access the east side of Warden Avenue. Figure 9-9 illustrates this concept. On all other sections, emergency vehicles will be able to cross the transitway at any location with the exception of the approaches to intersections where median stations are placed Horizontal Alignment Horizontal alignment for the new transitway generally follows the existing alignment (or the approved for construction alignment north of 14 th Avenue). The following considerations were made in developing the horizontal alignment for the preferred design. Between the Highway 407 and 14 th Avenue, Warden Avenue will be widened to both sides. Between the Highway 407 E-N/S Ramp and the CN Bridge, the alignment was shifted to the east as much as possible to accommodate the proposed design for the Highway 407 Transitway and to minimize impacts on the Highway 407/Rodick Road Employment Lands. At 14 th Avenue, the alignment was centred in the R.O.W. to minimize impacts on adjacent properties. At Warden Avenue and Denison Street, the alignment and intersection design was developed to avoid impacts on the St. Johns/5 th Line Cemetery south of Denison. The vertical alignment design criteria for BRT running ways and stations are met in all cases Intersection Design Intersection design has been undertaken in accordance with the Geometric Design Manual for Ontario Highways. There will be two locations were intersections require the ability for vehicles to make a U-turn to access properties along Warden Avenue: Warden Avenue at Denison Street and Warden Avenue at McPherson/MacNabb Street. These intersections have been designed to allow for the use of a WB17 truck to make a U-turn with signal protection, providing access to the Beaver Lumber Entrance. Non-signalized intersections have been designed to maintain existing turning radii. Right and left turn lanes with appropriate lengths have been incorporated into the design based on traffic needs. Property will be acquired as part of the highway/transit improvements to provide for adequate day-lighting triangles for all the intersections Structures There are two structures along the Warden Avenue that will require changes to accommodate the transit lanes. These are: 9 Figure 9-9 Proposed Median Access for Emergency Vehicles (Warden Avenue north of Denison Street) Vertical Alignment and Pavement Widening Vertical alignment for the Warden Avenue transitway will follow the vertical profile of the existing road. In order to obtain good ride quality and the required service speeds for transit smooth profiles must be obtained for the median transit lanes. A best-fit vertical profile has been designed to allow for this. Additional pavement width is required for the dedicated transit lanes and the stations resulting in general widening of the curb lines as well as some local right-of-way widening. Pavement depths for the transit lanes may be different from those of the traffic lanes as well as the landscape median. With the above changes in mind it is anticipated that complete reconstruction of the cross-section is required. Whenever possible right-ofway widening or impact on commercial properties including parking has been avoided by the construction of retaining walls or other grading measures to limit impacts. The proposed vertical alignment generally conforms to an 80 km/hr design speed for general purpose traffic. Vertical alignment standards for BRT as stated in Chapter 7 are met. The Warden Avenue Bridge over Highway 407; The Warden Avenue Bridge over the CN York Subdivision; The following is a description of how the transit lanes are proposed to cross either on these structures: a) The Warden Avenue Bridge over Highway 407 at Station Currently, the Highway 407 Bridge is a two span prestressed precast concrete girder bridge providing 3 lanes of travel across the bridge in each direction plus sidewalks on both sides (See Figure 9-10). Minor medications will be made to the lane geometry on this bridge with the widening of Warden Avenue in 2005; specifically the outside lanes presently taper into the Highway 407 ramps and will need to be modified provide for through travel. The proposed undertaking would widen the Highway 407 structure to provide for three lanes of travel in each direction plus a median transitway. This would require changes to three of four on-ramps. Ramp terminals and signalized intersections would remain in the same location. It is noted that TO1793 Markham North South Link Corridor Public Transit Improvements Environmental Assessment t 28/02/
 The Warden Avenue CNR bridge structure over the York Subdivision railway line at Station 11+400 This structure is presently a three span prestressed precast concrete girder bridge providing 2")


104 any changes to the structure would require a legal agreement between York Region and 407 ETR prior to any construction operations being undertaken. b) The Warden Avenue CNR bridge structure over the York Subdivision railway line at Station This structure is presently a three span prestressed precast concrete girder bridge providing 2 lanes of travel in each direction plus sidewalks on both sides (See Figure 9-11). This bridge is planned to be widened to six lanes in As with the Highway 407 structure, the proposed undertaking involves adding two additional lanes to this structure to accommodate the median transitway. The preferred design requires widening of the deck on the east side to accommodate the new lanes. This widening could be accommodated by extending the piers and abutments and adding additional girders to support the wider deck. Because of the width of the deck, it may be necessary to split the deck into two segments. New girders should be designed to match the stiffness of existing girders. All future design and construction will be subject to the Ontario Highway Bridge Design Code (OHBDC) and to CN Rail review. As this structure is constructed on a fill section, retaining walls are required on the embankments to avoid impacts on adjacent properties. Figure 9-10 Warden Avenue Crossing Highway 407 Figure 9-11 Warden Avenue Crossing CN York Subdivision Modifications to Existing Highway 407 Interchange All directional ramps and ramp terminals will have to be modified in order to accommodate the road widening. All of the modifications are minor and will not affect the areas where tolling equipment exists. Without extensive widening to the existing bridge, it is not possible to provide parallel tapers for the inner loop ramps and as a result the preferred design utilizes direct tapers. Far-side stops, with the end of the passenger platform located as close to the pedestrian crosswalk as possible; Distinctive, modular shelters to provide weather protection and contribute to the visual identity of the system; Provision for amenities including fare collection equipment, signage, system maps and real-time passenger information. The station precinct includes the station site itself and consideration of how pedestrians access the transit service from the local neighbourhood. This includes the sidewalk system, crosswalks and signage and wayfinding systems. The identity of the system and the access to the system are clearly defined by the various prototype elements. Far-side stations allow vehicles to pass through signalized intersections before stopping at the platform, minimizing lost time at signals and minimizing vehicle-pedestrian interfaces. This also places the vehicle beyond the crosswalk so that passengers leaving the station do not interfere with the vehicle s departure. Modular shelter design allows for a consistent image to be created through a design that is responsive to the level of passenger usage. The platform area is a consistent size across the system, designed to allow for two vehicles to be stopped at any given time. The shelter is sized based on anticipated station loads and can be expanded as the system grows. Any proposed works would require review and approval of 407 ETR as well as the Ministry of Transportation. This review will include peer review design and safety by 407 ETR's Independent Auditor Stations Station designs were developed based on the criteria established for the overall rapid transit development program. The objective was to develop a typical or prototype station that incorporated a set of common elements that would create a clear identity and allow for ease of installation and maintenance. The prototype station includes: Consideration of the station precinct and the connections to the local community as part of the station development; Fare collection equipment, signage and system maps and information will be presented in a similar manner at each station. This predictability of information and placement enhances the passenger s experience. In many newer transit systems art is incorporated into the stations through stand-alone or integrated art. This provides an opportunity to enhance the 9 TO1793 Markham North South Link Corridor Public Transit Improvements Environmental Assessment 28/02/
105 9 public s perception of the system and increases the level of safety and security. This art can reflect the current or historical context of the station of community. In many cases the art at several stations is linked into a common theme to provide variation yet allow for a complete story to be told. Integrated art has become the more common method as stand-alone art generally requires more space and is seen as distinct from the station whereas integrated art joins the function of the station with the aesthetic. The prototype station consisting of a median platform will be used at the four stations along the dedicated transitway section (Enterprise Drive, 14 th Avenue/Alden Road, McNabb Street/McPherson Street, Denison Street). For the segments utilizing mixed traffic, stations will be located at the curbside to the rear of the sidewalk. These stations will utilize smaller shelters, but will include the same basic features as the main proto-type stations Park and Ride Facilities Although integration with YRT local services as feeders is a primary objective, the Region s rapid transit plan includes the installation of parking facilities wherever practical and cost-effective, to encourage access to the system by the private car. The Region is committed to a parking need assessment and management study during the preliminary design phase to perform an operational review on feeder services, to determine the requirements for parking spaces and how these required parking spaces will be provided and implemented. During the detailed design phase of the project, local municipalities and, where opportunities exist, private property owners will be consulted to identify potential locations for park-and-ride facilities. Options to be investigated could include vacant land owned by municipalities, shared use of municipal parking lots or garages, sharing of commercial parking lots and joint development in the vicinity of key transitway stations. On the Warden Avenue alignment, the location with the highest potential for a park and ride station is the Highway 407 corridor. As discussed below, the Province has also identified this as a potential stop for the proposed Highway 407 Transitway. The integration of the Markham N-S link with this system at Warden Avenue is discussed below. Park and rides facilities will be implemented in accordance with site planning and EA regulatory requirements. Any new separate facilities will be subject to the requirements of a Class or individual EA as appropriate. The Region will not assume that parking spaces will be available on GO Transit-owned lands at the GO Unionville Station. There are presently two bus bays designated for York Region Transit vehicles in the Fairview Mall/Don Mills Station. Typically, with a five minute headway, one platform would be required for bus layover. The VIVA 1 service operates at a 10 minute headway and will share a platform with some YRT services. With the introduction of increased frequencies, a new platform bay may be required. It is expected that with the introduction of new north-south rapid transit services, other TTC and YRT services will be eliminated or re-structured providing additional space at Don Mills Station. The TTC has also recently cut back on some routes serving Don Mills Station providing spare capacity Integration with Potential Future Station on Highway 407 Transitway In 1998, the MTO conducted a transit strategy study along Highway 407 Corridor. The long term plan is to operate buses on a fully exclusive transitway that generally parallels Highway 407. This transitway would cross Warden Avenue just south of Highway 407 in the Parkway Belt, with a station proposed for the lands to the west of Warden Avenue. A functional design for Highway 407 Transitway Warden Station has been developed by MTO, but is likely to change slightly due to plans by the Town of Markham to extend Miller Avenue across Warden Avenue. As the Markham North-South Link would have a connection to the Highway 407 Transitway at Unionville Station (in the same manner as the Highway 7 transitway), it would not necessarily require a connection at Warden Avenue. However, if a connection is desired when the Highway 407 transitway is developed it would be possible to construct a vertical connection in the median of Warden Avenue to the 407 transitway below. This connection is not part of the preferred undertaking for the Markham N- S Link and would need to be developed and assessed as part of the detailed design for the Highway 407 transitway. 9.2 SERVICE PLAN Near-Term Service Design Initially, the service design for the Markham Link is expected to be generally the same as that for York Region s VIVA Phase 1 system which started operation in Fall This is described as follows: Stop Policy stopping at all stations, as defined in this report (i.e. no express or semi-express operation or other stop variation); Vehicle Allocation 18-metre articulated vehicles, which are being used for VIVA Phase 1 and would continue to be used on the corridor in subsequent near-term phases; Span of Service 7 days per week and approximately 18 hours per day (6:00 am to 12:00 midnight, with slightly later early morning starts Saturdays and Sundays), although service could operate later in the evening as ridership builds, say to 1:00 or 2:00 am, the same as the local service now provided by YRT; Service Frequencies a minimum 10-minute service during weekday peak periods (6 vehicles per hour in each direction) and a 15-minute service along the entire corridor during all other times. These frequencies are expected to increase within a year or two of the 2005 enhanced service implementation and the implications of this are discussed in the next section Longer-Term Service Design Concepts Once the initial VIVA Phase 1 service is implemented, ridership is expected to grow over the next 15 years. Ridership modelling has produced forecasts for 2006 (i.e. the Viva 1 phase) and 2021 (See Chapter 4). By 2021, peak hour, peak direction ridership is projected to be 3000 passengers with the full BRT system, compared to 2000 if the VIVA 1 system was maintained. As land use and transit ridership evolves in York Region, changes in the configuration of the initial services will inevitably occur. One potential change is the extension of the Finch-Richmond Hill-Unionville service (currently an L-shaped service) to Don Mills to form a U-shaped service. This routing would provide an additional subway link to the Beaver Creek and Woodbine employment areas and would add capacity to Don Mills station without over servicing the portion of the Highway 7 corridor east of Markham Centre. Allowances in the route alignments and intersection alignments where rapid transit routes meet should then be designed to accommodate any of the above routing combinations. The specific service designs for any of these routes would be done in the future once ridership patterns have further developed and demand has grown sufficiently to justify the new route combinations while maintaining high frequency rapidtransit service levels Longer-Term Service Levels Bus Bay Considerations at Don Mills Station Routing staying strictly on the corridor, as defined in this report (i.e. no branching or inter-lining with local routes); The 2021 ridership forecasts noted above indicate that the required individual link frequencies could be as high as 90 seconds to two minutes TO1793 Markham North South Link Corridor Public Transit Improvements Environmental Assessment t 28/02/
106 during peak hours in the busiest parts of the corridor. This assumes the longer-term use of articulated buses on all corridors, which is supported by these ridership figures. A more flexible routing approach, such as that described above, would ensure that sufficient service is provide on the Markham N-S Link. Frequencies are very much of a rapid transit quality and yet are not so high that they would result in inefficiencies or operational difficulties. Thus, within the 2021 time frame and using the multi-route approach, there would not likely be a need to put in place more complex operational policies, such as express services or trips with varying stop policies. 9.3 PROJECT ACTIVITIES There are three distinct phases to the project: Pre-construction; Construction; and Operation. The activities associated with each of these phases are presented below: 1. Pre-construction Phase: This phase includes the completion of preliminary and detailed engineering and streetscape designs and preparation of contract drawings and specifications. This phase also involves obtaining all necessary permits, as well as approvals from regulatory agencies. 2. Construction Phase: This phase involves all activities related to construction such as: removals, grading, excavation, filling, construction and replanting for the entire construction period. 3. Operation Phase: This phase begins with the first day of transitioning operation, and covers the general operational activities such as maintenance and monitoring, on an as required basis Pre-construction Phase This stage includes completion of preliminary and detailed engineering and streetscape designs and preparation of contract drawings and specifications. Issues to be addressed and resolved during preliminary design include but are not limited to: Potential funding sources for construction of the project; Property acquisition Phasing requirements for infrastructure design; Construction staging of the design; Resolution of transit arrangement for the section between Steeles Avenue to Finch Avenue; Landscaping materials; Utility relocation strategy and design; Street lighting design, frequency and location; Street furniture; Public art; Storage & Maintenance Facility design; Vehicle types and operational plans; Amenities for stations and their design; Traffic signal design; Coordination with local transit routes and transfer strategies; Fare collection strategies; Sewer design and watermain design and; Pavement design for running ways and roadways. Other pre-construction activities include: Site surveying as required; Obtaining approvals for construction access and working areas; Legal agreement between York Region and 407 ETR for any changes to proposed structures or utilities; Geotechnical investigations including drilling of boreholes to determine existing soil and groundwater conditions; Archaeological and waste contamination investigations; Advance utility relocation or burying contracts; and Coordination with other projects in the vicinity of the corridor Construction Activities Physical construction activities will include: Installation of traffic accommodation measures as required by staging plan; Clearing and grubbing of vegetation within the grading limits for construction of the project; Stripping and topsoil within the grading limits; Excavation of road surface including sidewalks and medians; Trenching and installing new below grade infrastructure and burying overhead services where necessary; and Removing existing asphalt and disposing at approved facility; Removing redundant structures and disposing of debris; Preparing road bed including cutting and filling and lying granulars; Potentially salvaging existing granulars/asphalt for reuse; Pouring concrete for curb, barriers, retaining walls, planters and sidewalks; Constructing buildings in the Storage and Maintenance Facility; Fabricating and erecting station elements including amenities; Laying granular and application of hot mix asphalt; Installing lighting, heritage lighting and traffic signals; Final grading and topsoil application; Asphalt line painting; and Installing landscaping features such as sod, shrubs, trees, paving stones irrigation systems, station amenities and street furniture. Throughout the construction stage, various associated activities, which can have potentially adverse environmental effects will need to be mitigated, as outlined in Section Operation Phase Once construction is complete, monitoring of the Markham N-S Link Transitway will be initiated. This will include: Monitoring traffic and transit ridership volumes to determine the potential for future modifications; Accidents to analyze safety conditions; Traffic signals timing; and Landscape health. Routine maintenance activities include: Spring sweeping of road, sidewalk and boulevards; Snow and ice removal in the winter; and Landscape maintenance including grass cutting, shrub and tree pruning in the summer; and Replacement of any landscaped material 9.4 PROJECT STAGING There will be opportunities to stage project activities during the construction phase. Staging the project will be beneficial in maintaining the best possible level of service during construction, including maintaining accesses to all properties as well as maintaining city/town and utility services such as water, sewer and hydro. This will include staging of activities in terms of activities across the corridor (cross-section staging), or sections/portions along the corridor (component staging). Although specific plans to stage the project will not be determined until the detailed design phase, it is useful to present staging opportunities in general terms in this environmental assessment study so that potential effects can be assessed. Because of the generous platform width required for the new project staging of construction should be easy and should have the ability to maintain pedestrian and road traffic as currently existing during construction. The basic strategy would be: 9 TO1793 Markham North South Link Corridor Public Transit Improvements Environmental Assessment 28/02/
107 Construct the additional widening on one side of the roadway to its required width; Shift existing traffic to the side where new widening has been constructed. If necessary a temporary surface over the landscape median/station areas may have to be constructed; Operate traffic to one side. Set up temporary signals to align with new traffic lanes at signalized intersections; Construct remainder of the roadway while maintaining access to existing properties by staged construction; Finalise construction and open to traffic to its final configuration. 9.5 DESIGN ATTRIBUTES AND BUILT-IN MITIGATION For this project, built-in mitigation : is defined as actions and design features incorporated in the pre-construction, construction and operational phases, that have the specific objectives of lessening the significance or severity of environmental effects which may be caused by the project. The Markham N-S Transitway will be designed and implemented with the benefit of planning, road and transit design engineering, landscaping design, and environmental best management practices. Regard shall be given to the legislation, policies, regulations, guidelines, and best management practices of the day. Where possible, mitigation measures will be prescribed in the construction contracts and specifications. Examples of practices that should be employed, based on current standards, are described below. These will be applied and refined during the pre-construction, construction and operational phases of the project. discharges of pollutants or contaminants will be reported immediately. Clean up shall be initiated quickly to ensure protection of the environment. Management of Contaminated Materials Studies will be completed to confirm the potential for the project to interact with contaminated soil or groundwater. Where the potential is confirmed, a plan to remediate the environment to the applicable standards will be prepared. The Ministry of Environment and Construction Manager would be notified immediately upon discovery of any contaminated material encountered within the construction area. If contaminated materials or contaminated groundwater are encountered within the construction limits, these are to be removed and disposed off in accordance with all applicable Acts and regulations. Treatment and discharge of contaminated groundwater are also to be in accordance with applicable legislation and regulations. Construction Waste Management Plan During construction there will be some excess materials that must be disposed off the site of the project. These could include concrete rubble, asphalt, earth and road right-of-way appurtenances such as signs and lighting and utility poles. During the detailed design stage a waste management plan will be developed to ensure that surplus material is recycled wherever practical and to describe the methods to be used by the Contractor for disposal of all other surplus material in accordance with provincial or local municipal practices and guidelines. Stormwater Management Plan A stormwater Management Plan will be prepared, in accordance with the MOE s Storm Water Management Planning and Design Manual (2003), in detail to identify the rate and volume of anticipated stormwater runoff and the means to accommodate it, and to identify the means of achieving MOE guidelines for water quality of stormwater runoff. This includes the identification, in the detailed design phase, of the overall stormwater management system requirements, methods of detention and filtration, and any control mechanisms necessary to achieve runoff quantity and quality targets. This plan, when prepared during the detailed design phase, will take into account the opportunity that exists to use specific locations within the identified right-of-way as retention areas to assist in the objective to improve stormwater runoff quality to further off-site (i.e., outside the right-ofway) treatment. Erosion and Sediment Control Plan A detailed plan will be prepared by the Contractor to manage the flow of sediment into storm sewers. This plan will be based on best management practices including the Guideline of Erosion and Sediment Control at Urban Construction sites. Provision for inspection of erosion and sedimentation control measures during construction will be identified in permit approvals. Catchbasin filters and straw bales in roadside ditches will be used to control erosion and sedimentation during construction. Landscape Plan 9 Construction and Traffic Management Plan A Construction and Traffic Management Plan will be developed to manage the road s transportation function for all travel modes including equipment and material deliverables at various times during the construction period. The objective will be to maintain clear pedestrian safe routes and to maintain existing traffic as close as possible to its current conditions. The plan will also outline the road signage program. Emergency Response Plan The preparation of an Emergency Response Plan to be used by the contractor is included to allow full emergency services access during the construction period, such that anytime there is a method to access all residential, commercial and other land uses in the event of an emergency. Additionally, the emergency response plan should include provisions for providing temporary services to end users in the event of a construction related service outage or other service disruption. A spills response and reporting plan will be prepared and adhered to by the contractor. Spills or Geotechnical Investigations Geotechnical investigations will be required to confirm groundwater and subsurface conditions and potential impacts that will need to be considered in the detailed design of the project. Archaeological Assessment and Monitoring Based on the existing conditions, there were areas identified as having archaeological potential. Accordingly, it is recommended that a Stage 2 Archaeological Assessment be conducted by a licensed archaeologist, prior to construction. During actual construction, it may be necessary to monitor deep excavations, by a licensed archaeologist. The results of the Stage 2 assessment should be used to determine this level of monitoring. If during the course of construction, archaeological resources are discovered, the site should be protected from further disturbance until a licensed archaeologist has completed and any necessary mitigation has been completed. A detailed Landscape Plan will be prepared to guide the species selection, location and planting details for all proposed plantings and other streetscaping elements within the corridor. The plan will be prepared by a professional landscape architect with experience in plantings along arterial roadways. Lighting Treatment Plan A lighting treatment plan in accordance with local and regional municipal standards will be prepared during the pre-construction phase. The lighting treatment plan will include lighting fixtures and illumination along the various sections of the corridor. A lighting audit of the preferred lighting design plan will be conducted to ensure clear sight lines and appropriate illumination. Public Communications Plan The requirement for a Public Communications Plan stems from the need to keep the public informed about the work in progress and the end result of the construction activity. Residents and other stakeholders must be aware TO1793 Markham North South Link Corridor Public Transit Improvements Environmental Assessment t 28/02/
108 of scheduled road closings and other disruptions to normal service ahead of time in order that their activities can be planned with minimum disruption. The Public Communications Plan should detail how to communicate the information to the public, what information should be disseminated, and at what project stages the communications should take place. 9 TO1793 Markham North South Link Corridor Public Transit Improvements Environmental Assessment 28/02/
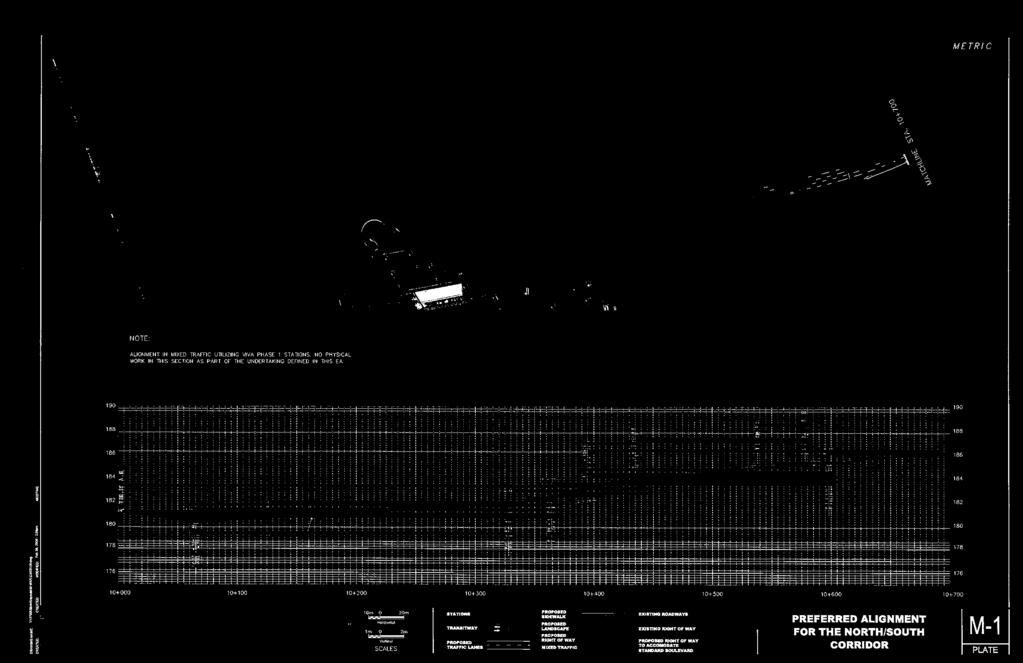
109
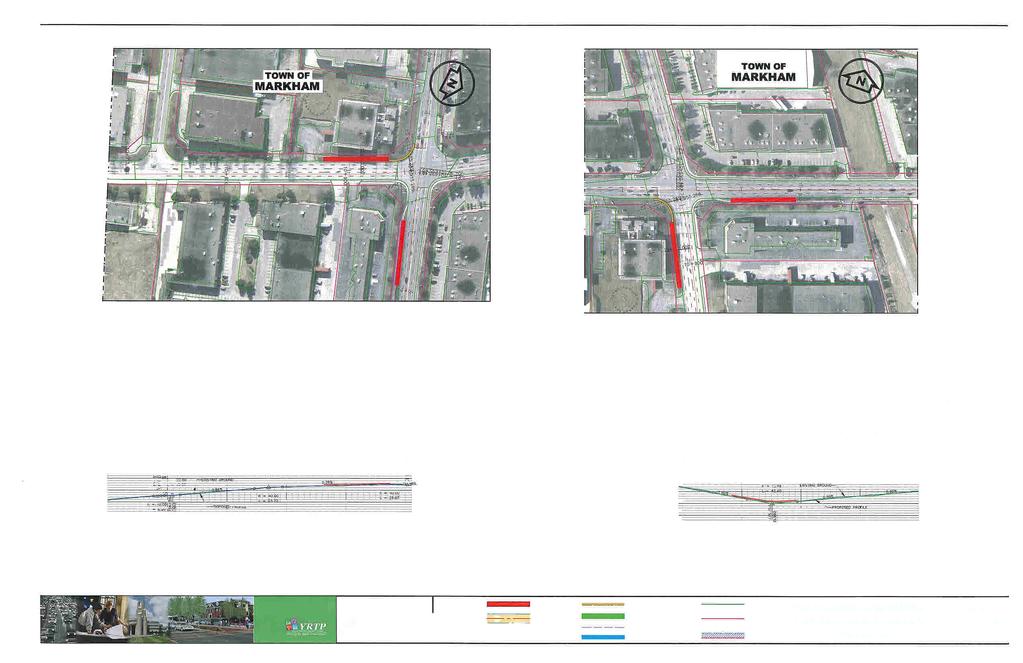
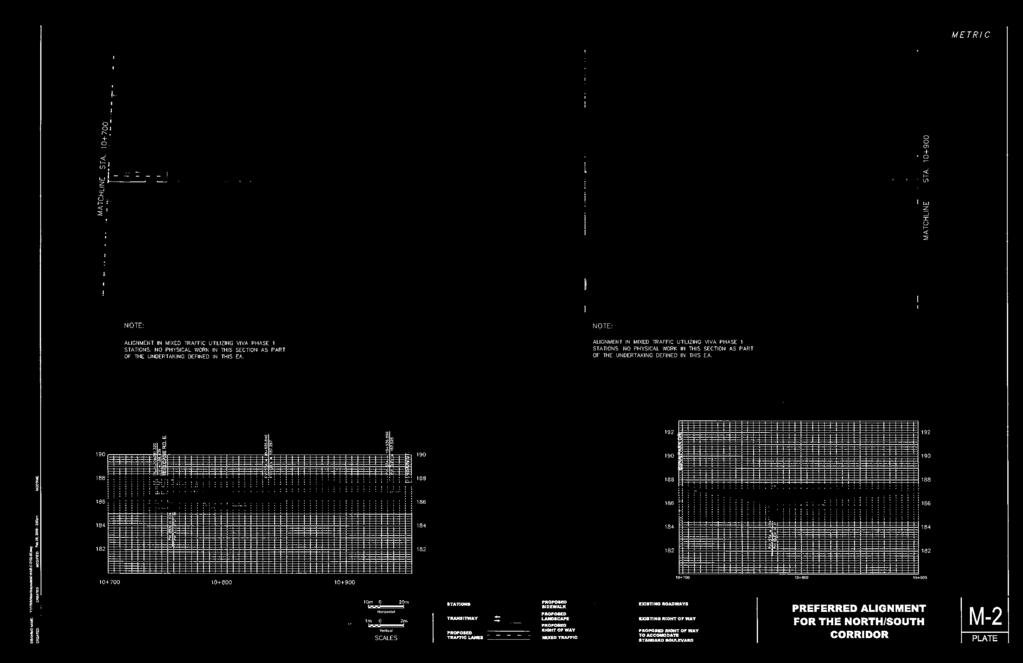
110
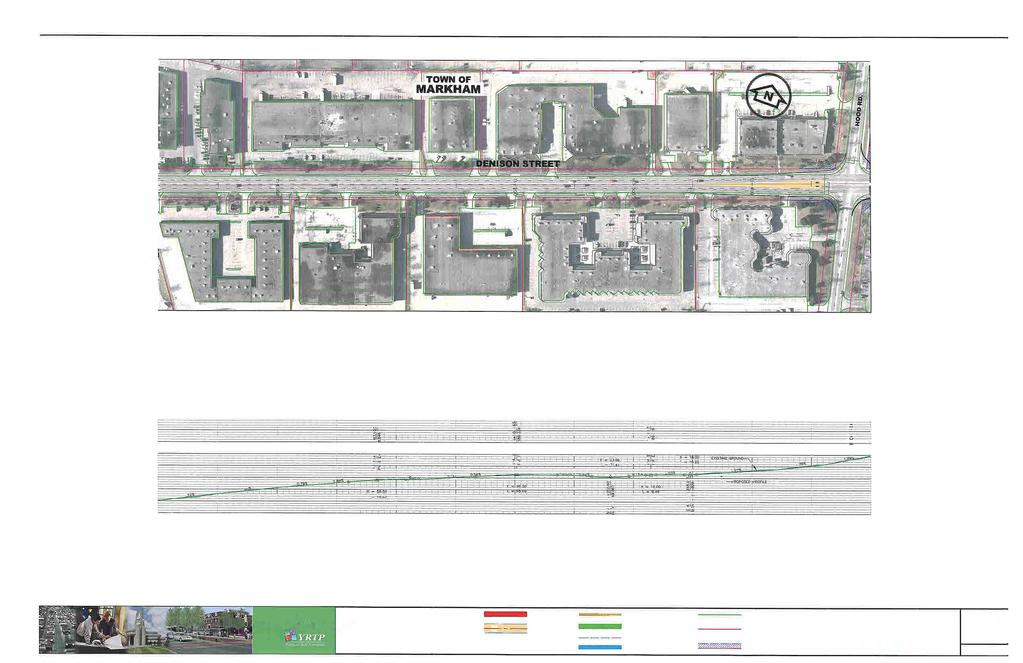
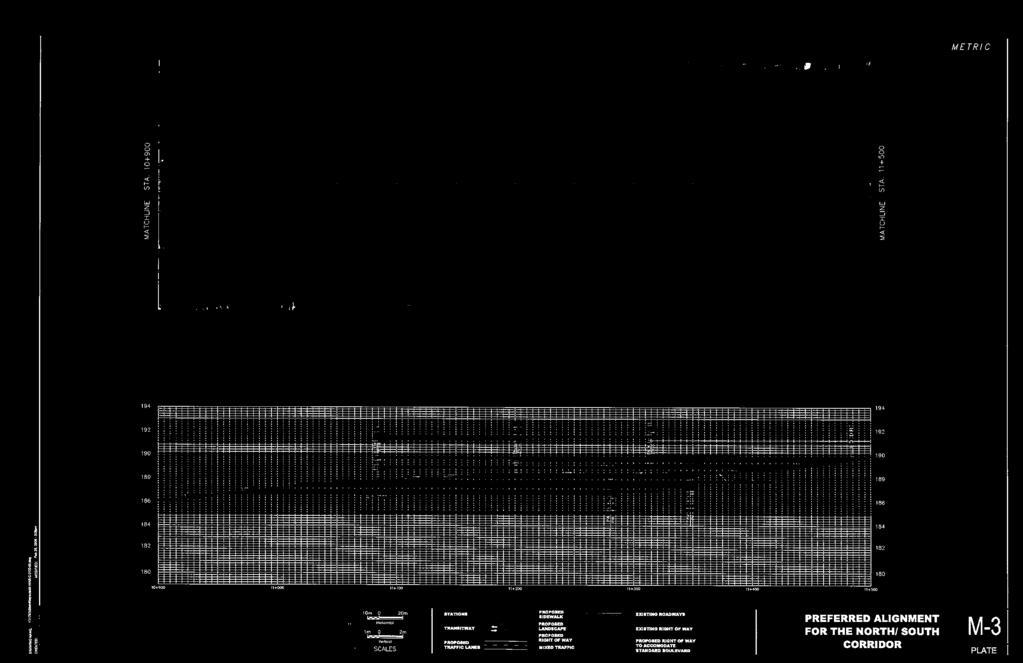
111
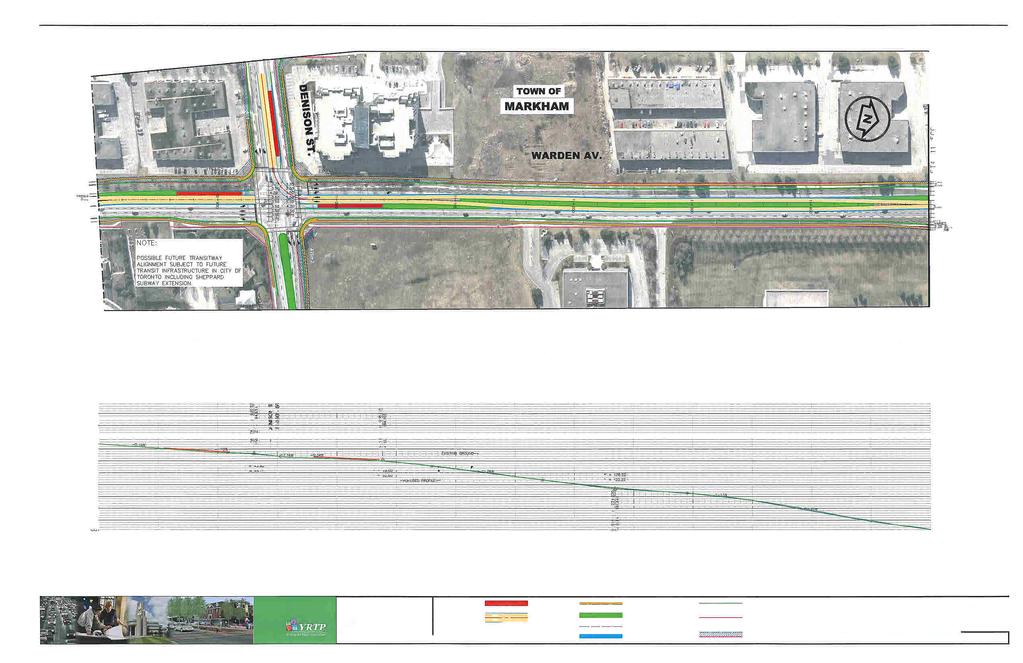
112
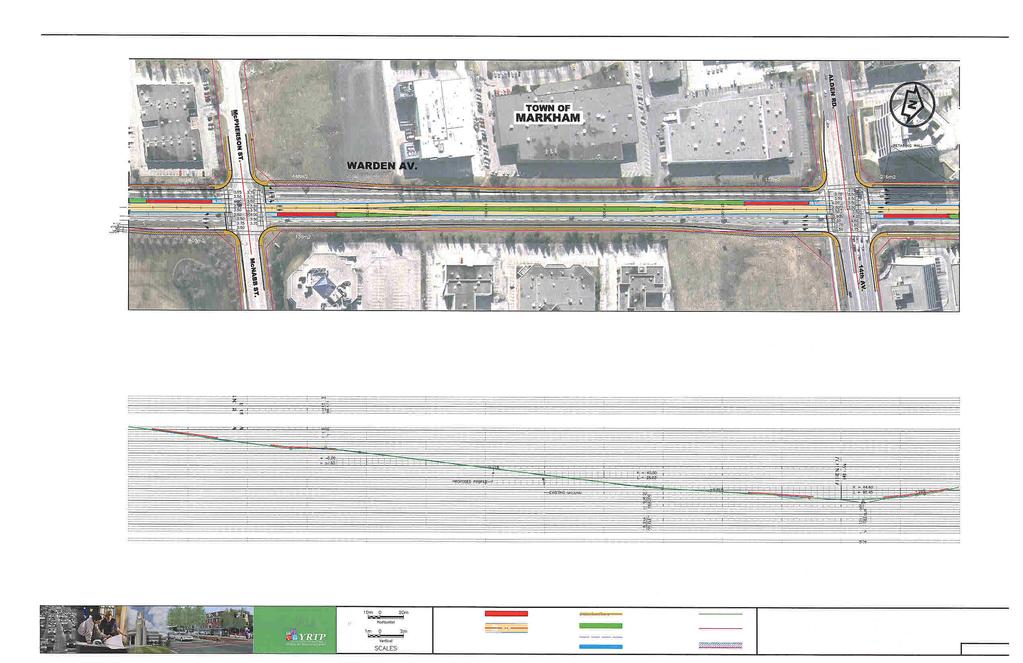
113
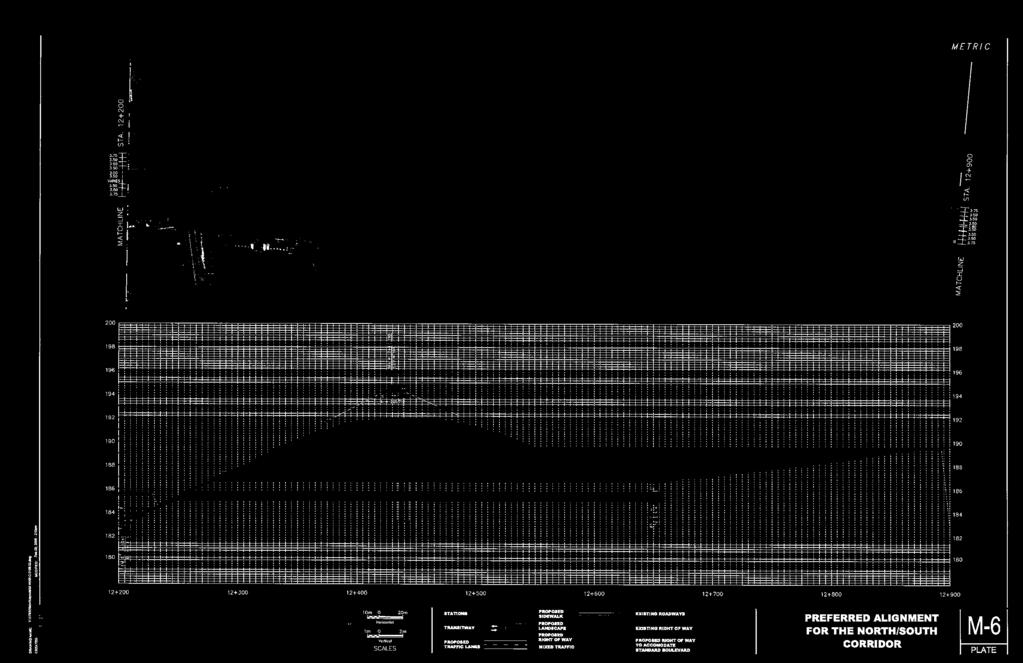
114
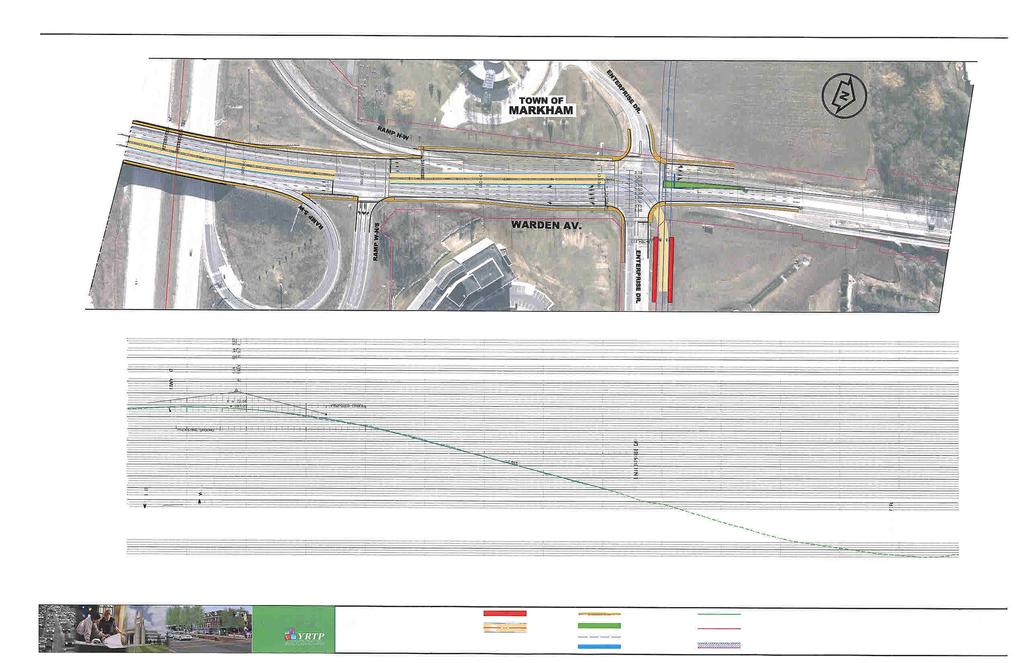
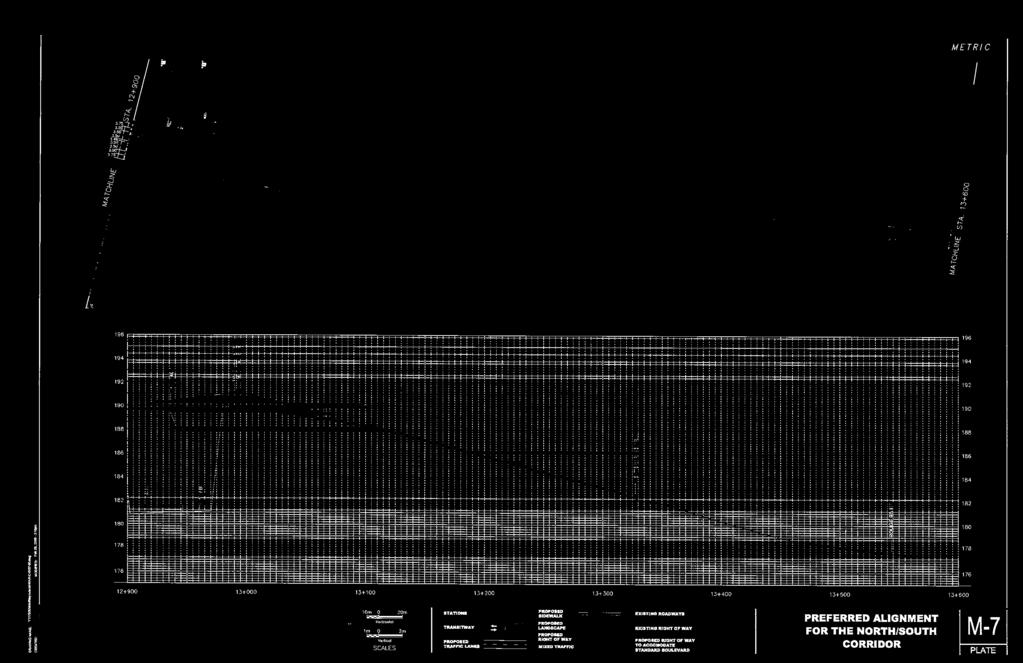
115
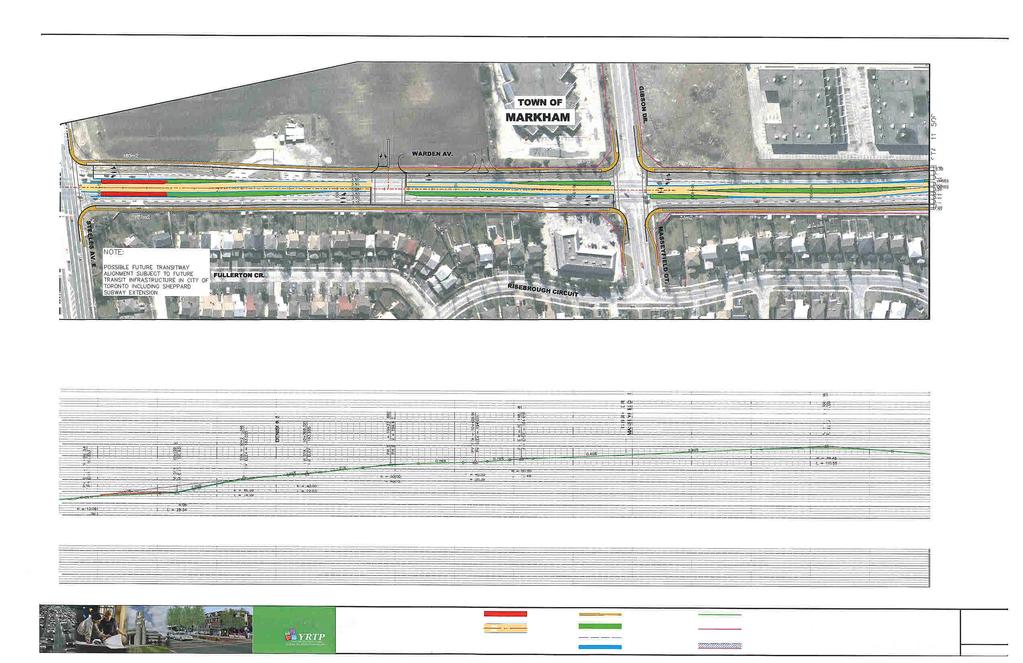
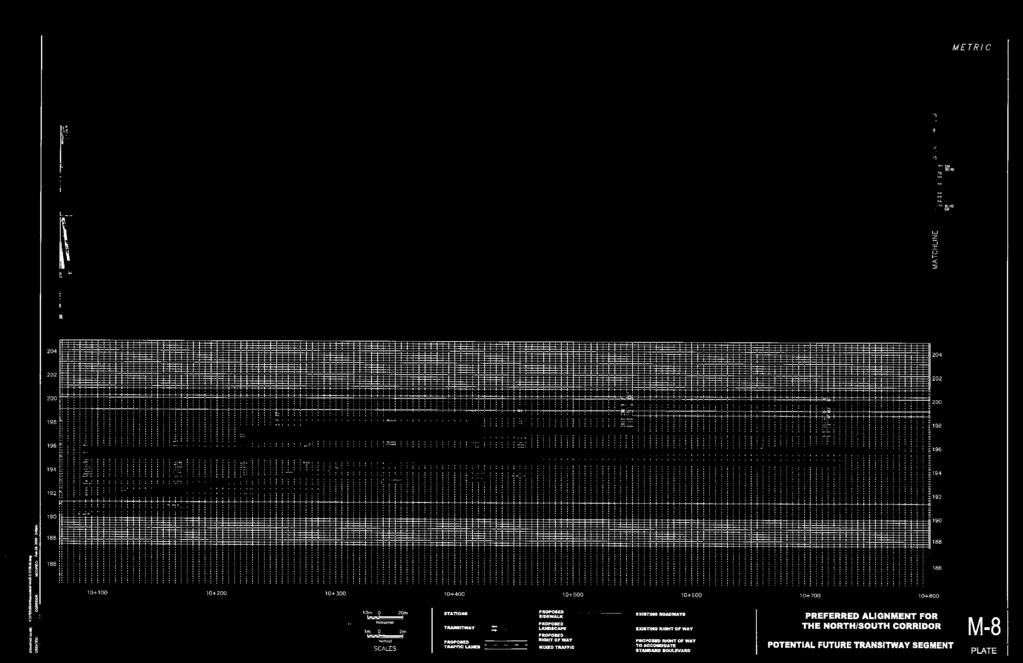
116