UNECE Expert Group on Resource Classification April, 2016
|
|
|
- Johnathan Percival Flynn
- 5 years ago
- Views:
Transcription


1 UNECE Expert Group on Resource Classification April, 216 Scott W. Tinker Bureau of Economic Geology University of Texas at Austin
2 Framing Conundrum Many people do not know how electricity is made or where gasoline comes from... But you think you do!

3 Switch Energy Project Feature Length Film Switch Switch Energy Lab Major Video Based Website Active Facebook and Newsletter On-Line Energy Education Materials

4 Filmed in 11 Countries 21 Site Visits 52 Expert Interviews 5 Hours of Footage Over 1 Million Viewers > 6 Universities > 4, Educator-Requested Copies Heavily Awarded Across Sectors Available on Amazon
5 Outline Foundational Energies Alternative Energies Implications
6 Energy Security Affordable Available Reliable Sustainable Cost: per unit of energy Price Volatility: stable or fluctuating Infrastructure: cost to build the plant Access: substantial resources Intermittent: source consistent or variable Safe: natural/human causes Clean: air and atmospheric emissions Dense: land footprint Dry: fresh water use/risk
7 The Energy Mix U. S. Energy Flows (Quads/year) Petroleum 35 Biomass 4 Natural Gas 25 Transportation 27 Residential Commercial 8 13 Energy Services 37 Coal 2 Nuclear 8 Geothermal.2 Hydro 3 Wind-Solar 1 Electricity Generation 39 Industrial Waste Water Treatment 3 2 th Century Foundational Energies The Water-Energy Nexus: Challenges and Opportunities, DOE, July, 214 QAe3712


8 Powder River Basin, WY Coal

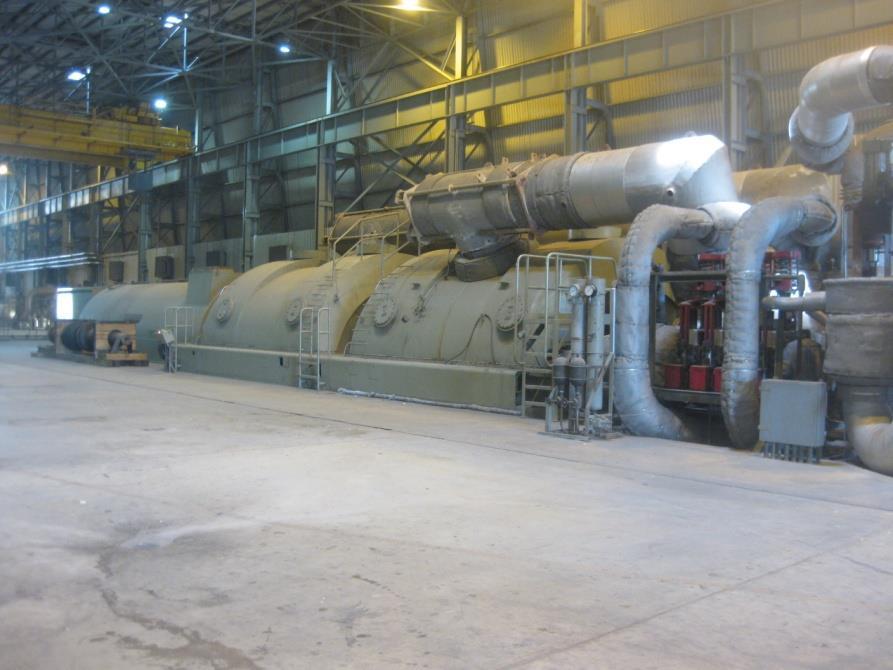

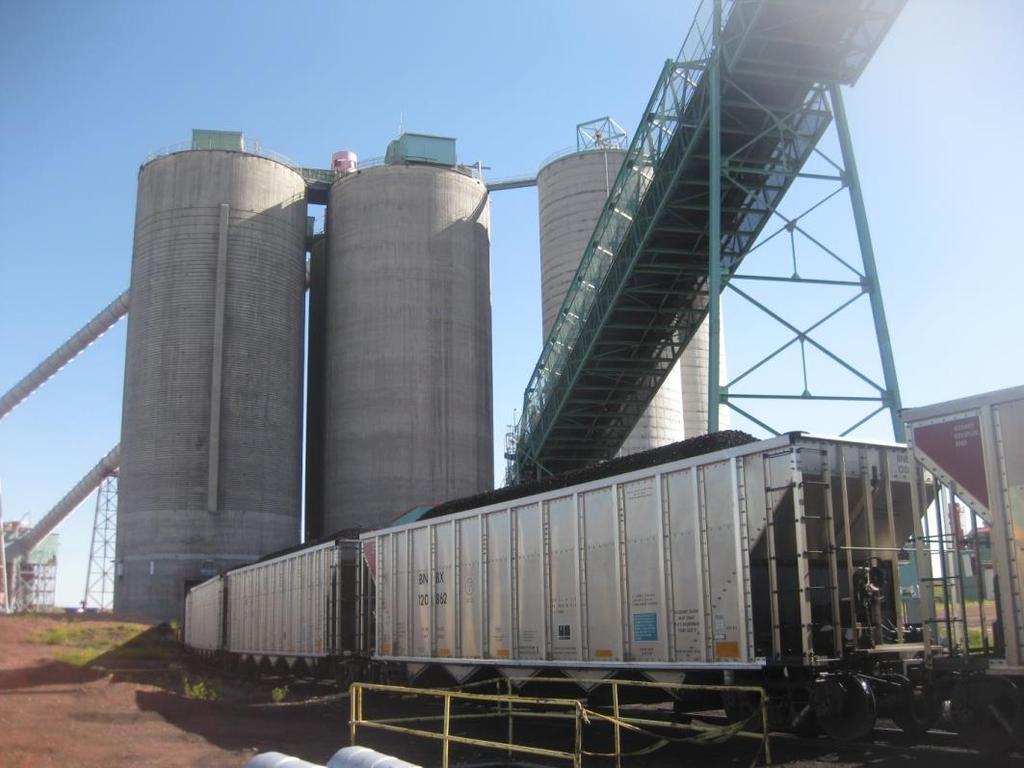
9 Coal Parish Plant, TX

10 Security/Challenges Coal Affordable, Available, Reliable Mining Air and Atmosphere Mercury Water
11 1s BBls/Day Global Oil Production OECD Non-OECD Year Source: BP Statistical Review 212
12 1s Bbls/Day Global Oil Production OPEC Non-OPEC FSU Year Source: BP Statistical Review 212

13 1s Bbl Day Global Oil Production Total North America Total S. & Cent. America Total Europe & Eurasia Total Middle East Total Africa Total Asia Pacific BBY Source: BP Statistical Review 212
 Resources (billion")
14 Production cost (28 $) Long-Term Oil Supply Resources and Cost EOR Deepwater and ultra-deepwater CO 2 EOR Other conventional oil Arctic Heavy oil & bitumen Global Consumption 34 Bby Oil shales Shale oil Gas to liquids Coal to liquids 2 Produced MENA , Modified from: IEA World Energy Outlook (29) Resources (billion barrels)
 Resources (billion")
15 Production cost (28 $) Long-Term Oil Supply Resources and Cost EOR Deepwater and ultra-deepwater CO 2 EOR Other conventional oil Arctic Heavy oil & bitumen Global Consumption 34 Bby Oil shales Shale oil Gas to liquids Coal to liquids 2 Produced MENA , Modified from: IEA World Energy Outlook (29) Resources (billion barrels)
16 Production cost (28 $) Long-Term Oil Supply Resources and Cost EOR Deepwater and ultra-deepwater CO 2 EOR Other conventional oil Arctic Heavy oil & bitumen Global Consumption 34 Bby Oil shales Shale oil Gas to liquids Coal to liquids 2 Produced MENA , Modified from: IEA World Energy Outlook (29) Resources (billion barrels)
17 Production cost (28 $) Long-Term Oil Supply Resources and Cost Arctic Global Consumption 34 Bby EOR Deepwater and ultra-deepwater CO 2 EOR Other conventional oil Heavy oil & bitumen Oil shales Shale oil Gas to liquids Coal to liquids 2 Produced MENA , Modified from: IEA World Energy Outlook (29) Resources (billion barrels)
18 Annual US Oil Production Thousand barrels/year From: James D. Hamilton, Working Paper 17759, NATIONAL BUREAU OF ECONOMIC RESEARCH, 212
19 U.S shale liquids projected growth (Mbpd) United States Consumption ~ 19 Mmbd 21 U.S. Shale Liquids 21 PROJECTION ~ 3.8 Mmbd from shale by 222 1% IRR: $68/bbl 1% IRR: $51/bbl 1% IRR: $5/bbl 1% IRR: $44/bbl 1% IRR: $5/bbl Monterey Woodford/Anadarko Utica Barnett Uinta Niobrara Permian Midland Permian Delaware Granite wash Eagle Ford % IRR: $44/bbl Bakken After Morse et. al., 212, Energy 22: North America, the new Middle East: Citi GPS: Global Perspectives & Solutions, figure 14, p. 17. IRR Source: Rystad Energy Actual Shale Oil: EIA QAe465

20 U.S shale liquids projected growth (Mbpd) 21 U.S. Shale Liquids 21 PROJECTION Actual 1% IRR: $68/bbl 1% IRR: $51/bbl 1% IRR: $5/bbl 1% IRR: $44/bbl 1% IRR: $5/bbl Monterey Woodford/Anadarko Utica Barnett Uinta Niobrara Permian Midland Permian Delaware Granite wash Eagle Ford % IRR: $44/bbl Bakken After Morse et. al., 212, Energy 22: North America, the new Middle East: Citi GPS: Global Perspectives & Solutions, figure 14, p. 17. IRR Source: Rystad Energy Actual Shale Oil: EIA QAe465


21 Annual US Oil Production Thousand barrels/year Approaching 5% of U.S. Oil Production from Shale From: James D. Hamilton, Working Paper 17759, NATIONAL BUREAU OF ECONOMIC RESEARCH, 212
22 Security/Challenges Petroleum Affordable, Available, Reliable Ultimately Nonrenewable Political Control Limited Air and Atmosphere Drilling and Water Transportation

 Available, affordable, reliable Dirtier")

23 Energy Security Challenges Transportation I. Biofuels II. o o o Scale, land use, water, cost Natural Gas (CNG, LPG, LNG, GTL) Available, affordable, reliable Dirtier than certain electric fuels III. Electricity IV. o o Benefits depend on fuel source Expensive, chemicals, range Hydrogen From Tinker et. al. 213, GSA Special Publication
24 The Future Transportation Mix North America Diesel Gasoline Jet fuel Ethanol Millions of oil-equivalent barrels per day Other Natural gas Fuel oil Biodiesel Europe Asia Pacific ExxonMobil Corporation, 213 The Outlook for Energy: A View to 24, page 2.
25 Outline Foundational Energies Alternative Energies Implications
26 BCF/Day Global Natural Gas Production 5. Total North America Total S. & Cent. America Total Europe & Eurasia Total Middle East Total Africa Total Asia Pacific Source: BP Statistical Review 212

27 BcF/Day Global Natural Gas Production OECD Non-OECD Year Tcfy Source: BP Statistical Review 212
28 Production cost (28 $/Mmbtu) Produced Conventional Coal Bed Methane Arctic Deep Water Global Natural Gas Resources v. Cost Tight 3, 6, 9, 12, 15, 18, 21, 24, 27, 3, Modified from: IEA World Energy Outlook (29) Global Consumption 115 Tcfy Shale Sour ~ 3 year total resource Resources (Tcf) Hydrates QAe98
29 Production cost (28 $/Mmbtu) Produced Conventional Coal Bed Methane Arctic Deep Water Global Natural Gas Resources v. Cost Tight 3, 6, 9, 12, 15, 18, 21, 24, 27, 3, Modified from: IEA World Energy Outlook (29) Global Consumption 115 Tcfy Shale Sour Resources (Tcf) Hydrates QAe98
 Global Consumption 115 Tcfy Shale Sour Resources")
30 Production cost (28 $/Mmbtu) Produced Conventional Coal Bed Methane Arctic Deep Water Global Natural Gas Resources v. Cost Tight 3, 6, 9, 12, 15, 18, 21, 24, 27, 3, Modified from: IEA World Energy Outlook (29) Global Consumption 115 Tcfy Shale Sour Resources (Tcf) Hydrates QAe98
31 Security/Challenges Natural Gas Affordable, Available, Reliable Ultimately Nonrenewable Political Control Limited Air and Atmosphere Drilling and Water Transportation


32 Energy Security Challenges Electricity I. Nuclear II. III. IV. o o o o o o o o Wind Solar Hydro V. Geothermal o o Efficient, no emissions, affordable generation Expensive to build, waste, safety Simple, affordable, no emissions Intermittent, land and visual, transmission Simple, no emissions, local Intermittent, land, transmission Efficient, affordable to generate, no emissions Water, land, drought Affordable where concentrated, no emissions Geology


33 Quadrillion Btu Quadrillion Btu Hydroelectric Power Consumption Wood Energy Consumption Waste Energy Consumption Biofuels Consumption 2 Wind Energy Consumption Geothermal Energy Consumption Solar/PV Energy 18Consumption US Energy Mix Total Energy Consumed Imports Jim Sweeney, 215. Data: EIA, Monthly Energy Review Nuclear Oil Natural Gas Coal
34 Power Density (w/m 2 ) Power Density, Capacity and Efficiency High Nuclear Hydrogen Natural Gas Oil CO 2 Emissions Solar Coal 2s 2s Lower Low Wind Waves/Tides Biomass Wood Hydro Low Capacity & Efficiency High 195s 19s 185s Higher
35 Power Density (w/m 2 ) Power Density, Capacity and Efficiency High Less Land Less Infrastructure More Efficient More Reliable Nuclear Hydrogen Natural Gas CO 2 Emissions Low Waves/Tides Solar Wind More Land More Infrastructure Less Efficient Less Reliable 2s 2s Lower Low Capacity & Efficiency High
36 Outline Foundational Energies Alternative Energies Implications
37 Global Consumption (Q) Global Consumption (Q) A Look at the Global Future 3% 6. 5% 6% 5. Petroleum Consumption Coal Consumption 45% 4. Natural Gas Consumption 3. 4% 7% Nuclear Electric Power Consumption 2. Hydroelectric Power Consumption 4% 35% 1. Biomass, Geothermal, Solar & Wind Consumption. 3% % 25% 2% 8% % 6% 1. 1% 4% % 2% 3 %. 2 % Tinker Scenario,
38 Energy Mix ,131 Hydro Nuclear Renew Petroleum 3, ,987 Coal Nat Gas Global Population Each color on the map represents ~ 1 billion people Modified from: EIA Million Tonnes Oil Equivalent (212)

39 Energy Mix Hydro Nuclear Coal Renew Petroleum Nat Gas Global Population Each color on the map represents ~ 1 billion people Modified from: EIA Million Tonnes Oil Equivalent (212)
40 Energy Demand Hydro Nuclear Coal Renew Petroleum Nat Gas Global Population Each color on the map represents ~ 1 billion people Modified from: EIA Million Tonnes Oil Equivalent (212)

41 Energy Mix Trend 31% 28% 23% 38% 23% 32%


42 The Energy Mix Rest of World 12 1 Africa 8 6 Asia Source: From the UN, as appeared in The Economist, August 23, 214

43 E E E The Three E Waltz Secure Energy Builds Healthy Economies Healthy Economics Invest in the Environment The Environment Depends on Secure Energy Secure Energy Today is ~ 85% Fossil Fuels
44 The Future Electricity Mix 12 North America Quadrillion BTUs Europe Asia Pacific Electricity Generation by Fuel Oil Renewables Nuclear Coal Gas ExxonMobil Corporation, 21, The outlook for energy: a view to 23: ExxonMobil report, 53 p.
45 The Future Electricity Mix 12 North America Quadrillion BTUs Europe Asia Pacific Electricity Generation by Fuel Oil Renewables Nuclear Coal Gas ExxonMobil Corporation, 21, The outlook for energy: a view to 23: ExxonMobil report, 53 p.
46 TWh The Future Electricity Mix Other fuel Other renewables Hydro conventional Nuclear Natural gas Coal US Electricity Generation Data: IEA
47 Million metric tons The Future Electricity Mix U.S. First Quarter Total Carbon Dioxide Emissions QAe2823 Source: EIA
48 The Future Electricity Mix 12 North America Quadrillion BTUs Europe Asia Pacific Electricity Generation by Fuel Oil Renewables Nuclear Coal Gas ExxonMobil Corporation, 21, The outlook for energy: a view to 23: ExxonMobil report, 53 p.
49 1,, 9, The Future Electricity Mix EU Coal Consumption (1 tonnes) 8, 7, 6, 5, 4, Source: The Economist Intelligence Unit Year
 3, 1,, 25, 95, 9, Source: EIA, 215 Year Germany Europe 28 29 21 211")
50 1,1, 1,5, The Future Electricity Mix European Coal Consumption (Short Tons) 3, 1,, 25, 95, 9, Source: EIA, 215 Year Germany Europe ,
51 The Future Electricity Mix Country/ area China India Russia Japan Canada UK Germany Europe US Energy-related carbon-dioxide emissions by geography, and net change since emissions 8715 million metric tons Net change in annual emissions from 25 to 211, million metric tons Sources: US DOE, The Wall Street Journal
52 The Future Electricity Mix Average national electricity prices (in 211 US cents/kwh) Data: average prices from 211 converted at mean exchange rate for that year India Canada Mexico China S. Africa France Nigeria Brazil USA Russia Sources: IEA, EIA, national electricity boards, OANDA, shrinkthatfootprint.com UK Japan Italy Australia Spain Germany Denmark
53 Quadrillion Btu 2 US Efficiency Growth.55% less than GDP 8 Quads Efficiency 1 8 Total Energy Consumed Imports Jim Sweeney, 215. Data: EIA, Monthly Energy Review Nuclear Oil Natural Gas Coal
54 Efficiency Reduces Demand Benefits Save energy Lower emissions Less water Less infrastructure Less land Save $ Challenges Incentivize producers to produce less Expensive to install Requires a cultural change
55 TPER per capita Human Implications 9, 8, 7, 6, 5, TPER = Total Primary Energy Requirement. Energy needed to facilitate Total Final Consumption (TFC does not include conversion and transmission losses). Australia United States 4, 3, 2, 1, World China India After: Rice World Gas Trade Model Medlock, 212 Korea Brazil 5, 1, 15, 2, 25, 3, 35, 4, 45, GDP per capita Japan QAe963
56 TPER per capita Human Implications 9, 8, 7, 6, 5, TPER = Total Primary Energy Requirement. Energy needed to facilitate Total Final Consumption (TFC does not include conversion and transmission losses). Australia United States 4, 3, 2, 1, World China ~3 billion people India After: Rice World Gas Trade Model Medlock, 212 Korea Brazil 5, 1, 15, 2, 25, 3, 35, 4, 45, GDP per capita Japan QAe963
57 TPER per capita Human Implications of Energy 9, 8, 7, 6, TPER = Total Primary Energy Requirement. Energy needed to facilitate Total Final Consumption (TFC does not include conversion and transmission losses). Australia United States 5, 4, 3, 2, 1, World China India After: Rice World Gas Trade Model Medlock, 212 Korea Brazil 5, 1, 15, 2, 25, 3, 35, 4, 45, GDP per capita Japan QAe963
.")
58 TPER per capita Human Implications of Energy 9, 8, 7, 6, 5, 4, 3, 2, 1, TPER = Total Primary Energy Requirement. Energy needed to facilitate Total Final Consumption (TFC does not include conversion and transmission losses). Food Housing Clothing World Education China ~3 billion Healthcare Electricity people India After: Rice World Gas Trade Model Medlock, 212 Developing Nations Korea Brazil Balance of Trade Exports Imports GDP per capita Developed Nations Regulation and Planning Infrastructure Resources Permitting Australia Emissions, Japan Climate, Environment Energy Security United States 5, 1, 15, 2, 25, 3, 35, 4, 45, QAe963
59 Environment Economy The Radical Middle Energy Source: Tinker, EARTH, 213
60 Academia/NGO Government The Radical Middle Industry Source: Tinker, EARTH, 213
61 Tinker s Switch Take Away s The scale of energy is hard to comprehend. Oil and coal are difficult to replace. Natural gas and nuclear are scalable and cleaner. Renewables remain regional supplements. Energy efficiency is underappreciated. Energy security dictates the energy mix. We must all play a role in the Radical Middle.