Using Flow Ecology Relationships to Inform Watershed Management. Eric D. Stein Biology Department
|
|
|
- Mervin Horton
- 5 years ago
- Views:
Transcription
1 Using Flow Ecology Relationships to Inform Watershed Management Eric D. Stein Biology Department
2 Hydrology is an Integrative Driver of Stream Health Habitat Condition Hydrology Biological health Water chemistry If you can mitigate hydrologic alteration, you ll solve a lot of other problems


3 Flow Ecology is Typically Species Specific Physically Focused engineering/geomorp hology Ecologically Focused Salmon management Bank Full Spawning and incubation base flow 100 year flood Rearing access Bed Mobilization Effective Discharge Peak Discharge Life stage strategies Habitat maintenance Decoupling Predator/ Competitor Habitat

4 Prioritizing areas for protection Stormwater Retention Use or Reuse of Treated Effluent Drought and Climate Change 4

5 Setting Flow Targets to Inform Management Decisions Likely change in biological community Protect biological communities Assess future vulnerability o Prioritize protection efforts Identify when flow is the key stressor Inform management actions o Reservoir operations, flow diversions Change in flow regime


6 Why is it So Difficult? Lots of different stream types Many different methods to choose from Statistical approaches Mechanistic approaches Literally hundreds of metrics that could be applied
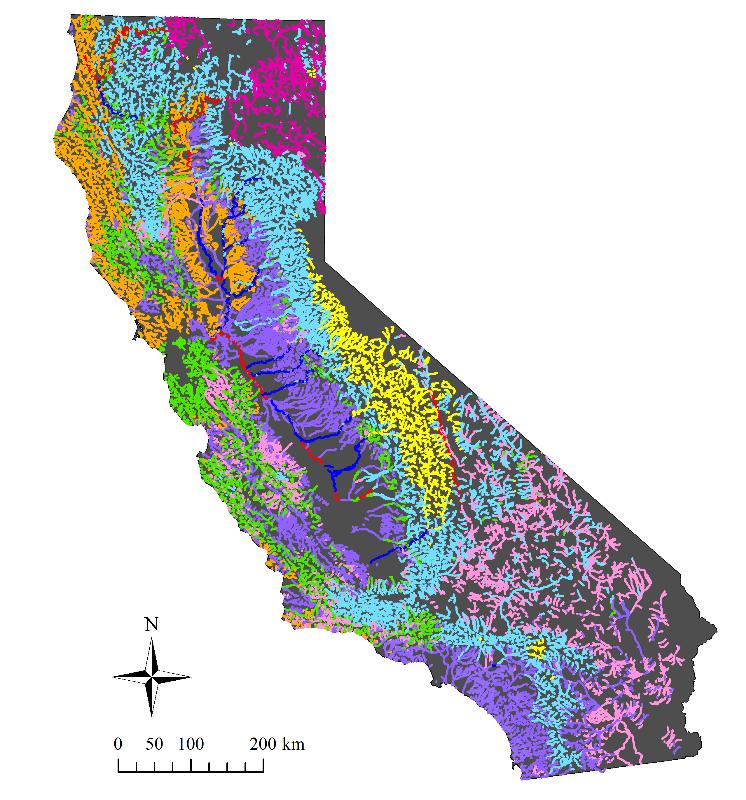
 Revealing the diversity of natural flow regimes in California with relevance for environmental flows applications, JAWRA Pyne, M., Carlisle, D., Konrad, C., Stein, E.")
7 Coordination Challenges UC Davis SCCWRP Lane, B., Dahlke, H., Pasternack, G., and Sandoval Solis, S. (2017) Revealing the diversity of natural flow regimes in California with relevance for environmental flows applications, JAWRA Pyne, M., Carlisle, D., Konrad, C., Stein, E. (2017) Classification of California streams using combined deductive and inductive approaches: setting the foundation for analysis of hydrologic alteration, Ecohydrology
8 Statewide E flows Framework Statewide approach for setting coarse scale flow targets Site specific e flows where necessary Data sharing (open data) + information dissemination to the public


9 Coordination at the Technical Level SCCWRP UC Davis +


10 Statewide Targets by Stream Class


11 Stream Gages Local Targets Sites of Interest Geomorphology Ecology Reach scale environmental flow methods Flow targets

12 Ecological Limits of Hydrologic Alteration (ELOHA) Estimate degree of hydrologic alteration Calculate a series of flow metrics Current vs. natural conditions Compare hydrologic change to response of the biological community Based on benthic invertebrate CSCI Establish thresholds of biological response Develop an index of hydrologic alteration based on priority metrics Apply index to evaluate management options in terms of their likely effect on biological communities

13 Regional Bioassessement Data Need to estimate hydrologic change at all these sites.. but very few are gauged


14 Estimating Hydrologic Change reference current Regional model ensemble Compare reference vs. current flow to produce measures of hydrologic change Bin 1 Bin 2 Bin 3 Bin 4 Bin 5 Bin 6 Bin 7 Bin 8 Bin 9 Bin 10
 Evaluate for multiple climatic conditions Average years Wet years Dry years All years Duration Storm flow recession Duration above baseflow Timing month of minimum streamflow Frequency")
15 Consider a Broad Suite of Flow Metrics Magnitude streamflow (mean, max) median annual number of high flow events Variability median percent daily change in streamflow Interannual variability (min, max, median) Evaluate for multiple climatic conditions Average years Wet years Dry years All years Duration Storm flow recession Duration above baseflow Timing month of minimum streamflow Frequency of high flow events
16 Establish Thresholds; example High Duration (days) Logistic regression: Likelihood of healthy biology at each level of hydrologic alteration Probability of good CSCI score Produce plots for all flow metrics
17 Select Priority Metrics Affects in stream biology Differentiate reference vs. nonreference Non redundant, cover all aspects of flow Amenable to management actions
18 Priority Metrics (expressed as CHANGE in metric value) Hydrograph Component Duration (days) Metric Definition longest number of consecutive days that flow is between the low and high flow threshold longest number of consecutive days that flow was greater than the high flow threshold Critical precipitation condition Decreasing Threshold Increasing Threshold Average 64 NT Wet 3 24 Magnitude (cms) Maximum mean monthly streamflow Wet NT 1.5 streamflow exceeded 99% of the time Wet NT 32 Variability (unitless) Frequency (# of events) Richards Baker index of stream flashiness number of events that flow was greater than high flow threshold Dry NT 0.25 Dry NT 3

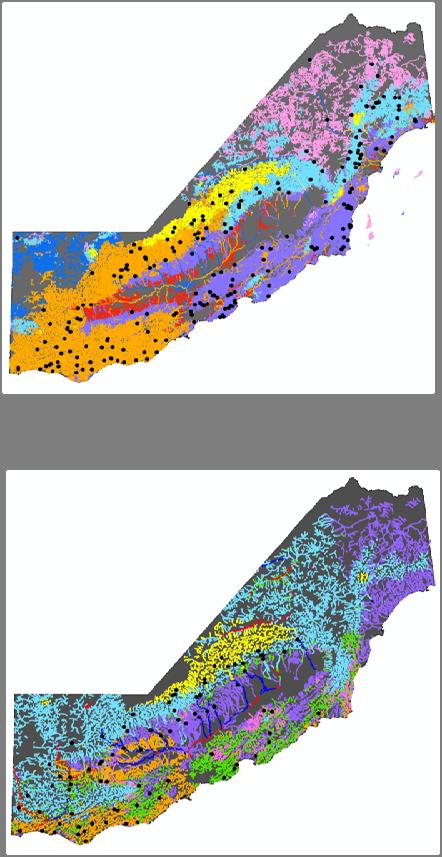
19 Regional Hydrologic Condition good bad


20 Map Hydrologic Alteration Inform land planning process 20
 Poor hydrologic condition Flow Management: Prioritize flow management relative to other stressors Monitor Good hydrologic")
21 Flow Management Zones Poor biology (CSCI < 0.79) Good biology (CSCI > 0.79) Poor hydrologic condition Flow Management: Prioritize flow management relative to other stressors Monitor Good hydrologic condition Other Stressors Management/Causal Assessment: Protect
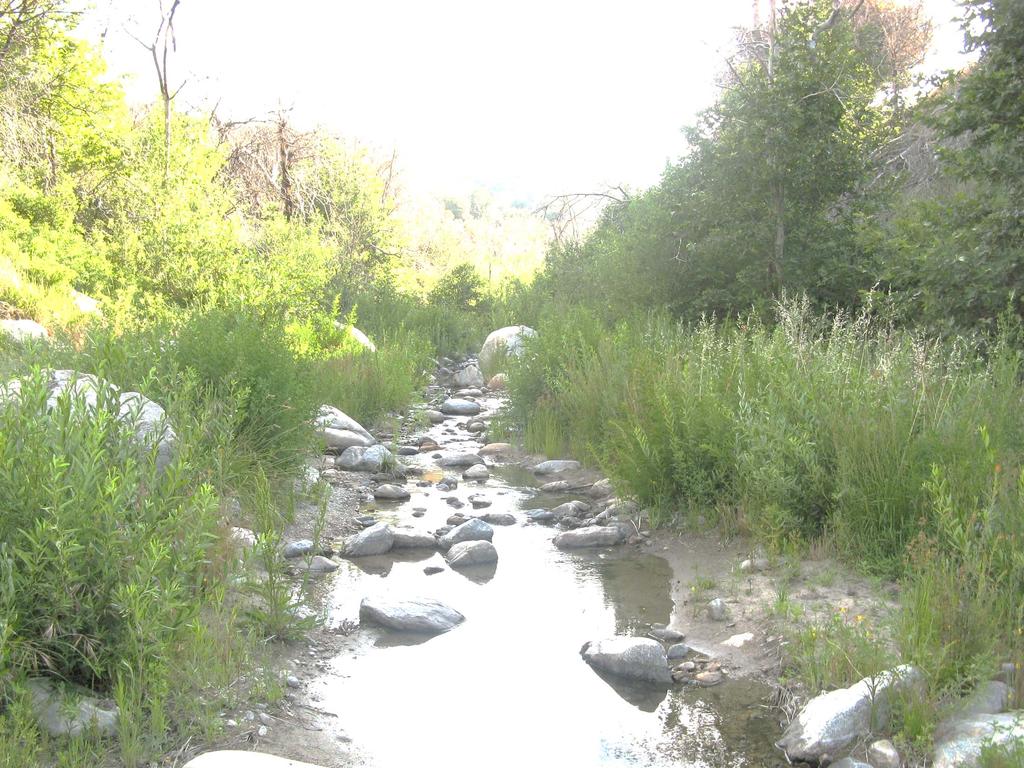
22 Scenario Analysis: Alvarado Creek Stormwater Management Current imperviousness is 50% Change effective imperviousness to 5%, 10% and 25% Capture 85% rain 50% impervious cover Flow (cfs) 2% impervious cover time
23 Alvarado Creek Results Metric Units Imperviousness 85th % Target 2% 5% 10% 25% Upper threshold MaxMonthQ cms Q99 cms RBI unitless % capture produces hydrologic conditions associated with healthy invertebrates Must reduce effective imperviousness to 2-5% to provide optimal hydrologic conditions Flashiness not an issue for this site
24 Future Directions to Inform Water Resources Management Develop flow ecology relationships for other biological endpoints in addition to benthic invertebrates Algae, fish, riparian habitat Framework to inform tool selection based on situation Improve ability to discern flow effects vs. habitat effects Investigate implications of shifting baselines Changes in perenniality of streams Drought and climate change Incorporate flow considerations into technical work on State s Biointegrity and Biostimulatory Policy Case study applications in local watershed efforts
25 Questions