Nitrogen management in Giant Miscanthus (GM) biomass production in Piedmont region of North Carolina
|
|
|
- Marcus Peters
- 5 years ago
- Views:
Transcription
1 Nitrogen management in Giant Miscanthus (GM) biomass production in Piedmont region of North Carolina R. Ravella, M. Miller, M. R. Reddy and A. Shahbazi Department of Natural Resources and Environmental Design, North Carolina A&T State University, Greensboro NC 27410
2 Need for GM biomass production in NC Chemtex plant in Clinton, NC 300,000 tons of biomass potential 20 mi gallons of biofuel production Within 50 mile radius NC is 2 nd in Hog production Spray fields are restricted and new lagoons are not permitted Tobacco acreage is going down Farmers need to generate income from their land
on/Picture Gathered From Web Soil Survey) Frost-free period: 200 to")
3 Field Trial Site Characteristics Soil Classification: Fine mixed active thermic aquatic hapludalf Enon fine sandy loam EnB (2-6%) Slopes EnC (6-10%) Slopes Mean Annual Precipitation: 37 to 60 inches Mean Annual Air Temperature: 59 to 66 degrees F (Informa)on/Picture Gathered From Web Soil Survey) Frost-free period: 200 to 240 days
4 Weather Data Monthly Averages (Obtained from North Carolina State Climate Office) Temperature/Rain Accumula:on (Temp Fahrenheit) 2013 Precip (in) 2014 (Temp Fahrenheit) 2013 Precip (in) Month
5 GM Planting Material Supplied by Repreve Renewables GM Variety: Freedom (proprietary), eligible for BCAP Cellulosic Ethanol Plant in Clinton, NC subsidiary of Chemtex International Italian Polymer company. Spacing: 2ft within row and 3ft between rows
6 Treatments and Replications 5 treatments and 4 replications in a CRBD T1: 0 lb N/ac; T2: 60 lb N/ac; T3: 120 lb N/ac; T4: 180 lb N/ac; T5: 240 lb N/ac Swine waste application Two harvests H1: Early harvest (July/Aug) H2: Late harvest (Nov /Dec)
7 Nutrient Management Practices First Year (2013) Establishment Date of Application (1st): 6/13/2013 Date of Application (2nd): 7/15/2013 Method: Broadcasted Type: Second Year (2014) Establishment Date of Application (1st): 5/06/2014 Date of Application (2nd): 7/17/2014 Method: Broadcasted Type:
8 Swine Waste Spray Applications Date Duration (min) Gallons gal/min) N applied (lb) (@0.28lb/ 1000gal) 09/11/ , /27/ , /03/ , /13/ , /15/ ,
9 Weed Management First Year (2013) Establishment Chemical Control Date: 6/12/2013 Type: Roundup/Atrazine Second Year (2014) Establishment Chemical Control Date: 4/09/2014 Type: Paraquot
10 Methodology Sampling and Weight Analyses: Biomass was sampled using 1 (M 2 )Square from each of the (N=40) Plots Biomass Processing: Biomass was placed into Fischer Scientific Isotemp Oven and dried for hrs at 70 o C. Moisture concentration was determined and expressed as a percentage of the fresh weight. Nitrogen Analysis: Plant tissue was then analyzed for Total Nitrogen Concentration using a Leco (C-H-N) Analyzer.


11 Planting GM


12


13


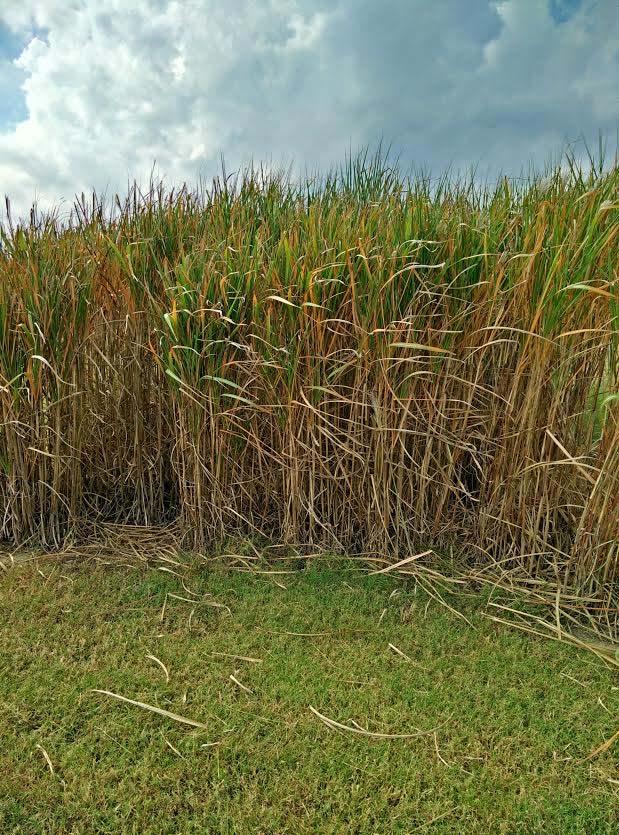
14 GM growth in Aug, 2013

15

16 GM growth on
17 Biomass Yield 2013
18 Harvested Biomass Treated with Synthe5c Fer5lizer Applica5on H1 Harvested (10/22/2013) Treatment Fresh Biomass (ton/ac) Tissue Moisture (%) Dry Biomass (ton/ac) T T T T T H2 Harvested (11/22/2013) Treatment Fresh Biomass (ton/ac) Tissue Moisture (%) Dry Biomass (ton/ac) T T T T T
, Harvest Date (P <0.")
, Harvest Date (P< 0.")
19 2013 Statistical Analyses Fertilizer Rate (P=0.0579), Harvest Date (P <0.0001), Interaction (P=0.51), CV = Fertilizer Rate(P=0.10), Harvest Date (P< 0.007), Interaction (P=0.46), CV= 32.91
20 Harvested Biomass Treated with Swine Slurry Application H1 Harvested (10/29/2013) Replication Fresh Biomass (ton/ac) Tissue Moisture (%) Dry Biomass (ton/ac) R R R R H2 Harvested (12/20/2013) Treatment Fresh Biomass (ton/ac) Tissue Moisture (%) Dry Biomass (ton/ac) R R R R
21 Biomass Yield
22 Harvested Biomass ( ) H1 Treatment Fresh Biomass (ton/ac) Tissue Moisture (%) Dry Biomass (ton/ac) T T T T T
23 Harvested Biomass 11/28/2014 H2 Treatment Fresh Biomass (ton/ac) Tissue Moisture (%) Dry Biomass (ton/ac) T T T T T
, Harvest Date (P <0.0001), Interaction (P=0.21), CV = 25.")
24 2014 Fresh Biomass Statistical Analysis Fertilizer Rate (P = ), Harvest Date (P <0.0001), Interaction (P=0.21), CV =
, Harvest Date (P = 0.0082), Interaction (P=0.")
25 2014 Dry Biomass Statistical Analysis Fertilizer Rate (P= ), Harvest Date (P = ), Interaction (P=0.13), CV = 21.52
26 Harvested Biomass Treated with Swine Slurry Application: (9/18/2014) Replication Fresh Biomass (ton/ac) Tissue Moisture (%) Dry Biomass (ton/ac) R R R R
27 Nitrogen Removal (2013) H1 Harvested: 10/22/2013 Treatment Leaf Stem Total T T T T T H2 Harvested: 11/22/2013 Treatment Leaf Stem Total T T T T T
28 Acknowledgements Evans-Allen Research Program, School of Agriculture and Environmental Sciences, NC A&T State University Dr. M. R. Reddy Dr. A. Shahbazi Mr. Matthew Miller