GIS, ArcView and BASINS. CEG 750 Thomas Piechota
|
|
|
- Christopher Ford
- 5 years ago
- Views:
Transcription
1 GIS, ArcView and BASINS CEG 750 Thomas Piechota
 Grid data (RASTER) Triangular")
2 Geographic Information Systems (GIS) What is GIS and ArcView? Digital spatial datasets.map information and table information Digital spatial datasets: Feature data (VECTOR) Grid data (RASTER) Triangular Irregular Network (TINs) Images
3 Examples
4 Examples
5 Examples
6 Examples
7 Examples
 Polygons Lines")
8 Feature Datasets (vector) Polygons Lines Points
")
9 Vector (Polygons) Datasets
")
10 Vector (Points) Datasets
")
11 Vector (Lines) Datasets

12 Grid (Raster) Datasets Vector Grid

13 ArcView GIS Software to open data files and perform analysis ArcView Projects: save the documents you have open ArcView Documents: Views Tables Charts Layouts

14 Views Interactive maps that let the user display, explore, query and analyze geographic data View Name Theme Name Current Theme Active Theme Theme Legend Themes are datasets displayed in a View

15 Table Documents Tables are arrays of data that let the user display, explore, query, and analyze tabular data Attribute Name Table Name Feature Shape

16 Chart Documents Charts are plots of table attribute values. They are dynamically linked.

17 Layout of Documents Layouts are the combination in a single page for presentation purposes only. Can be tables, charts, views, scale bars, north arrow, etc
18 Important Buttons pen Theme Open Theme Table Query Builder Zoom to Current Theme Identify (information)

19 BASINS Better Assessment Science Integrating Point and Nonpoint Sources (BASINS)
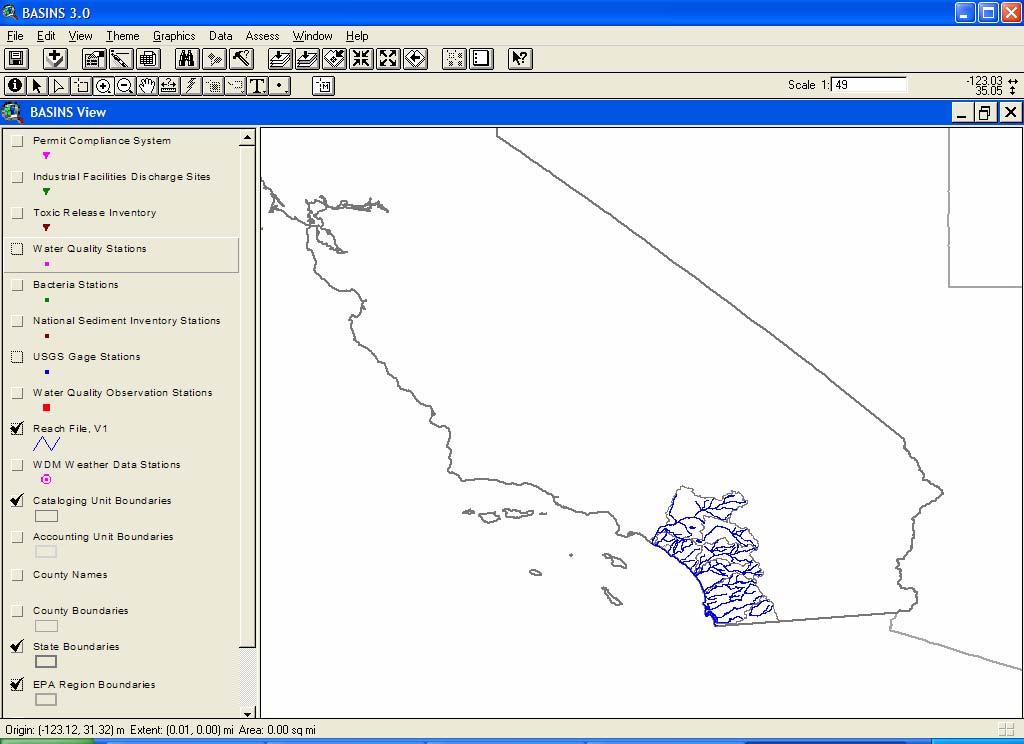
20 Base Cartographic Data

21 Environmental Background Data Ecoregions Land use land cover Soil DEM Reach file

22 Environmental Monitoring Data Water quality Bacteria monitoring Sediment Inventory USGS gages Drinking water supply sites
 Toxic Release Inventory")
23 Point Sources/Loading Data Permit Compliance System (PCS) Superfund National Priority List Industrial Facilities Discharge (IRD) Toxic Release Inventory (TRI)
24 Assessment Tools Target What watersheds exceed threshold levels? BASINS Assessment Tools Assess In a single watershed, what is the variability of concentrations? Data Mining For selected stations, how does the water quality vary?

25 What is the level of impairment? Target
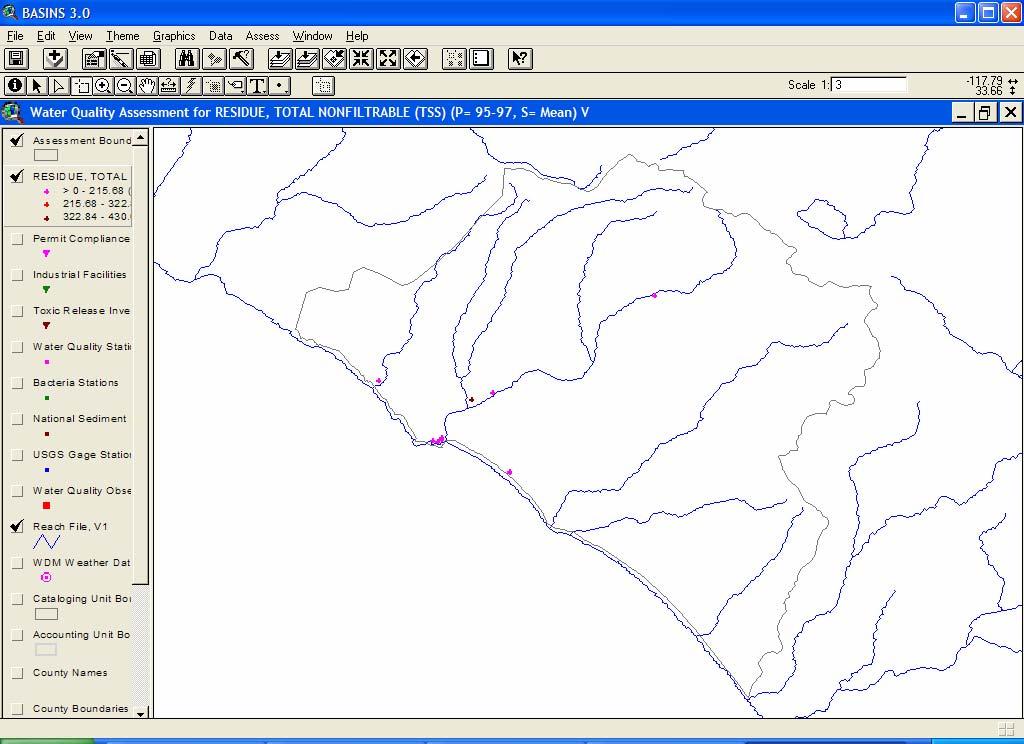
26 Assess

27 Data Mining
28 BASINS Utilities Watershed Delineation BASINS Data Import Tool BASINS Utilities Land Use Reclassification DEM Reclassification Lookup Table Query and View WQ Observation Data Management
29 Watershed Reports Point Source Inventory Water Quality Summary Report BASINS Watershed Characterization Reports Land Use Distribution Report Toxic Air Emission Report State Soil Characteristic Report Watershed Topographic Report
30 Stream Water Quality Model BASINS Stream WQ Model QUAL2E Analysis of pollutant fate and transport through selected stream systems. 1-D steady state Advection-dispersion
31 Watershed Models and Postprocessors SWAT Watershed-scale model to predict changes in WQ based on land management practices (agriculture) BASINS Watershed Models & Postprocessors WinHSPF GenScn WDMUtil Watershed model that simulates nonpoint source runoff and pollutant loadings and water quality routing Post processor and scenario analysis for use with SWAT and WinHSPF Watershed Data Management PLOAD GIS and spreadsheet tool to calculate nonpoint sources of pollution in a watershed
32 How Can BASINS be Used for TMDLs? Six Steps 1. Problem Identification 2. Target Analysis 3. Source Identification (point/nonpoint) 4. Linkage between Source and receiving water 5. Allocation 6. Implementation Plan TMDL = WLA + LA + MOS WLA = sum of all wasteload allocations from point sources LA = sum of all load allocations from nonpoint sources MOS = margin of safety
33 Linkages Between Sources and Receiving Water Impacts Climate WWTPs Land Use Management Practices Watershed Model Pollutant Loads Water Quality Model Water Quality Runoff Quantity
34 Models in Management Climate WWTPs Land Use Management Practices Watershed Model Pollutant Loads Runoff Quantity Water Quality Model Water Quality Adjust Land Use or Management Practices No Acceptable Quality and Quantity? Yes Done