NHDES ALTERATION OF TERRAIN PERMIT APPLICATION
|
|
|
- Abigayle Potter
- 5 years ago
- Views:
Transcription

1 NHDES ALTERATION OF TERRAIN PERMIT APPLICATION COLBY-SAWYER COLLEGE FINE & PERFORMING ARTS CENTER New London, New Hampshire
2 PO BOX 1825, 176 NEWPORT ROAD NEW LONDON, NH PHONE FAX APPLICATION FOR NHDES ALTERATION OF TERRAIN PERMIT FOR COLBY-SAWYER COLLEGE FINE & PERFORMING ARTS CENTER NEW LONDON, NH FEBRUARY 2016 PROJECT NUMBER Copyright 2016 Horizons Engineering, Inc. 17 Sunset Terrace 34 School Street 176 Newport Road Newport, VT Littleton, NH New London, NH Ph.: Ph: Ph: Fax: Fax: Fax:
3 TABLE OF CONTENTS * Information that is not applicable to this project is noted by N/A and is omitted from this report 1.0 AOT APPLICATION (unbound) AOT Signed Application AOT Application Fee (check) USGS Location Map 2.0 PROJECT INFORMATION NARRATIVE (bound report) 2.1 Copy of the Signed Application 2.2 Copy of the Application Fee (check) 2.3 USGS Location Map 2.4 Certified Mail Receipts 2.5 Application Checklist 2.6 Project Narrative Project Summary Existing Conditions Proposed Site Conditions & Disturbances Rainfall Data Peak Runoff Control Requirement Channel Protection Requirement Ground Water Recharge Volume 2.7 Surface Water Impairments 2.8 AOT Screening Layers 2.9 NHB Letter/Response 2.10 NRCS Soils Information (Web Soil Survey Map) 2.11 Aerial Photograph 2.12 Site Photographs 2.13 Extreme Precipitation Tables (Northeast Regional Climate Center) 3.0 DRAINAGE CALCULATIONS, ANALYSIS & DESIGN 3.1 Groundwater Recharge Volume (GRV) Calculations 3.2 BMP Worksheets for all Treatment Systems 3.3 Pre-development Analysis Node listing for the 2, 10 and 50 storm events Full summary and Diagram for the 10 year storm event 3.4 Post-development Analysis Node listing for the 2, 10 and 50 storm events Full summary and Diagram for the 10 year storm event 3.5 Stone Riprap Calculations (Energy Dissipation Stability Calculations) 3.6 Site Specific Soil Survey 3.7 Infiltration Feasibility Report 3.8 Inspection and Maintenance Manual 3.9 References Preparer s/reviewer s Certification
4 4.0 PLANS 4.1 Design Plans (unbound) 4.2 Certified Wetlands Plan N/A 4.3 Color Coded Hydrologic Soil Group Plans 4.4 Pre and Post Development Drainage Area Plans YEAR FLOODPLAIN REPORT N/A LIST OF TABLES Table 2.0 Table 2.0 2, 10 and 50 Year Comparison Table 2.1 Proposed Disturbance Area Breakdown Table Type II, 24 Hour Rainfall Depths for Project Site ( o N, o W) Table and 50 Year Comparison Table 2.4 Channel Protection Comparison Outlet Points
5 SECTION 1.0 AOT APPLICATION
6 THIS SECTION LEFT INTENTIONALLY BLANK
7 SECTION 2.0 PROJECT INFORMATION NARRATIVE
8 2.1 Copy of the Signed Application
9
10

11
12
13 2.2 Copy of the Application Fee (check)
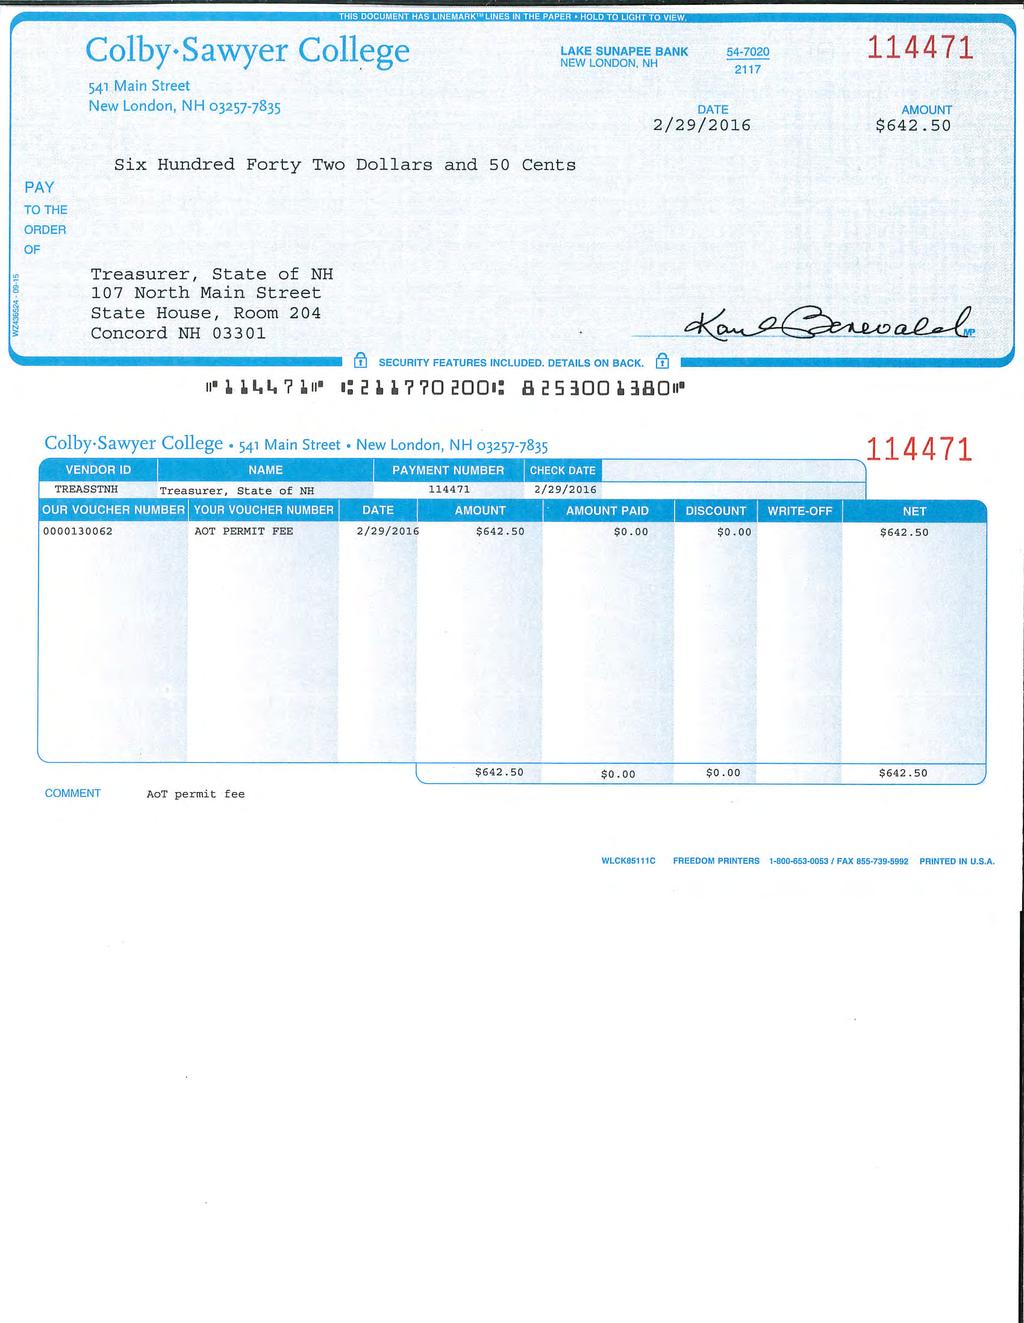
14
15 2.3 USGS Location Map

16 SITE 0 1,000 2,000 4,000 SCALE IN FEET Littleton NH New London NH Newport VT COLBY-SAWYER COLLEGE FINE & PERFORMING ARTS CENTER NEW LONDON, NEW HAMPSHIRE USGS LOCATION MAP PROJECT #: ENGIN'D BY: - DRAWN BY: WTD DATE: FEB 2016
17 2.4 Certified Mail Receipts
18 2.5 Application Check List
19 ATTACHMENT A: ALTERATION OF TERRAIN PERMIT APPLICATION CHECKLIST Check the box to indicate the item has been provided or provide an explanation why the item does not apply. DESIGN PLANS Plans printed on by white paper PE stamp Wetland delineation Temporary erosion control measures Treatment for all stormwater runoff from impervious surfaces such as roadways (including gravel roadways), parking areas, and non-residential roof runoff. Guidance on treatment BMPs can be found in Volume 2, Chapter 4 of the NH Stormwater Management Manual. Pre-existing 2-foot contours Proposed 2-foot contours Drainage easements protecting the drainage/treatment structures Compliance with the Wetlands Bureau, RSA 482- A Note that artificial detention in wetlands is not allowed. Compliance with the Comprehensive Shoreland Protection Act, RSA 483-B. Benches. Benching is needed if you have more than 20 feet change in elevation on a 2:1 slope, 30 feet change in elevation on a 3:1 slope, 40 feet change in elevation on a 4:1 slope. Check to see if any proposed ponds need state Dam permits. DETAILS Typical roadway x-section Detention basin with inverts noted on the outlet structure Stone berm level spreader Outlet protection riprap aprons A general installation detail for an erosion control blanket Silt fences or mulch berm Storm drain inlet protection. Note that since hay bales must be embedded 4 inches into the ground, they are not to be used on hard surfaces such as pavement. Hay bale barriers Ridge.Mauck@des.nh.gov or (603) NHDES Alteration of Terrain Bureau, PO Box 95, Concord, NH Alteration of Terrain Permit Application Form Valid Until 01/2017 Page 5 of 8
20 Stone check dams Gravel construction exit The treatment BMP s proposed Any innovative BMP s proposed CONSTRUCTION SEQUENCE/EROSION CONTROL Note that the project is to be managed in a manner that meets the requirements and intent of RSA 430:53 and Chapter Agr 3800 relative to invasive species. Note that perimeter controls shall be installed prior to earth moving operations Note that ponds and swales shall be installed early on in the construction sequence (before rough grading the site) Note that all ditches and swales shall be stabilized prior to directing runoff to them Note that all roadways and parking lots shall be stabilized within 72 hours of achieving finished grade Note that all cut and fill slopes shall be seeded/loamed within 72 hours of achieving finished grade Note that all erosion controls shall be inspected weekly AND after every half-inch of rainfall Note the limits on the open area allowed, see Env-Wq for detailed information Example note: The smallest practical area shall be disturbed during construction, but in no case shall exceed 5 acres at any one time before disturbed areas are stabilized Note the definition of the word stable Example note: An area shall be considered stable if one of the following has occurred: Base course gravels have been installed in areas to be paved A minimum of 85 percent vegetated growth has been established A minimum of 3 inches of non-erosive material such stone or riprap has been installed Or, erosion control blankets have been properly installed. Note the limit of time an area may be exposed Example note: All areas shall be stabilized within 45 days of initial disturbance Provide temporary and permanent seeding specifications. (Reed canary grass is listed in the Green Book; however, this is a problematic species according to the Wetlands Bureau and therefore should not be specified) Provide winter construction notes that meet or exceed our standards. Standard Winter Notes: All proposed vegetated areas that do not exhibit a minimum of 85 percent vegetative growth by October 15, or which are disturbed after October 15, shall be stabilized by seeding and installing erosion control blankets on slopes greater than 3:1, and seeding and placing 3 to 4 tons of mulch per acre, secured with anchored netting, elsewhere. The installation of erosion control blankets or mulch and netting shall not occur over accumulated snow or on frozen ground and shall be completed in advance of thaw or spring melt events. All ditches or swales which do not exhibit a minimum of 85 percent vegetative growth by October 15, or which are disturbed after October 15, shall be stabilized temporarily with stone or erosion control blankets appropriate for the design flow conditions. Ridge.Mauck@des.nh.gov or (603) NHDES Alteration of Terrain Bureau, PO Box 95, Concord, NH Alteration of Terrain Permit Application Form Valid Until 01/2017 Page 6 of 8
21 After November 15, incomplete road or parking surfaces, where work has stopped for the winter season, shall be protected with a minimum of 3 inches of crushed gravel per NHDOT item Note at the end of the construction sequence that Lot disturbance, other than that shown on the approved plans, shall not commence until after the roadway has the base course to design elevation and the associated drainage is complete and stable. This note is applicable to single/duplex family subdivisions, when lot development is not part of the permit. DRAINAGE ANALYSES Please double-side 8 ½ x 11 sheets where possible but, do not reduce the text such that more than one page fits on one side. PE stamp Rainfall amount obtained from the Northeast Regional Climate Center- Include extreme precipitation table as obtained from the above referenced website. Drainage analyses, in the following order: Pre-development analysis: Drainage diagram Pre-development analysis: Area Listing and Soil Listing Pre-development analysis: Node listing 1-year (if applicable), 2-year, 10-year and 50-year Pre-development analysis: Full summary of the 10-year storm Post-development analysis: Drainage diagram Post-development analysis: Area Listing and Soil Listing Post-development analysis: Node listing for the 2-year, 10-year and 50-year Post-development analysis: Full summary of the 10-year storm Review the Area Listing and Soil Listing reports Hydrologic soil groups (HSG) match the HSGs on the soil maps provided There is the same or less HSG A soil area after development (check for each HSG) There is the same or less woods cover in the post-development Undeveloped land was assumed to be in good condition The amount of impervious cover in the analyses is correct Note: A good check is to subtract the total impervious area used in the pre analysis from the total impervious area used in the post-analysis. For residential projects without demolition occurring, a good check is to take this change in impervious area, subtract out the roadway and divide the remaining by the number of houses/units proposed. Do these numbers make sense? Check the storage input used to model the ponds Check to see if the artificial berms pass the 50-year storm, i.e., make sure the constructed berms on ponds are not overtopped Check the outlet structure proposed and make sure it matches that modeled Check to see if the total areas in the pre and post analyses are same Confirm the correct NRCS storm type was modeled (Coos, Carroll & Grafton counties are Type II, all others Type III) Ridge.Mauck@des.nh.gov or (603) NHDES Alteration of Terrain Bureau, PO Box 95, Concord, NH Alteration of Terrain Permit Application Form Valid Until 01/2017 Page 7 of 8
22 PRE AND POST-DEVELOPMENT DRAINAGE AREA PLANS Plans printed on by on white paper Submit these plans separate from the soil plans A north arrow A scale Labeled subcatchments, reaches and ponds Tc lines A clear delineation of the subcatchment boundaries Roadway station numbers Culverts and other conveyance structures PRE AND POST-DEVELOPMENT COLOR-CODED SOIL PLANS 11 x 17 sheets suitable, as long as it is readable Submit these plans separate from the drainage area plans A north arrow A scale Name of the soil scientist who performed the survey and date the soil survey took place 2-foot contours (5-foot contours if application is for a gravel pit) as well as other surveyed features Delineation of the soil boundaries and wetland boundaries Delineation of the subcatchment boundaries Soil series symbols (e.g., 26) A key or legend which identifies each soil series symbol and its associated soil series name (e.g., 26 = Windsor) The hydrologic soil group color coding (A = Green, B = yellow, C= orange, D=red, Water=blue, & Impervious = gray) Please note that excavation projects (e.g., gravel pits) have similar requirements to that above, however the following are common exceptions/additions: Drainage report is not needed if site does not have off-site flow. 5 foot contours allowed rather than 2 foot. No PE stamp needed on the plans Add a note to the plans that the applicant must submit to the Department of Environmental Services a written update of the project and revised plans documenting the project status every five years from the date of the Alteration of Terrain permit. Add reclamation notes. See NRCS publication titled: Vegetating New Hampshire Sand and Gravel Pits for a good resource, it is posted online at: Ridge.Mauck@des.nh.gov or (603) NHDES Alteration of Terrain Bureau, PO Box 95, Concord, NH Alteration of Terrain Permit Application Form Valid Until 01/2017 Page 8 of 8
23 2.6 Project Narrative
24 2.6.1 Project Summary Colby-Sawyer College is applying for an Alteration of Terrain (AoT) permit from the New Hampshire Department of Environmental Services (NHDES) for the construction of a Fine & Performing Arts Center building, sidewalks, landscaping, and drainage features. The project is located in the town of New London, NH, on Tax Map 85, Lot 33. The disturbance area for the proposed project, when combined with other projects completed on campus within the last 10 years, is greater than 100,000 square feet. Therefore the applicant has prepared an AoT permit application for this project. Excavation and fill for building foundation and site work will be required to complete the improvements. New impervious surfaces will include building roof and walkways. The total disturbance for this work is 78,500 square feet. The total proposed post-project impervious area within the disturbed area is 20,932 square feet. The total proposed post-project impervious area within the watershed area modeled is 26,093 square feet. Stormwater from impervious surfaces will be directed to stone drip edges or a micro-extended detention pond. The following table shows the 2, 10 and 50 year peak flow rate comparison at the discharge points. Table 2.0 2, 10 and 50 Year Comparison Watershed Area Discharge Point Pre 2 Yr Flow Rate (cfs) Post 2 Yr Flow Rate (cfs) Pre 10 Yr Flow Rate (cfs) Post 10 Yr Flow Rate (cfs) Pre 50 Yr Flow Rate (cfs) Post 50 Yr Flow Rate (cfs) Dp Dp Impacts to watershed water quality from grading within the watersheds are likely from uncontrolled discharge of site runoff during construction activities and stabilized post-project surfaces. To minimize the impacts to the watersheds, the site has been designed to cause no increase in runoff and erosion control methods have been sized in accordance with the Env-Wq 1500 and the New Hampshire Stormwater Management Manual (December, 2008) Existing Site Conditions The site is located on the Colby-Sawyer College campus between the Windy Hill School and the Curtis L. Ivey Science Center on the site of the Colby Farm building. The site surfaces include a mix of grass, gravel, building roof, and pavement. The site was reviewed for wetlands and there are no wetlands within the proposed disturbance area. No wetland impacts are proposed as part of this project. The project site slopes to the east towards an open meadow and eventually to a wetland stream on campus Proposed Site Conditions & Disturbances Approximately 78,500 square feet of earth disturbance will be required to construct the proposed project. An area of disturbance breakdown has been shown in Table
25 * EIC = Effective Impervious Cover * UDC = Undisturbed Cover Table 2.1 Proposed Disturbance Area Breakdown Construction/Disturbance Activity The total connected impervious area listed with EIC of 26.7% is the EIC within the proposed disturbance area. The total impervious area (within drainage area) of 31.2% is the total impervious area within the entire watershed modeled. The impacts to water quality during site development will be minimized using erosion control measures. Frequent site inspections during construction are required during or directly following rainfall events to ensure erosion control devices are working properly. A copy of the Stormwater Inspection and Maintenance Manual can be found in Section 3.8 of this report Rainfall Data Area (square feet) Using SCS TR-20, run under HydroCAD Version 10.0 with Type III-24 hour rainfall events, pre- and post-development cover types and drainage paths were modeled to generate peak discharge rates. Rainfall events modeled have intensities described by data provided by the Northeast Regional Climate Center for the geographic location of the project. These data are provided in full in section 2.13 of this report, and are summarized below in Table 2.2. Table Type III, 24 Hour Rainfall Depths for Project Site ( o N, o W) Rainfall Event Depth* 1-Year Year Year Year 5.61 * Rainfall depths from the Northeast Regional Climate Center Extreme Precipitation Tables, accessed 10 December 2015, See section 2.13 % EIC * % UDC * Total Connected Impervious Area 20, % - Total Disconnected Impervious Area 0 0.0% - Grading and Site Disturbance 57, Total Disturbance 78,500 Total Impervious Area (within Drainage Area ) 26, % Total Undisturbed Area (within Drainage Area ) 5, % Total Drainage Area 83,583 2
26 2.6.5 Peak Runoff Control Requirement Due to the post-project grading of the site and changes in land cover, stormwater devices were used to attenuate flow in order to meet the Peak Runoff Control requirements of Env-Wq Table 2.3 summarizes the stormwater runoff peak flow rate for the 10 and 50 year storm events. Table and 50 Year Comparison Watershed Area Discharge Point Pre 10 Yr Flow Rate (cfs) Post 10 Yr Flow Rate (cfs) Pre 50 Yr Flow Rate (cfs) Post 50 Yr Flow Rate (cfs) Dp Dp Channel Protection Requirement NHDES requires that the receiving waters and downstream wetland channels be protected from erosion and sedimentation resulting from the project development. In order to show no impact to offsite channels, analysis of the proposed drainage system must meet one of the conditions in Env-Wq Table 2.4 summarizes the flow data with respect to Channel Protection. The final discharge point off-site, Dp4, meets Env-Wq (b) (1) (b). Outlet point Table 2.4 Channel Protection Comparison Outlet Points Pre 2 Yr Flow Rate (cfs) Post 2 Yr Flow Rate (cfs) Pre 2yr Vol. acre-feet (af) Post 2yr Vol. acre-feet (af) Dp Dp Groundwater Recharge Volume Under Env-Wq , NHDES requires a portion of the stormwater runoff be infiltrated to protect groundwater resources by reducing the amount of water diverted off-site by the proposed disturbance. The amount of groundwater recharge required per soil group is summarized in Table 2.5. An infiltration practice has been included in the proposed design. The stone drip edge infiltration practice provides 288 cubic feet of groundwater recharge through infiltration. 3
27 HSG Table 2.5 Groundwater Recharge Volume Comparison Required Groundwater Recharge Depth (in) Net Proposed Effective Impervious Area (Acres) GRV Required by NHDES (cubic feet) GRV Provided (cubic feet) A B C D Total
28 2.7 Surface Water Impairments
29 COLBY-SAWYER COLLEGE NH ONESTOP GIS HORIZONS ENGINEERING, INC. FINE & PERFORMING ARTS CENTERSURFACE WATER IMPAIRMENTS 05 FEBRUARY Surface Water Impairments with 1-Mile Buffer for Development Projects (Features returned: 0)


30 COLBY-SAWYER COLLEGE - FPAC - SURFACE WATER IMPAIRMENTS LAYER Page 1 of 1 2/5/2016 OneStop Program GIS COLBY-SAWYER COLLEGE - FPAC - SURFACE WATER IMPAIRMENTS LAYER Map Scale = 1 : (1" = 1930 feet or 0.4 miles) The information contained in the OneStop Program GIS is the best available according to the procedures and standards of each of the contributing programs and of the GIS. The different programs are regularly maintaining the information in their databases. As a result, the GIS may not always provide access to all existing information, and it may occasionally contain unintentional inaccuracies. The Department can not be responsible for the misuse or misinterpretation of the information presented by this system. Map prepared 2/5/ :58:51 PM Developed in cooperation with NH GRANIT
31 2.8 AOT Screening Layers
32 COLBY-SAWYER COLLEGE NH ONESTOP GIS HORIZONS ENGINEERING, INC. FINE & PERFORMING ARTS CENTER AOT SCREENING LAYERS 05 FEBRUARY 2016 Wellhead Protection Area (Features returned: 0) GAA Groundwater Classification Area (Features returned: 0) GA1 Groundwater Classification Area (Features returned: 0) Public Water Supply Sources (Features returned: 0) Aquifer Transmissity (Features returned: 0) Aquifer Saturated Thickness Contours (feet) (Features returned: 0) Water Supply Intake 1/4-Mile Radii (Features returned: 0)


33 COLBY-SAWYER COLLEGE - FPAC - AOT SCREENING LAYERS Page 1 of 1 2/5/2016 OneStop Program GIS COLBY-SAWYER COLLEGE - FPAC - AOT SCREENING LAYERS Map Scale = 1 : (1" = 1485 feet or 0.3 miles) The information contained in the OneStop Program GIS is the best available according to the procedures and standards of each of the contributing programs and of the GIS. The different programs are regularly maintaining the information in their databases. As a result, the GIS may not always provide access to all existing information, and it may occasionally contain unintentional inaccuracies. The Department can not be responsible for the misuse or misinterpretation of the information presented by this system. Map prepared 2/5/ :54:01 PM Developed in cooperation with NH GRANIT
34 2.9 NHB Letter/Response
35 New Hampshire Natural Heritage Bureau To: Will Davis PO Box 1825 New London, NH Date: 1/29/2016 From: NH Natural Heritage Bureau Re: Review by NH Natural Heritage Bureau of request dated 1/29/2016 NHB File ID: NHB Location: Tax Map(s)/Lot(s): Tax Map 85 Lot 33 New London Project Description: Remove exisitng building and construct a new building with associated walks, utility services, landscaping, and drainage features. Applicant: Will Davis The NH Natural Heritage database has been checked for records of rare species and exemplary natural communities near the area mapped below. The species considered include those listed as Threatened or Endangered by either the state of New Hampshire or the federal government. We currently have no recorded occurrences for sensitive species near this project area. A negative result (no record in our database) does not mean that a sensitive species is not present. Our data can only tell you of known occurrences, based on information gathered by qualified biologists and reported to our office. However, many areas have never been surveyed, or have only been surveyed for certain species. An on-site survey would provide better information on what species and communities are indeed present. This report is valid through 1/28/2017. Department of Resources and Economic Development DRED/NHB Division of Forests and Lands 172 Pembroke Road (603) fax: Concord NH 03301
 271-2214 fax: 271-6488 Concord NH")
36 New Hampshire Natural Heritage Bureau MAP OF PROJECT BOUNDARIES FOR NHB FILE ID: NHB Department of Resources and Economic Development DRED/NHB Division of Forests and Lands 172 Pembroke Road (603) fax: Concord NH 03301
37 2.10 NRCS Soils Information (Web Soils Survey Map)

38 United States Department of Agriculture Natural Resources Conservation Service A product of the National Cooperative Soil Survey, a joint effort of the United States Department of Agriculture and other Federal agencies, State agencies including the Agricultural Experiment Stations, and local participants Custom Soil Resource Report for Merrimack and Belknap Counties, New Hampshire Colby-Sawyer College - F&PAC February 2, 2016
39 Preface Soil surveys contain information that affects land use planning in survey areas. They highlight soil limitations that affect various land uses and provide information about the properties of the soils in the survey areas. Soil surveys are designed for many different users, including farmers, ranchers, foresters, agronomists, urban planners, community officials, engineers, developers, builders, and home buyers. Also, conservationists, teachers, students, and specialists in recreation, waste disposal, and pollution control can use the surveys to help them understand, protect, or enhance the environment. Various land use regulations of Federal, State, and local governments may impose special restrictions on land use or land treatment. Soil surveys identify soil properties that are used in making various land use or land treatment decisions. The information is intended to help the land users identify and reduce the effects of soil limitations on various land uses. The landowner or user is responsible for identifying and complying with existing laws and regulations. Although soil survey information can be used for general farm, local, and wider area planning, onsite investigation is needed to supplement this information in some cases. Examples include soil quality assessments ( nrcs/main/soils/health/) and certain conservation and engineering applications. For more detailed information, contact your local USDA Service Center ( offices.sc.egov.usda.gov/locator/app?agency=nrcs) or your NRCS State Soil Scientist ( cid=nrcs142p2_053951). Great differences in soil properties can occur within short distances. Some soils are seasonally wet or subject to flooding. Some are too unstable to be used as a foundation for buildings or roads. Clayey or wet soils are poorly suited to use as septic tank absorption fields. A high water table makes a soil poorly suited to basements or underground installations. The National Cooperative Soil Survey is a joint effort of the United States Department of Agriculture and other Federal agencies, State agencies including the Agricultural Experiment Stations, and local agencies. The Natural Resources Conservation Service (NRCS) has leadership for the Federal part of the National Cooperative Soil Survey. Information about soils is updated periodically. Updated information is available through the NRCS Web Soil Survey, the site for official soil survey information. The U.S. Department of Agriculture (USDA) prohibits discrimination in all its programs and activities on the basis of race, color, national origin, age, disability, and where applicable, sex, marital status, familial status, parental status, religion, sexual orientation, genetic information, political beliefs, reprisal, or because all or a part of an individual's income is derived from any public assistance program. (Not all prohibited bases apply to all programs.) Persons with disabilities who require alternative means 2
40 for communication of program information (Braille, large print, audiotape, etc.) should contact USDA's TARGET Center at (202) (voice and TDD). To file a complaint of discrimination, write to USDA, Director, Office of Civil Rights, 1400 Independence Avenue, S.W., Washington, D.C or call (800) (voice) or (202) (TDD). USDA is an equal opportunity provider and employer. 3
41 Contents Preface...2 Soil Map...5 Soil Map...6 Legend...7 Map Unit Legend...8 Map Unit Descriptions...8 Merrimack and Belknap Counties, New Hampshire B Peru fine sandy loam, 3 to 8 percent slopes C Peru fine sandy loam, 8 to 15 percent slopes C Peru fine sandy loam, 8 to 15 percent slopes, very stony...13 References
42 Soil Map The soil map section includes the soil map for the defined area of interest, a list of soil map units on the map and extent of each map unit, and cartographic symbols displayed on the map. Also presented are various metadata about data used to produce the map, and a description of each soil map unit. 5

43 71 58' 29'' W Custom Soil Resource Report Soil Map 71 58' 12'' W 43 24' 42'' N 43 24' 34'' N ' 42'' N 43 24' 34'' N 71 58' 29'' W N Map Scale: 1:1,730 if printed on A landscape (11" x 8.5") sheet. Meters Feet Map projection: Web Mercator Corner coordinates: WGS84 Edge tics: UTM Zone 19N WGS ' 12'' W
44 Custom Soil Resource Report MAP LEGEND MAP INFORMATION Area of Interest (AOI) Area of Interest (AOI) Soils Soil Map Unit Polygons Soil Map Unit Lines Soil Map Unit Points Special Point Features Blowout Borrow Pit Clay Spot Closed Depression Gravel Pit Gravelly Spot Landfill Lava Flow Marsh or swamp Mine or Quarry Miscellaneous Water Perennial Water Rock Outcrop Saline Spot Sandy Spot Severely Eroded Spot Sinkhole Slide or Slip Sodic Spot Spoil Area Stony Spot Very Stony Spot Wet Spot Other Special Line Features Water Features Streams and Canals Transportation Rails Interstate Highways US Routes Major Roads Local Roads Background Aerial Photography The soil surveys that comprise your AOI were mapped at 1:24,000. Warning: Soil Map may not be valid at this scale. Enlargement of maps beyond the scale of mapping can cause misunderstanding of the detail of mapping and accuracy of soil line placement. The maps do not show the small areas of contrasting soils that could have been shown at a more detailed scale. Please rely on the bar scale on each map sheet for map measurements. Source of Map: Natural Resources Conservation Service Web Soil Survey URL: Coordinate System: Web Mercator (EPSG:3857) Maps from the Web Soil Survey are based on the Web Mercator projection, which preserves direction and shape but distorts distance and area. A projection that preserves area, such as the Albers equal-area conic projection, should be used if more accurate calculations of distance or area are required. This product is generated from the USDA-NRCS certified data as of the version date(s) listed below. Soil Survey Area: Merrimack and Belknap Counties, New Hampshire Survey Area Data: Version 20, Sep 22, 2015 Soil map units are labeled (as space allows) for map scales 1:50,000 or larger. Date(s) aerial images were photographed: Apr 8, 2011 May 1, 2011 The orthophoto or other base map on which the soil lines were compiled and digitized probably differs from the background imagery displayed on these maps. As a result, some minor shifting of map unit boundaries may be evident. 7
45 Custom Soil Resource Report Map Unit Legend Merrimack and Belknap Counties, New Hampshire (NH609) Map Unit Symbol Map Unit Name Acres in AOI Percent of AOI 378B Peru fine sandy loam, 3 to 8 percent slopes 378C Peru fine sandy loam, 8 to 15 percent slopes 379C Peru fine sandy loam, 8 to 15 percent slopes, very stony % % % Totals for Area of Interest % Map Unit Descriptions The map units delineated on the detailed soil maps in a soil survey represent the soils or miscellaneous areas in the survey area. The map unit descriptions, along with the maps, can be used to determine the composition and properties of a unit. A map unit delineation on a soil map represents an area dominated by one or more major kinds of soil or miscellaneous areas. A map unit is identified and named according to the taxonomic classification of the dominant soils. Within a taxonomic class there are precisely defined limits for the properties of the soils. On the landscape, however, the soils are natural phenomena, and they have the characteristic variability of all natural phenomena. Thus, the range of some observed properties may extend beyond the limits defined for a taxonomic class. Areas of soils of a single taxonomic class rarely, if ever, can be mapped without including areas of other taxonomic classes. Consequently, every map unit is made up of the soils or miscellaneous areas for which it is named and some minor components that belong to taxonomic classes other than those of the major soils. Most minor soils have properties similar to those of the dominant soil or soils in the map unit, and thus they do not affect use and management. These are called noncontrasting, or similar, components. They may or may not be mentioned in a particular map unit description. Other minor components, however, have properties and behavioral characteristics divergent enough to affect use or to require different management. These are called contrasting, or dissimilar, components. They generally are in small areas and could not be mapped separately because of the scale used. Some small areas of strongly contrasting soils or miscellaneous areas are identified by a special symbol on the maps. If included in the database for a given area, the contrasting minor components are identified in the map unit descriptions along with some characteristics of each. A few areas of minor components may not have been observed, and consequently they are not mentioned in the descriptions, especially where the pattern was so complex that it was impractical to make enough observations to identify all the soils and miscellaneous areas on the landscape. The presence of minor components in a map unit in no way diminishes the usefulness or accuracy of the data. The objective of mapping is not to delineate pure taxonomic classes but rather to separate the landscape into landforms or landform segments that have similar use and management requirements. The delineation of such segments 8
46 Custom Soil Resource Report on the map provides sufficient information for the development of resource plans. If intensive use of small areas is planned, however, onsite investigation is needed to define and locate the soils and miscellaneous areas. An identifying symbol precedes the map unit name in the map unit descriptions. Each description includes general facts about the unit and gives important soil properties and qualities. Soils that have profiles that are almost alike make up a soil series. Except for differences in texture of the surface layer, all the soils of a series have major horizons that are similar in composition, thickness, and arrangement. Soils of one series can differ in texture of the surface layer, slope, stoniness, salinity, degree of erosion, and other characteristics that affect their use. On the basis of such differences, a soil series is divided into soil phases. Most of the areas shown on the detailed soil maps are phases of soil series. The name of a soil phase commonly indicates a feature that affects use or management. For example, Alpha silt loam, 0 to 2 percent slopes, is a phase of the Alpha series. Some map units are made up of two or more major soils or miscellaneous areas. These map units are complexes, associations, or undifferentiated groups. A complex consists of two or more soils or miscellaneous areas in such an intricate pattern or in such small areas that they cannot be shown separately on the maps. The pattern and proportion of the soils or miscellaneous areas are somewhat similar in all areas. Alpha-Beta complex, 0 to 6 percent slopes, is an example. An association is made up of two or more geographically associated soils or miscellaneous areas that are shown as one unit on the maps. Because of present or anticipated uses of the map units in the survey area, it was not considered practical or necessary to map the soils or miscellaneous areas separately. The pattern and relative proportion of the soils or miscellaneous areas are somewhat similar. Alpha- Beta association, 0 to 2 percent slopes, is an example. An undifferentiated group is made up of two or more soils or miscellaneous areas that could be mapped individually but are mapped as one unit because similar interpretations can be made for use and management. The pattern and proportion of the soils or miscellaneous areas in a mapped area are not uniform. An area can be made up of only one of the major soils or miscellaneous areas, or it can be made up of all of them. Alpha and Beta soils, 0 to 2 percent slopes, is an example. Some surveys include miscellaneous areas. Such areas have little or no soil material and support little or no vegetation. Rock outcrop is an example. 9
47 Custom Soil Resource Report Merrimack and Belknap Counties, New Hampshire 378B Peru fine sandy loam, 3 to 8 percent slopes Map Unit Setting National map unit symbol: 2ty5y Elevation: 230 to 1,770 feet Mean annual precipitation: 31 to 95 inches Mean annual air temperature: 27 to 52 degrees F Frost-free period: 90 to 160 days Farmland classification: All areas are prime farmland Map Unit Composition Peru and similar soils: 84 percent Minor components: 16 percent Estimates are based on observations, descriptions, and transects of the mapunit. Description of Peru Setting Landform: Hills, mountains Landform position (two-dimensional): Backslope, footslope Landform position (three-dimensional): Mountainbase, interfluve Down-slope shape: Convex Across-slope shape: Linear Parent material: Loamy lodgment till derived from granite and/or loamy lodgment till derived from mica schist and/or loamy lodgment till derived from phyllite Typical profile Ap - 0 to 6 inches: fine sandy loam Bhs - 6 to 8 inches: fine sandy loam Bs1-8 to 12 inches: fine sandy loam Bs2-12 to 18 inches: fine sandy loam Bs3-18 to 21 inches: fine sandy loam BC - 21 to 24 inches: fine sandy loam Cd - 24 to 65 inches: sandy loam Properties and qualities Slope: 3 to 8 percent Depth to restrictive feature: 20 to 39 inches to densic material Natural drainage class: Moderately well drained Capacity of the most limiting layer to transmit water (Ksat): Moderately low to moderately high (0.01 to 1.42 in/hr) Depth to water table: About 16 to 30 inches Frequency of flooding: None Frequency of ponding: None Salinity, maximum in profile: Nonsaline to very slightly saline (0.0 to 2.0 mmhos/cm) Available water storage in profile: Low (about 3.7 inches) Interpretive groups Land capability classification (irrigated): None specified Land capability classification (nonirrigated): 2e Hydrologic Soil Group: C/D 10
48 Custom Soil Resource Report Minor Components Marlow Percent of map unit: 6 percent Landform: Hills, mountains Landform position (two-dimensional): Summit, shoulder, backslope Landform position (three-dimensional): Mountainbase, interfluve Microfeatures of landform position: Rises, rises Down-slope shape: Convex Across-slope shape: Convex Colonel Percent of map unit: 4 percent Landform: Hills, mountains Landform position (two-dimensional): Footslope Landform position (three-dimensional): Mountainbase, interfluve Microfeatures of landform position: Closed depressions, closed depressions Down-slope shape: Linear, concave Across-slope shape: Concave Cabot Percent of map unit: 4 percent Landform: Hills, mountains Landform position (two-dimensional): Toeslope, footslope Landform position (three-dimensional): Mountainbase, interfluve Microfeatures of landform position: Closed depressions, closed depressions Down-slope shape: Concave Across-slope shape: Concave Lyman Percent of map unit: 2 percent Landform: Hills, mountains Landform position (two-dimensional): Shoulder, summit, backslope Landform position (three-dimensional): Mountainbase, interfluve Microfeatures of landform position: Rises, rises Down-slope shape: Convex Across-slope shape: Convex 378C Peru fine sandy loam, 8 to 15 percent slopes Map Unit Setting National map unit symbol: 2ty60 Elevation: 330 to 1,870 feet Mean annual precipitation: 31 to 95 inches Mean annual air temperature: 27 to 52 degrees F Frost-free period: 90 to 160 days Farmland classification: Farmland of statewide importance Map Unit Composition Peru and similar soils: 83 percent 11
49 Custom Soil Resource Report Minor components: 17 percent Estimates are based on observations, descriptions, and transects of the mapunit. Description of Peru Setting Landform: Hills, mountains Landform position (two-dimensional): Backslope, footslope Landform position (three-dimensional): Mountainbase, mountainflank, interfluve, side slope, nose slope Down-slope shape: Convex Across-slope shape: Linear Parent material: Loamy lodgment till derived from granite and/or loamy lodgment till derived from mica schist and/or loamy lodgment till derived from phyllite Typical profile Ap - 0 to 6 inches: fine sandy loam Bhs - 6 to 8 inches: fine sandy loam Bs1-8 to 12 inches: fine sandy loam Bs2-12 to 18 inches: fine sandy loam Bs3-18 to 21 inches: fine sandy loam BC - 21 to 24 inches: fine sandy loam Cd - 24 to 65 inches: sandy loam Properties and qualities Slope: 8 to 15 percent Depth to restrictive feature: 20 to 39 inches to densic material Natural drainage class: Moderately well drained Capacity of the most limiting layer to transmit water (Ksat): Moderately low to moderately high (0.01 to 1.42 in/hr) Depth to water table: About 16 to 30 inches Frequency of flooding: None Frequency of ponding: None Salinity, maximum in profile: Nonsaline to very slightly saline (0.0 to 2.0 mmhos/cm) Available water storage in profile: Low (about 3.7 inches) Interpretive groups Land capability classification (irrigated): None specified Land capability classification (nonirrigated): 3e Hydrologic Soil Group: C/D Minor Components Colonel Percent of map unit: 7 percent Landform: Hills, mountains Landform position (two-dimensional): Footslope Landform position (three-dimensional): Mountainbase, mountainflank, nose slope, interfluve, side slope Microfeatures of landform position: Open depressions, open depressions, closed depressions, closed depressions Down-slope shape: Linear, concave Across-slope shape: Concave Marlow Percent of map unit: 4 percent Landform: Hills, mountains 12
50 Custom Soil Resource Report Landform position (two-dimensional): Summit, shoulder, backslope Landform position (three-dimensional): Mountainbase, mountainflank, interfluve, nose slope, side slope Microfeatures of landform position: Rises, rises Down-slope shape: Convex Across-slope shape: Convex Cabot Percent of map unit: 4 percent Landform: Hills, mountains Landform position (two-dimensional): Toeslope, footslope Landform position (three-dimensional): Mountainbase, mountainflank, side slope, interfluve, nose slope Microfeatures of landform position: Open depressions, open depressions, closed depressions, closed depressions Down-slope shape: Concave Across-slope shape: Concave Tunbridge Percent of map unit: 2 percent Landform: Hills, mountains Landform position (two-dimensional): Shoulder, summit, backslope Landform position (three-dimensional): Mountainbase, mountainflank, interfluve, nose slope, side slope Microfeatures of landform position: Rises, rises Down-slope shape: Convex Across-slope shape: Convex 379C Peru fine sandy loam, 8 to 15 percent slopes, very stony Map Unit Setting National map unit symbol: 2ty65 Elevation: 360 to 2,160 feet Mean annual precipitation: 31 to 95 inches Mean annual air temperature: 27 to 52 degrees F Frost-free period: 90 to 160 days Farmland classification: Farmland of local importance Map Unit Composition Peru, very stony, and similar soils: 84 percent Minor components: 16 percent Estimates are based on observations, descriptions, and transects of the mapunit. Description of Peru, Very Stony Setting Landform: Hills, mountains Landform position (two-dimensional): Backslope, footslope Landform position (three-dimensional): Mountainbase, mountainflank, interfluve, side slope, nose slope 13
51 Custom Soil Resource Report Down-slope shape: Convex Across-slope shape: Linear Parent material: Loamy lodgment till derived from granite and/or loamy lodgment till derived from mica schist and/or loamy lodgment till derived from phyllite Typical profile Oe - 0 to 1 inches: moderately decomposed plant material A - 1 to 5 inches: fine sandy loam E - 5 to 6 inches: fine sandy loam Bs1-6 to 7 inches: fine sandy loam Bs2-7 to 13 inches: fine sandy loam Bs3-13 to 18 inches: fine sandy loam BC - 18 to 21 inches: fine sandy loam Cd1-21 to 37 inches: fine sandy loam Cd2-37 to 65 inches: fine sandy loam Properties and qualities Slope: 8 to 15 percent Percent of area covered with surface fragments: 1.1 percent Depth to restrictive feature: 21 to 43 inches to densic material Natural drainage class: Moderately well drained Capacity of the most limiting layer to transmit water (Ksat): Moderately low to moderately high (0.01 to 1.42 in/hr) Depth to water table: About 17 to 34 inches Frequency of flooding: None Frequency of ponding: None Salinity, maximum in profile: Nonsaline to very slightly saline (0.0 to 2.0 mmhos/cm) Available water storage in profile: Low (about 3.6 inches) Interpretive groups Land capability classification (irrigated): None specified Land capability classification (nonirrigated): 6s Hydrologic Soil Group: D Minor Components Marlow, very stony Percent of map unit: 6 percent Landform: Hills, mountains Landform position (two-dimensional): Summit, shoulder, backslope Landform position (three-dimensional): Mountainbase, mountainflank, interfluve, side slope, nose slope Microfeatures of landform position: Rises, rises Down-slope shape: Convex Across-slope shape: Convex Cabot, very stony Percent of map unit: 4 percent Landform: Hills, mountains Landform position (two-dimensional): Toeslope, footslope Landform position (three-dimensional): Mountainbase, mountainflank, interfluve, side slope, nose slope Microfeatures of landform position: Open depressions, open depressions, closed depressions, closed depressions Down-slope shape: Concave Across-slope shape: Concave 14
52 Custom Soil Resource Report Lyman, very stony Percent of map unit: 3 percent Landform: Hills, mountains Landform position (two-dimensional): Shoulder, summit, backslope Landform position (three-dimensional): Mountainflank, mountainbase, interfluve, side slope, nose slope Microfeatures of landform position: Rises, rises Down-slope shape: Convex Across-slope shape: Convex Colonel, very stony Percent of map unit: 3 percent Landform: Hills, mountains Landform position (two-dimensional): Footslope Landform position (three-dimensional): Mountainbase, mountainflank, interfluve, side slope, nose slope Microfeatures of landform position: Open depressions, open depressions, closed depressions, closed depressions Down-slope shape: Linear, concave Across-slope shape: Concave 15
53 References American Association of State Highway and Transportation Officials (AASHTO) Standard specifications for transportation materials and methods of sampling and testing. 24th edition. American Society for Testing and Materials (ASTM) Standard classification of soils for engineering purposes. ASTM Standard D Cowardin, L.M., V. Carter, F.C. Golet, and E.T. LaRoe Classification of wetlands and deep-water habitats of the United States. U.S. Fish and Wildlife Service FWS/OBS-79/31. Federal Register. July 13, Changes in hydric soils of the United States. Federal Register. September 18, Hydric soils of the United States. Hurt, G.W., and L.M. Vasilas, editors. Version 6.0, Field indicators of hydric soils in the United States. National Research Council Wetlands: Characteristics and boundaries. Soil Survey Division Staff Soil survey manual. Soil Conservation Service. U.S. Department of Agriculture Handbook detail/national/soils/?cid=nrcs142p2_ Soil Survey Staff Soil taxonomy: A basic system of soil classification for making and interpreting soil surveys. 2nd edition. Natural Resources Conservation Service, U.S. Department of Agriculture Handbook nrcs/detail/national/soils/?cid=nrcs142p2_ Soil Survey Staff Keys to soil taxonomy. 11th edition. U.S. Department of Agriculture, Natural Resources Conservation Service. portal/nrcs/detail/national/soils/?cid=nrcs142p2_ Tiner, R.W., Jr Wetlands of Delaware. U.S. Fish and Wildlife Service and Delaware Department of Natural Resources and Environmental Control, Wetlands Section. United States Army Corps of Engineers, Environmental Laboratory Corps of Engineers wetlands delineation manual. Waterways Experiment Station Technical Report Y United States Department of Agriculture, Natural Resources Conservation Service. National forestry manual. home/?cid=nrcs142p2_ United States Department of Agriculture, Natural Resources Conservation Service. National range and pasture handbook. detail/national/landuse/rangepasture/?cid=stelprdb
54 Custom Soil Resource Report United States Department of Agriculture, Natural Resources Conservation Service. National soil survey handbook, title 430-VI. nrcs/detail/soils/scientists/?cid=nrcs142p2_ United States Department of Agriculture, Natural Resources Conservation Service Land resource regions and major land resource areas of the United States, the Caribbean, and the Pacific Basin. U.S. Department of Agriculture Handbook cid=nrcs142p2_ United States Department of Agriculture, Soil Conservation Service Land capability classification. U.S. Department of Agriculture Handbook
55 2.11 Aerial Photograph


56 SITE 0 1,000 2,000 4,000 SCALE IN FEET COLBY-SAWYER COLLEGE PROJECT #: FINE & PERFORMING ARTS CENTER ENGIN'D BY: NEW LONDON, NEW HAMPSHIRE DRAWN BY: WTD Littleton NH New London NH Newport VT AERIAL PHOTOGRAPH DATE: FEB 2016
57 2.12 Site Photographs

 PHOTO 2 Site looking")
58 COLBY-SAWYER COLLEGE FINE & PERFORMING ARTS CENTER PHOTO 1 Front Building Elevation (12/8/2015) PHOTO 2 Site looking northeast (12/8/2015)
")

59 PHOTO 3 Site looking north (12/8/2015) PHOTO 4 Rear Building Elevation (12/8/2015)

60 PHOTO 5 Site looking east (12/8/2015) PHOTO 6 Building Elevation Windy Hill School Side (12/8/2015)
 PHOTO 8 Site looking south towards NLSWP Pump Station")
61 PHOTO 7 Site looking east toward Micro-Extended Detention Pond location (12/17/2015) PHOTO 8 Site looking south towards NLSWP Pump Station (11/5/2015)
62 2.13 Extreme Precipitation Tables (Northeast Regional Climate Center)
63 Extreme Precipitation Tables: N, W Extreme Precipitation Tables Northeast Regional Climate Center Data represents point estimates calculated from partial duration series. All precipitation amounts are displayed in inches. Smoothing Yes State New Hampshire Location Longitude degrees West Latitude degrees North Elevation 0 feet Date/Time Thu, 10 Dec :56: Extreme Precipitation Estimates 5min 10min 15min 30min 60min 120min 1hr 2hr 3hr 6hr 12hr 24hr 48hr 1day 2day 4day 7day 10day 1yr yr yr yr 2yr yr yr yr 5yr yr yr yr 10yr yr yr yr 25yr yr yr yr 50yr yr yr yr 100yr yr yr yr 200yr yr yr yr 500yr yr yr yr Lower Confidence Limits 5min 10min 15min 30min 60min 120min 1hr 2hr 3hr 6hr 12hr 24hr 48hr 1day 2day 4day 7day 10day 1yr yr yr yr 2yr yr yr yr 5yr yr yr yr 10yr yr yr yr 25yr yr yr yr 50yr yr yr yr 100yr yr yr yr 200yr yr yr yr 500yr yr yr yr Upper Confidence Limits 5min 10min 15min 30min 60min 120min 1hr 2hr 3hr 6hr 12hr 24hr 48hr 1day 2day 4day 7day 10day 1yr yr yr yr 2yr yr yr yr 5yr yr yr yr 10yr yr yr yr 25yr yr yr yr 50yr yr yr yr 100yr yr yr yr 200yr yr yr yr 500yr yr yr yr 3:56:37 PM]
64 SECTION DRAINAGE CALCULATIONS, ANALYSIS & DESIGN
65 3.1 Groundwater Recharge Volume (GRV) Calculations
66 Groundwater Recharge Volume (GRV) Calculation ac Area of HSG A soil that was replaced by impervious cover 0.40" ac Area of HSG B soil that was replaced by impervious cover 0.25" 0.29 ac Area of HSG C soil that was replaced by impervious cover 0.10" ac Area of HSG D soil or impervious cover that was replaced by impervious cover 0.0" 0.10 inches Rd = weighted groundwater recharge depth ac-in GRV = AI * Rd 105 cf GRV conversion (ac-in x 43,560 sf/ac x 1ft/12 ) Provide calculations below showing that the project meets the groundwater recharge requirements (Env- Wq ): Stone Drip Edges provide GRV. NHDES Alteration of Terrain Last Revised: August 2013
67 3.2 BMP Worksheets for all Treatment Systems
68 STORMWATER POND DESIGN CRITERIA (Env-Wq ) Type/Node Name: 2P - Micro-Extended Detention Pond Enter the type of stormwater pond (e.g., Wet Pond) and the node name in the drainage analysis, if applicable 1.36 ac A = Area draining to the practice 0.42 ac A I = Impervious area draining to the practice 0.31 decimal I = percent impervious area draining to the practice, in decimal form 0.33 unitless Rv = Runoff coefficient = (0.9 x I) 0.45 ac-in WQV= 1 x Rv x A 1,619 cf WQV conversion (ac-in x 43,560 sf/ac x 1ft/12 ) 162 cf 10% x WQV (check calc for sediment forebay and micropool volume) 809 cf 50% x WQV (check calc for extended detention volume) 337 cf V SED = sediment forebay volume > 10%WQV 943 cf V PP = permanent pool volume (volume below the lowest invert of the outlet structure) 676 cf V ED = WQV - V PP = extended detention volume < X% 1 WQV 1, E ED = elevation of V ED (attach stage-storage table) 0.02 cfs 2Q avg = 2* V ED / 24 hrs * (1hr / 3600 sec) (used to check against Q EDmax below) 0.02 cfs Q EDmax = discharge at the E ED (attach stage-discharge table) <2Q avg hours T ED = drawdown time of extended detention = 2V ED /Q EDmax > 24-hrs 3.00 :1 Pond side slopes >3: ft Average permanent pool depth 3-6 ft 5.50 ft Maximum depth of permanent pool < 8 ft ft Length of the flow path between the inlet and outlet at mid-depth ft Average Width ([average of the top width + average bottom width]/2) 3.00 :1 Length to Average Width ratio > 3:1 Yes Yes/No The perimeter should be curvilinear. Yes Yes/No The inlet and outlet should be located as far apart as possible. Yes Yes/No Is there a manually-controlled drain provided to dewater the pond over a 24hr period? If no state why: Screen on What mechanism is proposed to prevent the outlet structure from clogging (applicable for End Section orifices/weirs with a dimension of <6 )? 1, ft Peak elevation of the 50-year storm event 1, ft Berm elevation of the pond YES 50 peak elevation < the berm elevation? yes Qualified professional that developed the planting plan: Name, Profession: Will Davis, PE 1. "X" varies depending on type of stormwater pond design. See NH Stormwater Manual, Vol.2, Ch.4-3, Section 1, for the design permanent pool volumes and extended detention volumes. Designer's Notes: NHDES Alteration of Terrain Last Revised: August 2013
69 INFILTRATION PRACTICE DESIGN CRITERIA (Env-Wq ) Type/Node Name: 1P - Roof Stone Drip Edge Enter the type of infiltration practice (e.g., trench) and the node name in the drainage analysis, if applicable Yes Have you reviewed Env-Wq (a) to ensure that infiltration is allowed? 0.05 ac A = Area draining to the practice 0.05 ac A I = Impervious area draining to the practice 1.00 decimal I = percent impervious area draining to the practice, in decimal form 0.95 unitless Rv = Runoff coefficient = (0.9 x I) 0.05 ac-in WQV= 1 x Rv x A 171 cf WQV conversion (ac-in x 43,560 sf/ac x 1ft/12 ) 43 cf Roof Runoff 25% x WQV (check calc for sediment forebay volume) Method of pretreatment? (not required for clean or roof runoff) N/A cf V SED = sediment forebay volume, if used for pretreatment > 25%WQV 226 cf V = volume 1 (attach a stage-storage table) > WQV 285 sf A SA = surface area of the bottom of the pond 4.00 iph I DESIGN = design infiltration rate hours T DRAIN = drain time = V / (A SA * I DESIGN ) < 72-hrs 1, feet E BTM = elevation of the bottom of the practice 1, feet E SHWT = elevation of SHWT (if none found, enter the lowest elevation of the test pit) 1, feet E ROCK = elevation of bedrock (if none found, enter the lowest elevation of the test pit) 3.00 feet D SHWT = separation from SHWT 3 > * feet D ROCK = separation from bedrock 3 > * ft D T = depth of trench, if trench proposed 4-10 ft N/A Yes/No stone N/A If a trench or underground system is proposed, observation well provided If a trench is proposed, material in trench If a basin is proposed, basin floor material N/A Yes/No If a basin is proposed, the perimeter should be curvilinear. N/A :1 If a basin is proposed, pond side slopes >3:1 1, ft Peak elevation of the 10-year storm event (infiltration can be used in analysis) 1, ft Peak elevation of the 50-year storm event (infiltration can be used in analysis) 1, ft Elevation of the top of the practice (if a basin, this is the elevation of the berm) YES 10 peak elevation < Elevation of the top of the trench? yes YES If a basin is proposed, 50-year peak elevation < Elevation of berm? yes 1. Volume below the lowest invert of the outlet structure and excludes forebay volume 2. See NH Stormwater Manual, Vol.2, Ch.2-4, for guidance on determining the infiltration rate 3. 1' separation if treatment not required; 4' for treatment in GPAs & WSIPAs; & 3' in all other areas. Designer's Notes: NHDES Alteration of Terrain Last Revised: August 2013
70 INFILTRATION PRACTICE DESIGN CRITERIA (Env-Wq ) Type/Node Name: 3P - Roof Stone Drip Edge Enter the type of infiltration practice (e.g., trench) and the node name in the drainage analysis, if applicable Yes Have you reviewed Env-Wq (a) to ensure that infiltration is allowed? 0.01 ac A = Area draining to the practice 0.01 ac A I = Impervious area draining to the practice 1.00 decimal I = percent impervious area draining to the practice, in decimal form 0.95 unitless Rv = Runoff coefficient = (0.9 x I) 0.01 ac-in WQV= 1 x Rv x A 45 cf WQV conversion (ac-in x 43,560 sf/ac x 1ft/12 ) 11 cf Roof Runoff 25% x WQV (check calc for sediment forebay volume) Method of pretreatment? (not required for clean or roof runoff) N/A cf V SED = sediment forebay volume, if used for pretreatment > 25%WQV 60 cf V = volume 1 (attach a stage-storage table) > WQV 75 sf A SA = surface area of the bottom of the pond 4.00 iph I DESIGN = design infiltration rate hours T DRAIN = drain time = V / (A SA * I DESIGN ) < 72-hrs 1, feet E BTM = elevation of the bottom of the practice 1, feet E SHWT = elevation of SHWT (if none found, enter the lowest elevation of the test pit) 1, feet E ROCK = elevation of bedrock (if none found, enter the lowest elevation of the test pit) 1.00 feet D SHWT = separation from SHWT 3 > * feet D ROCK = separation from bedrock 3 > * ft D T = depth of trench, if trench proposed 4-10 ft N/A Yes/No stone N/A If a trench or underground system is proposed, observation well provided If a trench is proposed, material in trench If a basin is proposed, basin floor material N/A Yes/No If a basin is proposed, the perimeter should be curvilinear. N/A :1 If a basin is proposed, pond side slopes >3:1 1, ft Peak elevation of the 10-year storm event (infiltration can be used in analysis) 1, ft Peak elevation of the 50-year storm event (infiltration can be used in analysis) 1, ft Elevation of the top of the practice (if a basin, this is the elevation of the berm) YES 10 peak elevation < Elevation of the top of the trench? yes YES If a basin is proposed, 50-year peak elevation < Elevation of berm? yes 1. Volume below the lowest invert of the outlet structure and excludes forebay volume 2. See NH Stormwater Manual, Vol.2, Ch.2-4, for guidance on determining the infiltration rate 3. 1' separation if treatment not required; 4' for treatment in GPAs & WSIPAs; & 3' in all other areas. Designer's Notes: NHDES Alteration of Terrain Last Revised: August 2013
71 15853 Post 02 Type III 24-hr 010-yr Rainfall=3.85" Prepared by Microsoft Printed 2/26/2016 HydroCAD s/n HydroCAD Software Solutions LLC Page 2 Stage-Discharge for Pond 2P: Micro-Extended Detention Pond Elevation (feet) Discharge (cfs) Primary (cfs) Secondary (cfs) 1, , , , , , , , , , , , , , , , , , , , , , , , , , , , , , , , , , , , , , , , , , , , , , , , , , , , Elevation (feet) Discharge (cfs) Primary (cfs) Secondary (cfs) 1, , , , , , , , ,
72 15853 Post 02 Type III 24-hr 010-yr Rainfall=3.85" Prepared by Microsoft Printed 2/26/2016 HydroCAD s/n HydroCAD Software Solutions LLC Page 3 Stage-Area-Storage for Pond 2P: Micro-Extended Detention Pond Elevation (feet) Storage (cubic-feet) 1, , , , , , , , , , , , , , , , , , , , , , , , , , , , , , , , , , , , , , , , , , ,002 1, ,047 1, ,093 1, ,140 1, ,188 1, ,237 1, ,286 1, ,336 1, ,387 1, ,438 1, ,491 Elevation (feet) Storage (cubic-feet) 1, ,545 1, ,601 1, ,659 1, ,718 1, ,779 1, ,841 1, ,905 1, ,970 1, ,037 1, ,106 1, ,176 1, ,242 1, ,303 1, ,365 1, ,429 1, ,494 1, ,560 1, ,627 1, ,696 1, ,767 1, ,838 1, ,911 1, ,985 1, ,061 1, ,137 1, ,215 1, ,294 1, ,374 1, ,455 1, ,537 1, ,620 1, ,704 1, ,789 1, ,876 1, ,963 1, ,051 1, ,141 1, ,232 1, ,323 1, ,416 1, ,510 1, ,605 1, ,701 1, ,798 1, ,896 1, ,996 1, ,096 1, ,197 1, ,300 1, ,404 1, ,508 1, ,614 Elevation (feet) Storage (cubic-feet) 1, ,721 1, ,828 1, ,937 1, ,047 1, ,158 1, ,270 1, ,383 1, ,497 1, ,612 1, ,729 1, ,846 1, ,964 1, ,084 1, ,204 1, ,326 1, ,448 1, ,572 1, ,696 1, ,822 1, ,949 1, ,077 1, ,206 1, ,335 1, ,467 1, ,599 1, ,732 1, ,867 1, ,003 1, ,139 1, ,277 1, ,416 1, ,557 1, ,698 1, ,841 1, ,985 1, ,129 1, ,275 1, ,423 1, ,571 1, ,720 1, ,871 1, ,023 1, ,176 1, ,330 1, ,485 1, ,641 1, ,799
73 15853 Post 02 Type III 24-hr 010-yr Rainfall=3.85" Prepared by Microsoft Printed 2/26/2016 HydroCAD s/n HydroCAD Software Solutions LLC Page 1 Stage-Area-Storage for Pond 1P: Drip Edge Elevation (feet) Surface (acres) Storage (acre-feet) 1, , , , , , , , , , , , , , , , , , , , , , , , , , , , , , , , , , , , , , , , , , , , , , , , , , , , Elevation (feet) Surface (acres) Storage (acre-feet) 1, , , , , , , , , , , , , , , , , , , , , , , , , , , , , , , , , , , , , , , , , , , , , , , , ,
74 15853 Post 02 Type III 24-hr 010-yr Rainfall=3.85" Prepared by Microsoft Printed 2/26/2016 HydroCAD s/n HydroCAD Software Solutions LLC Page 2 Stage-Area-Storage for Pond 3P: Drip Edge Elevation (feet) Surface (acres) Storage (acre-feet) 1, , , , , , , , , , , , , , , , , , , , , , , , , , , , , , , , , , , , , , , , , , , , , , , , , , , , Elevation (feet) Surface (acres) Storage (acre-feet) 1, , , , , , , , , , , , , , , , , , , , , , , , , , , , , , , , , , , , , , , , , , , , , , , , ,
75 3.3 Pre-Development Analysis
76 3.3 Pre-development Analysis The pre-development analysis included three subcatchment areas labeled Pr1 through Pr3 throughout this report, on the watershed plans, and in the HydroCAD report. Pr1 includes a portion of the Colby Farm roof, gravel/concrete driveway, patios, and lawn areas around the building. The discharge point for Pr1 is an existing stone detention area on campus, Dp1. Pr2 encompasses the remainder of the Colby Farm roof, patio, and lawn area that discharges into a section of open meadow on campus, Dp2. Pr3 is a small strip along the south side of the watershed area that includes gravel access road and a grassed swale that discharges into a section of open meadow on campus, Dp2. A site specific soils survey within the work area was completed by Jonathan Sisson, Certified Wetland Scientist, Certified Soil Scientist of Beavertracks, LLC, in accordance with Env-Wq (b) (2) in January of This information can be found in Section 3.6 of this report. The watershed areas and drainage paths can be found in Section 4.
77 3.3.1 Node Listing for the 2, 10 and 50 Storm Events
78 Pr1 Dp1 Pr1 Discharge Point #1 Pr2 Dp2 Pr2 Discharge Point #2 Pr3 1P CB 1R Pr3 Ex 10" Culvert Meadow Subcat Reach Pond Link Routing Diagram for Pre 02 Prepared by Microsoft, Printed 2/26/2016 HydroCAD s/n HydroCAD Software Solutions LLC
79 15853 Pre 02 Prepared by Microsoft HydroCAD s/n HydroCAD Software Solutions LLC Printed 2/26/2016 Page 2 Area (sq-ft) CN Area Listing (all nodes) Description (subcatchment-numbers) 70, >75% Grass cover, Good, HSG C (Pr1, Pr2, Pr3) 7, Gravel surface, HSG C (Pr1, Pr3) 1, Paved parking, HSG C (Pr1) 5, Roofs, HSG C (Pr1, Pr2) 83, TOTAL AREA
80 15853 Pre 02 Prepared by Microsoft HydroCAD s/n HydroCAD Software Solutions LLC Printed 2/26/2016 Page 3 Area (sq-ft) Soil Group Subcatchment Numbers 0 HSG A 0 HSG B 83,583 HSG C Pr1, Pr2, Pr3 0 HSG D 0 Other 83,583 TOTAL AREA Soil Listing (all nodes)
81 15853 Pre 02 Type III 24-hr 002-yr Rainfall=2.64" Prepared by Microsoft Printed 2/26/2016 HydroCAD s/n HydroCAD Software Solutions LLC Page 4 Time span= hrs, dt=0.05 hrs, 301 points Runoff by SCS TR-20 method, UH=SCS, Weighted-CN Reach routing by Stor-Ind+Trans method - Pond routing by Stor-Ind method Subcatchment Pr1: Pr1 Subcatchment Pr2: Pr2 Subcatchment Pr3: Pr3 Reach 1R: Meadow Pond 1P: Ex 10" Culvert Runoff Area=28,517 sf 19.15% Impervious Runoff Depth>1.02" Flow Length=196' Slope= '/' Tc=6.4 min CN=82 Runoff=0.81 cfs 2,414 cf Runoff Area=44,941 sf 2.07% Impervious Runoff Depth>0.62" Flow Length=448' Tc=13.9 min CN=74 Runoff=0.57 cfs 2,320 cf Runoff Area=10,125 sf 0.00% Impervious Runoff Depth>0.85" Flow Length=260' Tc=8.8 min CN=79 Runoff=0.22 cfs 719 cf Avg. Flow Depth=0.12' Max Vel=0.27 fps Inflow=0.22 cfs 719 cf n=0.240 L=185.0' S= '/' Capacity=14.58 cfs Outflow=0.16 cfs 705 cf Peak Elev=1,348.71' Inflow=0.22 cfs 719 cf 10.0" Round Culvert n=0.012 L=90.0' S= '/' Outflow=0.22 cfs 719 cf Link Dp1: Discharge Point #1 Link Dp2: Discharge Point #2 Inflow=0.81 cfs 2,414 cf Primary=0.81 cfs 2,414 cf Inflow=0.63 cfs 3,025 cf Primary=0.63 cfs 3,025 cf Total Runoff Area = 83,583 sf Runoff Volume = 5,453 cf Average Runoff Depth = 0.78" 92.35% Pervious = 77,193 sf 7.65% Impervious = 6,390 sf
82 15853 Pre 02 Type III 24-hr 010-yr Rainfall=3.85" Prepared by Microsoft Printed 2/26/2016 HydroCAD s/n HydroCAD Software Solutions LLC Page 5 Time span= hrs, dt=0.05 hrs, 301 points Runoff by SCS TR-20 method, UH=SCS, Weighted-CN Reach routing by Stor-Ind+Trans method - Pond routing by Stor-Ind method Subcatchment Pr1: Pr1 Subcatchment Pr2: Pr2 Subcatchment Pr3: Pr3 Reach 1R: Meadow Pond 1P: Ex 10" Culvert Runoff Area=28,517 sf 19.15% Impervious Runoff Depth>1.93" Flow Length=196' Slope= '/' Tc=6.4 min CN=82 Runoff=1.55 cfs 4,593 cf Runoff Area=44,941 sf 2.07% Impervious Runoff Depth>1.36" Flow Length=448' Tc=13.9 min CN=74 Runoff=1.35 cfs 5,101 cf Runoff Area=10,125 sf 0.00% Impervious Runoff Depth>1.71" Flow Length=260' Tc=8.8 min CN=79 Runoff=0.44 cfs 1,440 cf Avg. Flow Depth=0.18' Max Vel=0.35 fps Inflow=0.44 cfs 1,440 cf n=0.240 L=185.0' S= '/' Capacity=14.58 cfs Outflow=0.35 cfs 1,419 cf Peak Elev=1,348.84' Inflow=0.44 cfs 1,440 cf 10.0" Round Culvert n=0.012 L=90.0' S= '/' Outflow=0.44 cfs 1,440 cf Link Dp1: Discharge Point #1 Link Dp2: Discharge Point #2 Inflow=1.55 cfs 4,593 cf Primary=1.55 cfs 4,593 cf Inflow=1.54 cfs 6,520 cf Primary=1.54 cfs 6,520 cf Total Runoff Area = 83,583 sf Runoff Volume = 11,134 cf Average Runoff Depth = 1.60" 92.35% Pervious = 77,193 sf 7.65% Impervious = 6,390 sf
83 15853 Pre 02 Type III 24-hr 050-yr Rainfall=5.61" Prepared by Microsoft Printed 2/26/2016 HydroCAD s/n HydroCAD Software Solutions LLC Page 6 Time span= hrs, dt=0.05 hrs, 301 points Runoff by SCS TR-20 method, UH=SCS, Weighted-CN Reach routing by Stor-Ind+Trans method - Pond routing by Stor-Ind method Subcatchment Pr1: Pr1 Subcatchment Pr2: Pr2 Subcatchment Pr3: Pr3 Reach 1R: Meadow Pond 1P: Ex 10" Culvert Runoff Area=28,517 sf 19.15% Impervious Runoff Depth>3.41" Flow Length=196' Slope= '/' Tc=6.4 min CN=82 Runoff=2.68 cfs 8,094 cf Runoff Area=44,941 sf 2.07% Impervious Runoff Depth>2.65" Flow Length=448' Tc=13.9 min CN=74 Runoff=2.67 cfs 9,926 cf Runoff Area=10,125 sf 0.00% Impervious Runoff Depth>3.11" Flow Length=260' Tc=8.8 min CN=79 Runoff=0.81 cfs 2,628 cf Avg. Flow Depth=0.24' Max Vel=0.43 fps Inflow=0.81 cfs 2,628 cf n=0.240 L=185.0' S= '/' Capacity=14.58 cfs Outflow=0.66 cfs 2,600 cf Peak Elev=1,349.01' Inflow=0.81 cfs 2,628 cf 10.0" Round Culvert n=0.012 L=90.0' S= '/' Outflow=0.81 cfs 2,628 cf Link Dp1: Discharge Point #1 Link Dp2: Discharge Point #2 Inflow=2.68 cfs 8,094 cf Primary=2.68 cfs 8,094 cf Inflow=3.14 cfs 12,525 cf Primary=3.14 cfs 12,525 cf Total Runoff Area = 83,583 sf Runoff Volume = 20,648 cf Average Runoff Depth = 2.96" 92.35% Pervious = 77,193 sf 7.65% Impervious = 6,390 sf
84 3.3.2 Full Summary and Diagram for the 10 year Storm Event
85 15853 Pre 02 Type III 24-hr 010-yr Rainfall=3.85" Prepared by Microsoft Printed 2/26/2016 HydroCAD s/n HydroCAD Software Solutions LLC Page 1 Summary for Subcatchment Pr1: Pr1 Runoff = hrs, Volume= 4,593 cf, Depth> 1.93" Runoff by SCS TR-20 method, UH=SCS, Weighted-CN, Time Span= hrs, dt= 0.05 hrs Type III 24-hr 010-yr Rainfall=3.85" Area (sf) CN Description 4, Roofs, HSG C 4, Gravel surface, HSG C 1, Paved parking, HSG C 18, >75% Grass cover, Good, HSG C 28, Weighted Average 23, % Pervious Area 5, % Impervious Area Tc Length Slope Velocity Capacity Description (min) (feet) (ft/ft) (ft/sec) (cfs) Sheet Flow, Grass: Short n= P2= 2.64" Sheet Flow, Smooth surfaces n= P2= 2.64" Sheet Flow, Grass: Short n= P2= 2.64" Trap/Vee/Rect Channel Flow, Bot.W=0.00' D=0.50' Z= 4.0 '/' Top.W=4.00' n= Total
86 15853 Pre 02 Type III 24-hr 010-yr Rainfall=3.85" Prepared by Microsoft Printed 2/26/2016 HydroCAD s/n HydroCAD Software Solutions LLC Page 2 Subcatchment Pr1: Pr1 Hydrograph 1.55 cfs Runoff Flow (cfs) 1 Type III 24-hr 010-yr Rainfall=3.85" Runoff Area=28,517 sf Runoff Volume=4,593 cf Runoff Depth>1.93" Flow Length=196' Slope= '/' Tc=6.4 min CN= Time (hours)
87 15853 Pre 02 Type III 24-hr 010-yr Rainfall=3.85" Prepared by Microsoft Printed 2/26/2016 HydroCAD s/n HydroCAD Software Solutions LLC Page 3 Summary for Subcatchment Pr2: Pr2 Runoff = hrs, Volume= 5,101 cf, Depth> 1.36" Runoff by SCS TR-20 method, UH=SCS, Weighted-CN, Time Span= hrs, dt= 0.05 hrs Type III 24-hr 010-yr Rainfall=3.85" Area (sf) CN Description Roofs, HSG C 44, >75% Grass cover, Good, HSG C 44, Weighted Average 44, % Pervious Area % Impervious Area Tc Length Slope Velocity Capacity Description (min) (feet) (ft/ft) (ft/sec) (cfs) Sheet Flow, Grass: Short n= P2= 2.64" Shallow Concentrated Flow, Short Grass Pasture Kv= 7.0 fps Total Subcatchment Pr2: Pr2 Hydrograph 1.35 cfs Runoff Flow (cfs) 1 Type III 24-hr 010-yr Rainfall=3.85" Runoff Area=44,941 sf Runoff Volume=5,101 cf Runoff Depth>1.36" Flow Length=448' Tc=13.9 min CN= Time (hours)
88 15853 Pre 02 Type III 24-hr 010-yr Rainfall=3.85" Prepared by Microsoft Printed 2/26/2016 HydroCAD s/n HydroCAD Software Solutions LLC Page 4 Summary for Subcatchment Pr3: Pr3 Runoff = hrs, Volume= 1,440 cf, Depth> 1.71" Runoff by SCS TR-20 method, UH=SCS, Weighted-CN, Time Span= hrs, dt= 0.05 hrs Type III 24-hr 010-yr Rainfall=3.85" Area (sf) CN Description 2, Gravel surface, HSG C 7, >75% Grass cover, Good, HSG C 10, Weighted Average 10, % Pervious Area Tc Length Slope Velocity Capacity Description (min) (feet) (ft/ft) (ft/sec) (cfs) Sheet Flow, Grass: Short n= P2= 2.64" Trap/Vee/Rect Channel Flow, Bot.W=0.00' D=0.50' Z= 4.0 '/' Top.W=4.00' n= Earth, grassed & winding Total Subcatchment Pr3: Pr3 Hydrograph Flow (cfs) cfs Type III 24-hr 010-yr Rainfall=3.85" Runoff Area=10,125 sf Runoff Volume=1,440 cf Runoff Depth>1.71" Flow Length=260' Tc=8.8 min CN=79 Runoff Time (hours)
89 15853 Pre 02 Type III 24-hr 010-yr Rainfall=3.85" Prepared by Microsoft Printed 2/26/2016 HydroCAD s/n HydroCAD Software Solutions LLC Page 5 Summary for Reach 1R: Meadow Inflow Area = 10,125 sf, 0.00% Impervious, Inflow Depth > 1.71" for 010-yr event Inflow = hrs, Volume= 1,440 cf Outflow = hrs, Volume= 1,419 cf, Atten= 21%, Lag= 14.2 min Routing by Stor-Ind+Trans method, Time Span= hrs, dt= 0.05 hrs Max. Velocity= 0.35 fps, Min. Travel Time= 8.9 min Avg. Velocity = 0.15 fps, Avg. Travel Time= 20.9 min Peak Storage= hrs Average Depth at Peak Storage= 0.18' Bank-Full Depth= 1.00' Flow Area= 13.3 sf, Capacity= cfs 20.00' x 1.00' deep Parabolic Channel, n= Sheet flow over Dense Grass Length= 185.0' Slope= '/' Inlet Invert= 1,347.00', Outlet Invert= 1,337.00' Reach 1R: Meadow Hydrograph Flow (cfs) cfs Inflow Area=10,125 sf 0.35 cfsavg. Flow Depth=0.18' Max Vel=0.35 fps n=0.240 L=185.0' S= '/' Capacity=14.58 cfs Inflow Outflow Time (hours)
90 15853 Pre 02 Type III 24-hr 010-yr Rainfall=3.85" Prepared by Microsoft Printed 2/26/2016 HydroCAD s/n HydroCAD Software Solutions LLC Page 6 Summary for Pond 1P: Ex 10" Culvert Inflow Area = 10,125 sf, 0.00% Impervious, Inflow Depth > 1.71" for 010-yr event Inflow = hrs, Volume= 1,440 cf Outflow = hrs, Volume= 1,440 cf, Atten= 0%, Lag= 0.0 min Primary = hrs, Volume= 1,440 cf Routing by Stor-Ind method, Time Span= hrs, dt= 0.05 hrs Peak Elev= hrs Device Routing Invert Outlet Devices #1 Primary 1,348.44' 10.0" Round Culvert L= 90.0' CPP, projecting, no headwall, Ke= Inlet / Outlet Invert= 1,348.44' / 1,347.54' S= '/' Cc= n= Steel, smooth, Flow Area= 0.55 sf Primary OutFlow Max= hrs HW=1,348.84' (Free Discharge) 1=Culvert (Inlet Controls fps) Pond 1P: Ex 10" Culvert Hydrograph Flow (cfs) cfs Inflow Area=10,125 sf Peak Elev=1,348.84' 10.0" Round Culvert n=0.012 L=90.0' S= '/' Inflow Primary Time (hours)
91 15853 Pre 02 Type III 24-hr 010-yr Rainfall=3.85" Prepared by Microsoft Printed 2/26/2016 HydroCAD s/n HydroCAD Software Solutions LLC Page 7 Summary for Link Dp1: Discharge Point #1 Inflow Area = 28,517 sf, 19.15% Impervious, Inflow Depth > 1.93" for 010-yr event Inflow = hrs, Volume= 4,593 cf Primary = hrs, Volume= 4,593 cf, Atten= 0%, Lag= 0.0 min Primary outflow = Inflow, Time Span= hrs, dt= 0.05 hrs Link Dp1: Discharge Point #1 Hydrograph 1.55 cfs Inflow Area=28,517 sf Inflow Primary Flow (cfs) Time (hours)
92 15853 Pre 02 Type III 24-hr 010-yr Rainfall=3.85" Prepared by Microsoft Printed 2/26/2016 HydroCAD s/n HydroCAD Software Solutions LLC Page 8 Summary for Link Dp2: Discharge Point #2 Inflow Area = 55,066 sf, 1.69% Impervious, Inflow Depth > 1.42" for 010-yr event Inflow = hrs, Volume= 6,520 cf Primary = hrs, Volume= 6,520 cf, Atten= 0%, Lag= 0.0 min Primary outflow = Inflow, Time Span= hrs, dt= 0.05 hrs Link Dp2: Discharge Point #2 Hydrograph 1.54 cfs Inflow Area=55,066 sf Inflow Primary Flow (cfs) Time (hours)
93 3.4 Post-Development Analysis
94 3.4 Post-Development Analysis The post-development analysis includes subcatchment areas numbered Po1a, Po1b, Po2a, Po2b, and Po3. Subcatchment Po1a includes walkways and proposed lawn area. Stormwater is routed using curb and a small catch basin system to an existing stone trench with a perforated pipe that flows to an existing detention area on campus, Dp1. A portion of the adjacent parking lot will be conveyed to the same stone trench as it is in the pre-development condition. Po1b and Po2b each include a portion of the sloped roof which is directed to an infiltrating stone drip edge (1P and 3P). The drip edges have been designed to hold and infiltrate greater than the WQV and GRV in the stone voids. Po2a includes all of the low-sloped roof and canopy roof for the building. These sections of roof will be collected using roof drains and will be conveyed inside the building to a single drainage pipe. The drainage pipe will discharge into a grass lined swale and then to Micro-Extended Detention Pond (2P). Po2a also includes the majority of the proposed lawn area for the site and the rear patio which will be conveyed by sheet flow and grass lined swale to Micro-Extended Detention Pond (2P). Micro-Extended Detention Pond (2P) discharges to Dp2. Po3 is a small strip along the south side of the watershed area that includes gravel access road, a small section of proposed walkway, and a grassed swale that discharges into a section of open meadow on campus, Dp2. For more detailed information on the post-developed area, see attached drainage plans found in Section 4 and the HydroCAD area listing found in Section A pre- versus post- development comparison flow rate table for the 2, 10, and 50 year storm events can be found in Table 2.0 in Section
95 3.4.1 Post-Development 2, 10, and 50 - Year Storm
96 Po1a Po1a Po1b 1P 4P Dp1 Po1b Drip Edge NB1 Discharge Point #1 Po2a 2P Po2a 3P Micro-Extended Detention Pond Po2b Drip Edge Dp2 Po2b Discharge Point #2 Po3 5P CB 1R Po3 Ex 10" Culvert Meadow Subcat Reach Pond Link Routing Diagram for Post 02 Prepared by Microsoft, Printed 2/26/2016 HydroCAD s/n HydroCAD Software Solutions LLC
97 15853 Post 02 Prepared by Microsoft HydroCAD s/n HydroCAD Software Solutions LLC Printed 2/26/2016 Page 2 Area (sq-ft) CN Area Listing (all nodes) Description (subcatchment-numbers) 57, >75% Grass cover, Good, HSG C (Po1a, Po2a, Po3) 17, Roofs, HSG C (Po1b, Po2a, Po2b) 8, Walkways, HSG C (Po1a, Po2a, Po3) 83, TOTAL AREA
98 15853 Post 02 Prepared by Microsoft HydroCAD s/n HydroCAD Software Solutions LLC Printed 2/26/2016 Page 3 Area (sq-ft) Soil Group Subcatchment Numbers Soil Listing (all nodes) 0 HSG A 0 HSG B 83,583 HSG C Po1a, Po1b, Po2a, Po2b, Po3 0 HSG D 0 Other 83,583 TOTAL AREA
99 15853 Post 02 Type III 24-hr 002-yr Rainfall=2.64" Prepared by Microsoft Printed 2/26/2016 HydroCAD s/n HydroCAD Software Solutions LLC Page 4 Time span= hrs, dt=0.04 hrs, 739 points Runoff by SCS TR-20 method, UH=SCS, Weighted-CN Reach routing by Stor-Ind+Trans method - Pond routing by Stor-Ind method Subcatchment Po1a: Po1a Runoff Area=11,375 sf 24.38% Impervious Runoff Depth=0.99" Flow Length=100' Slope= '/' Tc=6.2 min CN=80 Runoff=0.289 cfs 936 cf Subcatchment Po1b: Po1b Subcatchment Po2a: Po2a Subcatchment Po2b: Po2b Subcatchment Po3: Po3 Reach 1R: Meadow Pond 1P: Drip Edge Runoff Area=2,162 sf % Impervious Runoff Depth=2.41" Tc=5.0 min CN=98 Runoff=0.129 cfs 434 cf Runoff Area=59,349 sf 30.51% Impervious Runoff Depth=1.04" Flow Length=541' Tc=15.5 min CN=81 Runoff=1.209 cfs 5,160 cf Runoff Area=572 sf % Impervious Runoff Depth=2.41" Tc=5.0 min CN=98 Runoff=0.034 cfs 115 cf Runoff Area=10,125 sf 24.46% Impervious Runoff Depth=0.99" Flow Length=260' Tc=9.2 min CN=80 Runoff=0.232 cfs 833 cf Avg. Flow Depth=0.13' Max Vel=0.28 fps Inflow=0.232 cfs 833 cf n=0.240 L=185.0' S= '/' Capacity= cfs Outflow=0.168 cfs 833 cf Peak Elev=1,361.86' Storage=0.002 af Inflow=0.129 cfs 434 cf Discarded=0.026 cfs 434 cf Primary=0.000 cfs 0 cf Outflow=0.026 cfs 434 cf Pond 2P: Micro-Extended Detention Pond Peak Elev=1,335.55' Storage=4,203 cf Inflow=1.209 cfs 5,160 cf Primary=0.022 cfs 1,416 cf Secondary=0.000 cfs 0 cf Outflow=0.022 cfs 1,416 cf Pond 3P: Drip Edge Pond 4P: NB1 Pond 5P: Ex 10" Culvert Link Dp1: Discharge Point #1 Link Dp2: Discharge Point #2 Peak Elev=1,361.87' Storage=0.001 af Inflow=0.034 cfs 115 cf Discarded=0.007 cfs 115 cf Primary=0.000 cfs 0 cf Outflow=0.007 cfs 115 cf Peak Elev=1,357.60' Storage=0 cf Inflow=0.000 cfs 0 cf 6.0" Round Culvert n=0.010 L=45.0' S= '/' Outflow=0.000 cfs 0 cf Peak Elev=1,348.72' Inflow=0.232 cfs 833 cf 10.0" Round Culvert n=0.012 L=90.0' S= '/' Outflow=0.232 cfs 833 cf Inflow=0.289 cfs 936 cf Primary=0.289 cfs 936 cf Inflow=0.185 cfs 2,248 cf Primary=0.185 cfs 2,248 cf Total Runoff Area = 83,583 sf Runoff Volume = 7,478 cf Average Runoff Depth = 1.07" 68.78% Pervious = 57,490 sf 31.22% Impervious = 26,093 sf
100 15853 Post 02 Type III 24-hr 010-yr Rainfall=3.85" Prepared by Microsoft Printed 2/26/2016 HydroCAD s/n HydroCAD Software Solutions LLC Page 5 Time span= hrs, dt=0.04 hrs, 739 points Runoff by SCS TR-20 method, UH=SCS, Weighted-CN Reach routing by Stor-Ind+Trans method - Pond routing by Stor-Ind method Subcatchment Po1a: Po1a Runoff Area=11,375 sf 24.38% Impervious Runoff Depth=1.92" Flow Length=100' Slope= '/' Tc=6.2 min CN=80 Runoff=0.576 cfs 1,818 cf Subcatchment Po1b: Po1b Subcatchment Po2a: Po2a Subcatchment Po2b: Po2b Subcatchment Po3: Po3 Reach 1R: Meadow Pond 1P: Drip Edge Runoff Area=2,162 sf % Impervious Runoff Depth=3.62" Tc=5.0 min CN=98 Runoff=0.191 cfs 651 cf Runoff Area=59,349 sf 30.51% Impervious Runoff Depth=2.00" Flow Length=541' Tc=15.5 min CN=81 Runoff=2.370 cfs 9,872 cf Runoff Area=572 sf % Impervious Runoff Depth=3.62" Tc=5.0 min CN=98 Runoff=0.050 cfs 172 cf Runoff Area=10,125 sf 24.46% Impervious Runoff Depth=1.92" Flow Length=260' Tc=9.2 min CN=80 Runoff=0.464 cfs 1,619 cf Avg. Flow Depth=0.18' Max Vel=0.35 fps Inflow=0.464 cfs 1,619 cf n=0.240 L=185.0' S= '/' Capacity= cfs Outflow=0.363 cfs 1,619 cf Peak Elev=1,362.61' Storage=0.004 af Inflow=0.191 cfs 651 cf Discarded=0.026 cfs 651 cf Primary=0.000 cfs 0 cf Outflow=0.026 cfs 651 cf Pond 2P: Micro-Extended Detention Pond Peak Elev=1,336.58' Storage=6,898 cf Inflow=2.370 cfs 9,872 cf Primary=0.026 cfs 1,716 cf Secondary=0.149 cfs 1,857 cf Outflow=0.175 cfs 3,574 cf Pond 3P: Drip Edge Pond 4P: NB1 Pond 5P: Ex 10" Culvert Link Dp1: Discharge Point #1 Link Dp2: Discharge Point #2 Peak Elev=1,362.63' Storage=0.001 af Inflow=0.050 cfs 172 cf Discarded=0.007 cfs 172 cf Primary=0.000 cfs 0 cf Outflow=0.007 cfs 172 cf Peak Elev=1,357.60' Storage=0 cf Inflow=0.000 cfs 0 cf 6.0" Round Culvert n=0.010 L=45.0' S= '/' Outflow=0.000 cfs 0 cf Peak Elev=1,348.85' Inflow=0.464 cfs 1,619 cf 10.0" Round Culvert n=0.012 L=90.0' S= '/' Outflow=0.464 cfs 1,619 cf Inflow=0.576 cfs 1,818 cf Primary=0.576 cfs 1,818 cf Inflow=0.385 cfs 5,192 cf Primary=0.385 cfs 5,192 cf Total Runoff Area = 83,583 sf Runoff Volume = 14,133 cf Average Runoff Depth = 2.03" 68.78% Pervious = 57,490 sf 31.22% Impervious = 26,093 sf
101 15853 Post 02 Type III 24-hr 050-yr Rainfall=5.61" Prepared by Microsoft Printed 2/26/2016 HydroCAD s/n HydroCAD Software Solutions LLC Page 6 Time span= hrs, dt=0.04 hrs, 739 points Runoff by SCS TR-20 method, UH=SCS, Weighted-CN Reach routing by Stor-Ind+Trans method - Pond routing by Stor-Ind method Subcatchment Po1a: Po1a Runoff Area=11,375 sf 24.38% Impervious Runoff Depth=3.43" Flow Length=100' Slope= '/' Tc=6.2 min CN=80 Runoff=1.028 cfs 3,253 cf Subcatchment Po1b: Po1b Subcatchment Po2a: Po2a Subcatchment Po2b: Po2b Subcatchment Po3: Po3 Reach 1R: Meadow Pond 1P: Drip Edge Runoff Area=2,162 sf % Impervious Runoff Depth=5.37" Tc=5.0 min CN=98 Runoff=0.279 cfs 968 cf Runoff Area=59,349 sf 30.51% Impervious Runoff Depth=3.53" Flow Length=541' Tc=15.5 min CN=81 Runoff=4.189 cfs 17,459 cf Runoff Area=572 sf % Impervious Runoff Depth=5.37" Tc=5.0 min CN=98 Runoff=0.074 cfs 256 cf Runoff Area=10,125 sf 24.46% Impervious Runoff Depth=3.43" Flow Length=260' Tc=9.2 min CN=80 Runoff=0.829 cfs 2,895 cf Avg. Flow Depth=0.24' Max Vel=0.43 fps Inflow=0.829 cfs 2,895 cf n=0.240 L=185.0' S= '/' Capacity= cfs Outflow=0.689 cfs 2,895 cf Peak Elev=1,362.90' Storage=0.005 af Inflow=0.279 cfs 968 cf Discarded=0.026 cfs 865 cf Primary=0.137 cfs 97 cf Outflow=0.164 cfs 962 cf Pond 2P: Micro-Extended Detention Peak Elev=1,336.76' Storage=7,462 cf Inflow=4.205 cfs 17,471 cf Primary=0.026 cfs 1,811 cf Secondary=2.457 cfs 9,351 cf Outflow=2.484 cfs 11,162 cf Pond 3P: Drip Edge Pond 4P: NB1 Pond 5P: Ex 10" Culvert Peak Elev=1,362.90' Storage=0.001 af Inflow=0.074 cfs 256 cf Discarded=0.007 cfs 228 cf Primary=0.021 cfs 12 cf Outflow=0.028 cfs 240 cf Peak Elev=1,357.83' Storage=0 cf Inflow=0.137 cfs 97 cf 6.0" Round Culvert n=0.010 L=45.0' S= '/' Outflow=0.134 cfs 97 cf Peak Elev=1,349.02' Inflow=0.829 cfs 2,895 cf 10.0" Round Culvert n=0.012 L=90.0' S= '/' Outflow=0.829 cfs 2,895 cf Link Dp1: Discharge Point #1 Link Dp2: Discharge Point #2 Inflow=1.028 cfs 3,350 cf Primary=1.028 cfs 3,350 cf Inflow=3.033 cfs 14,057 cf Primary=3.033 cfs 14,057 cf Total Runoff Area = 83,583 sf Runoff Volume = 24,831 cf Average Runoff Depth = 3.56" 68.78% Pervious = 57,490 sf 31.22% Impervious = 26,093 sf
102 3.4.2 Post-Development Full Summary Diagram 10 - Year Storm Event
103 15853 Post 02 Type III 24-hr 010-yr Rainfall=3.85" Prepared by Microsoft Printed 2/26/2016 HydroCAD s/n HydroCAD Software Solutions LLC Page 1 Summary for Subcatchment Po1a: Po1a Runoff = hrs, Volume= 1,818 cf, Depth= 1.92" Runoff by SCS TR-20 method, UH=SCS, Weighted-CN, Time Span= hrs, dt= 0.04 hrs Type III 24-hr 010-yr Rainfall=3.85" Area (sf) CN Description * 2, Walkways, HSG C 8, >75% Grass cover, Good, HSG C 11, Weighted Average 8, % Pervious Area 2, % Impervious Area Tc Length Slope Velocity Capacity Description (min) (feet) (ft/ft) (ft/sec) (cfs) Sheet Flow, Grass: Short n= P2= 2.64" Subcatchment Po1a: Po1a Hydrograph Flow (cfs) cfs Time (hours) Type III 24-hr 010-yr Rainfall=3.85" Runoff Area=11,375 sf Runoff Volume=1,818 cf Runoff Depth=1.92" Flow Length=100' Slope= '/' Tc=6.2 min CN= Runoff
104 15853 Post 02 Type III 24-hr 010-yr Rainfall=3.85" Prepared by Microsoft Printed 2/26/2016 HydroCAD s/n HydroCAD Software Solutions LLC Page 2 Summary for Subcatchment Po1b: Po1b Runoff = hrs, Volume= 651 cf, Depth= 3.62" Runoff by SCS TR-20 method, UH=SCS, Weighted-CN, Time Span= hrs, dt= 0.04 hrs Type III 24-hr 010-yr Rainfall=3.85" Area (sf) CN Description 2, Roofs, HSG C 2, % Impervious Area Tc Length Slope Velocity Capacity Description (min) (feet) (ft/ft) (ft/sec) (cfs) 5.0 Direct Entry, Subcatchment Po1b: Po1b Hydrograph cfs Runoff Flow (cfs) Time (hours) Type III 24-hr 010-yr Rainfall=3.85" Runoff Area=2,162 sf Runoff Volume=651 cf Runoff Depth=3.62" Tc=5.0 min CN=
105 15853 Post 02 Type III 24-hr 010-yr Rainfall=3.85" Prepared by Microsoft Printed 2/26/2016 HydroCAD s/n HydroCAD Software Solutions LLC Page 3 Summary for Subcatchment Po2a: Po2a Runoff = hrs, Volume= 9,872 cf, Depth= 2.00" Runoff by SCS TR-20 method, UH=SCS, Weighted-CN, Time Span= hrs, dt= 0.04 hrs Type III 24-hr 010-yr Rainfall=3.85" Area (sf) CN Description 14, Roofs, HSG C * 3, Walkways, HSG C 41, >75% Grass cover, Good, HSG C 59, Weighted Average 41, % Pervious Area 18, % Impervious Area Tc Length Slope Velocity Capacity Description (min) (feet) (ft/ft) (ft/sec) (cfs) Sheet Flow, Grass: Short n= P2= 2.64" Shallow Concentrated Flow, Grassed Waterway Kv= 15.0 fps Trap/Vee/Rect Channel Flow, Bot.W=2.00' D=2.00' Z= 2.0 '/' Top.W=10.00' n= Earth, grassed & winding Total Subcatchment Po2a: Po2a Hydrograph cfs Runoff Flow (cfs) 2 1 Type III 24-hr 010-yr Rainfall=3.85" Runoff Area=59,349 sf Runoff Volume=9,872 cf Runoff Depth=2.00" Flow Length=541' Tc=15.5 min CN= Time (hours)
106 15853 Post 02 Type III 24-hr 010-yr Rainfall=3.85" Prepared by Microsoft Printed 2/26/2016 HydroCAD s/n HydroCAD Software Solutions LLC Page 4 Summary for Subcatchment Po2b: Po2b Runoff = hrs, Volume= 172 cf, Depth= 3.62" Runoff by SCS TR-20 method, UH=SCS, Weighted-CN, Time Span= hrs, dt= 0.04 hrs Type III 24-hr 010-yr Rainfall=3.85" Area (sf) CN Description Roofs, HSG C % Impervious Area Tc Length Slope Velocity Capacity Description (min) (feet) (ft/ft) (ft/sec) (cfs) 5.0 Direct Entry, Subcatchment Po2b: Po2b Flow (cfs) Hydrograph cfs Time (hours) Type III 24-hr 010-yr Rainfall=3.85" Runoff Area=572 sf Runoff Volume=172 cf Runoff Depth=3.62" Tc=5.0 min CN= Runoff
107 15853 Post 02 Type III 24-hr 010-yr Rainfall=3.85" Prepared by Microsoft Printed 2/26/2016 HydroCAD s/n HydroCAD Software Solutions LLC Page 5 Summary for Subcatchment Po3: Po3 Runoff = hrs, Volume= 1,619 cf, Depth= 1.92" Runoff by SCS TR-20 method, UH=SCS, Weighted-CN, Time Span= hrs, dt= 0.04 hrs Type III 24-hr 010-yr Rainfall=3.85" Area (sf) CN Description * 2, Walkways, HSG C 7, >75% Grass cover, Good, HSG C 10, Weighted Average 7, % Pervious Area 2, % Impervious Area Tc Length Slope Velocity Capacity Description (min) (feet) (ft/ft) (ft/sec) (cfs) Sheet Flow, Grass: Short n= P2= 2.64" Sheet Flow, Smooth surfaces n= P2= 2.64" Sheet Flow, Grass: Short n= P2= 2.64" Trap/Vee/Rect Channel Flow, Bot.W=0.00' D=0.50' Z= 4.0 '/' Top.W=4.00' n= Earth, grassed & winding Total Subcatchment Po3: Po3 Hydrograph Flow (cfs) cfs Type III 24-hr 010-yr Rainfall=3.85" Runoff Area=10,125 sf Runoff Volume=1,619 cf Runoff Depth=1.92" Flow Length=260' Tc=9.2 min CN=80 Runoff Time (hours)
108 15853 Post 02 Type III 24-hr 010-yr Rainfall=3.85" Prepared by Microsoft Printed 2/26/2016 HydroCAD s/n HydroCAD Software Solutions LLC Page 6 Summary for Reach 1R: Meadow Inflow Area = 10,125 sf, 24.46% Impervious, Inflow Depth = 1.92" for 010-yr event Inflow = hrs, Volume= 1,619 cf Outflow = hrs, Volume= 1,619 cf, Atten= 22%, Lag= 14.1 min Routing by Stor-Ind+Trans method, Time Span= hrs, dt= 0.04 hrs Max. Velocity= 0.35 fps, Min. Travel Time= 8.7 min Avg. Velocity = 0.12 fps, Avg. Travel Time= 26.8 min Peak Storage= hrs Average Depth at Peak Storage= 0.18' Bank-Full Depth= 1.00' Flow Area= 13.3 sf, Capacity= cfs 20.00' x 1.00' deep Parabolic Channel, n= Sheet flow over Dense Grass Length= 185.0' Slope= '/' Inlet Invert= 1,347.00', Outlet Invert= 1,337.00' Reach 1R: Meadow Hydrograph Flow (cfs) cfs cfs Inflow Area=10,125 sf Avg. Flow Depth=0.18' Max Vel=0.35 fps n=0.240 L=185.0' S= '/' Capacity= cfs Inflow Outflow Time (hours)
109 15853 Post 02 Type III 24-hr 010-yr Rainfall=3.85" Prepared by Microsoft Printed 2/26/2016 HydroCAD s/n HydroCAD Software Solutions LLC Page 7 Summary for Pond 1P: Drip Edge Inflow Area = 2,162 sf,100.00% Impervious, Inflow Depth = 3.62" for 010-yr event Inflow = hrs, Volume= 651 cf Outflow = hrs, Volume= 651 cf, Atten= 86%, Lag= 0.0 min Discarded = hrs, Volume= 651 cf Primary = hrs, Volume= 0 cf Routing by Stor-Ind method, Time Span= hrs, dt= 0.04 hrs / 2 Peak Elev= hrs Surf.Area= ac Storage= af Plug-Flow detention time= 40.3 min calculated for 651 cf (100% of inflow) Center-of-Mass det. time= 40.2 min ( ) Volume Invert Avail.Storage Storage Description #1 1,361.00' af 3.00'W x 95.00'L x 2.00'H Prismatoid af Overall x 40.0% Voids Device Routing Invert Outlet Devices #1 Primary 1,362.90' 95.0' long x 3.0' breadth Broad-Crested Rectangular Weir Head (feet) Coef. (English) #2 Discarded 1,361.00' in/hr Exfiltration over Surface area Discarded OutFlow Max= hrs HW=1,361.02' (Free Discharge) 2=Exfiltration (Exfiltration Controls cfs) Primary OutFlow Max= hrs HW=1,361.00' (Free Discharge) 1=Broad-Crested Rectangular Weir ( Controls cfs)
110 15853 Post 02 Type III 24-hr 010-yr Rainfall=3.85" Prepared by Microsoft Printed 2/26/2016 HydroCAD s/n HydroCAD Software Solutions LLC Page 8 Pond 1P: Drip Edge Hydrograph Flow (cfs) cfs cfs cfs Time (hours) Inflow Area=2,162 sf Peak Elev=1,362.61' Storage=0.004 af Inflow Outflow Discarded Primary
111 15853 Post 02 Type III 24-hr 010-yr Rainfall=3.85" Prepared by Microsoft Printed 2/26/2016 HydroCAD s/n HydroCAD Software Solutions LLC Page 9 Summary for Pond 2P: Micro-Extended Detention Pond Inflow Area = 59,921 sf, 31.18% Impervious, Inflow Depth = 1.98" for 010-yr event Inflow = hrs, Volume= 9,872 cf Outflow = hrs, Volume= 3,574 cf, Atten= 93%, Lag= min Primary = hrs, Volume= 1,716 cf Secondary = hrs, Volume= 1,857 cf Routing by Stor-Ind method, Time Span= hrs, dt= 0.04 hrs Peak Elev= hrs Surf.Area= 3,260 sf Storage= 6,898 cf Plug-Flow detention time= min calculated for 3,574 cf (36% of inflow) Center-of-Mass det. time= min ( 1, ) Volume Invert Avail.Storage Storage Description #1 1,332.00' 337 cf FOREBAY (Prismatic) Listed below (Recalc) #2 1,332.50' 11,462 cf MAIN POND (Prismatic) Listed below (Recalc) 11,799 cf Total Available Storage Elevation Surf.Area Inc.Store Cum.Store (feet) (sq-ft) (cubic-feet) (cubic-feet) 1, , , , Elevation Surf.Area Inc.Store Cum.Store (feet) (sq-ft) (cubic-feet) (cubic-feet) 1, , , , ,232 1, ,903 1,492 2,724 1, ,576 2,240 4,963 1, ,235 2,906 7,869 1, ,951 3,593 11,462 Device Routing Invert Outlet Devices #1 Secondary 1,336.55' 10.0' long x 3.0' breadth Broad-Crested Rectangular Weir Head (feet) Coef. (English) #2 Primary 1,332.50' 0.7" Vert. Orifice/Grate C= Primary OutFlow Max= hrs HW=1,336.58' (Free Discharge) 2=Orifice/Grate (Orifice Controls fps) Secondary OutFlow Max= hrs HW=1,336.58' (Free Discharge) 1=Broad-Crested Rectangular Weir (Weir Controls fps)
112 15853 Post 02 Type III 24-hr 010-yr Rainfall=3.85" Prepared by Microsoft Printed 2/26/2016 HydroCAD s/n HydroCAD Software Solutions LLC Page 10 Pond 2P: Micro-Extended Detention Pond Hydrograph cfs Inflow Area=59,921 sf Peak Elev=1,336.58' Storage=6,898 cf Inflow Outflow Primary Secondary Flow (cfs) cfs cfs 15 Time (hours)
113 15853 Post 02 Type III 24-hr 010-yr Rainfall=3.85" Prepared by Microsoft Printed 2/26/2016 HydroCAD s/n HydroCAD Software Solutions LLC Page 11 Summary for Pond 3P: Drip Edge Inflow Area = 572 sf,100.00% Impervious, Inflow Depth = 3.62" for 010-yr event Inflow = hrs, Volume= 172 cf Outflow = hrs, Volume= 172 cf, Atten= 86%, Lag= 0.0 min Discarded = hrs, Volume= 172 cf Primary = hrs, Volume= 0 cf Routing by Stor-Ind method, Time Span= hrs, dt= 0.04 hrs / 2 Peak Elev= hrs Surf.Area= ac Storage= af Plug-Flow detention time= 40.8 min calculated for 172 cf (100% of inflow) Center-of-Mass det. time= 40.6 min ( ) Volume Invert Avail.Storage Storage Description #1 1,361.00' af 3.00'W x 25.00'L x 2.00'H Prismatoid af Overall x 40.0% Voids Device Routing Invert Outlet Devices #1 Primary 1,362.90' 95.0' long x 3.0' breadth Broad-Crested Rectangular Weir Head (feet) Coef. (English) #2 Discarded 1,361.00' in/hr Exfiltration over Surface area Discarded OutFlow Max= hrs HW=1,361.02' (Free Discharge) 2=Exfiltration (Exfiltration Controls cfs) Primary OutFlow Max= hrs HW=1,361.00' (Free Discharge) 1=Broad-Crested Rectangular Weir ( Controls cfs)
114 15853 Post 02 Type III 24-hr 010-yr Rainfall=3.85" Prepared by Microsoft Printed 2/26/2016 HydroCAD s/n HydroCAD Software Solutions LLC Page 12 Pond 3P: Drip Edge Flow (cfs) cfs 0 5 Hydrograph cfs cfs Time (hours) Inflow Area=572 sf Peak Elev=1,362.63' Storage=0.001 af Inflow Outflow Discarded Primary
115 15853 Post 02 Type III 24-hr 010-yr Rainfall=3.85" Prepared by Microsoft Printed 2/26/2016 HydroCAD s/n HydroCAD Software Solutions LLC Page 13 Summary for Pond 4P: NB1 Inflow Area = 2,162 sf,100.00% Impervious, Inflow Depth = 0.00" for 010-yr event Inflow = hrs, Volume= 0 cf Outflow = hrs, Volume= 0 cf, Atten= 0%, Lag= 0.0 min Primary = hrs, Volume= 0 cf Routing by Stor-Ind method, Time Span= hrs, dt= 0.04 hrs Peak Elev= 0.50 hrs Surf.Area= 2 sf Storage= 0 cf Flood Elev= 1,361.00' Surf.Area= 540 sf Storage= 247 cf Plug-Flow detention time= (not calculated: initial storage exceeds outflow) Center-of-Mass det. time= (not calculated: no inflow) Volume Invert Avail.Storage Storage Description #1 1,357.60' 4 cf 1.50'D x 2.50'H Vertical Cone/Cylinder #2 1,360.10' 243 cf Custom Stage Data (Prismatic) Listed below (Recalc) 247 cf Total Available Storage Elevation Surf.Area Inc.Store Cum.Store (feet) (sq-ft) (cubic-feet) (cubic-feet) 1, , Device Routing Invert Outlet Devices #1 Primary 1,357.60' 6.0" Round Culvert L= 45.0' CPP, square edge headwall, Ke= Inlet / Outlet Invert= 1,357.60' / 1,356.70' S= '/' Cc= n= PVC, smooth interior, Flow Area= 0.20 sf Primary OutFlow Max= hrs HW=1,357.60' (Free Discharge) 1=Culvert ( Controls cfs)
116 15853 Post 02 Type III 24-hr 010-yr Rainfall=3.85" Prepared by Microsoft Printed 2/26/2016 HydroCAD s/n HydroCAD Software Solutions LLC Page 14 Pond 4P: NB1 Flow (cfs) 1 Hydrograph Inflow Area=2,162 sf Peak Elev=1,357.60' Storage=0 cf 6.0" Round Culvert n=0.010 L=45.0' S= '/' Inflow Primary cfs Time (hours)
117 15853 Post 02 Type III 24-hr 010-yr Rainfall=3.85" Prepared by Microsoft Printed 2/26/2016 HydroCAD s/n HydroCAD Software Solutions LLC Page 15 Summary for Pond 5P: Ex 10" Culvert [57] Hint: Peaked at 1,348.85' (Flood elevation advised) Inflow Area = 10,125 sf, 24.46% Impervious, Inflow Depth = 1.92" for 010-yr event Inflow = hrs, Volume= 1,619 cf Outflow = hrs, Volume= 1,619 cf, Atten= 0%, Lag= 0.0 min Primary = hrs, Volume= 1,619 cf Routing by Stor-Ind method, Time Span= hrs, dt= 0.04 hrs Peak Elev= hrs Device Routing Invert Outlet Devices #1 Primary 1,348.44' 10.0" Round Culvert L= 90.0' CPP, projecting, no headwall, Ke= Inlet / Outlet Invert= 1,348.44' / 1,347.54' S= '/' Cc= n= Steel, smooth, Flow Area= 0.55 sf Primary OutFlow Max= hrs HW=1,348.85' (Free Discharge) 1=Culvert (Inlet Controls fps) Pond 5P: Ex 10" Culvert Hydrograph Flow (cfs) cfs Inflow Area=10,125 sf Peak Elev=1,348.85' 10.0" Round Culvert n=0.012 L=90.0' S= '/' Inflow Primary Time (hours)
118 15853 Post 02 Type III 24-hr 010-yr Rainfall=3.85" Prepared by Microsoft Printed 2/26/2016 HydroCAD s/n HydroCAD Software Solutions LLC Page 16 Summary for Link Dp1: Discharge Point #1 Inflow Area = 13,537 sf, 36.46% Impervious, Inflow Depth = 1.61" for 010-yr event Inflow = hrs, Volume= 1,818 cf Primary = hrs, Volume= 1,818 cf, Atten= 0%, Lag= 0.0 min Primary outflow = Inflow, Time Span= hrs, dt= 0.04 hrs Link Dp1: Discharge Point #1 Hydrograph Flow (cfs) cfs Time (hours) Inflow Area=13,537 sf Inflow Primary
119 15853 Post 02 Type III 24-hr 010-yr Rainfall=3.85" Prepared by Microsoft Printed 2/26/2016 HydroCAD s/n HydroCAD Software Solutions LLC Page 17 Summary for Link Dp2: Discharge Point #2 Inflow Area = 70,046 sf, 30.21% Impervious, Inflow Depth > 0.89" for 010-yr event Inflow = hrs, Volume= 5,192 cf Primary = hrs, Volume= 5,192 cf, Atten= 0%, Lag= 0.0 min Primary outflow = Inflow, Time Span= hrs, dt= 0.04 hrs Link Dp2: Discharge Point #2 Hydrograph cfs Inflow Area=70,046 sf Inflow Primary Flow (cfs) Time (hours)
120 3.5 Stone Riprap Calculations (Energy Dissipation Stability Calculations)
121 Stone Fill Sizing - Outlet Protection Calculations 25 year storm Project: F&PAC Roof Drain Pipe Performed By: WTD Checked By: Date: 2/2/2016 Apron Length When Tail water depth at pipe outlet is less (<) than 1/2 the dia. pipe use Eq 1: La = 1.8 x Q + 7 x D D 3/2 When Tail water depth at pipe outlet is greater (>) than 1/2 the dia. pipe use Eq 2: La = 3 x Q + 7 x D D 3/2 Apron Width at Outlet = 3 x D Eq3 or channel bottom width, when there is a well defined channel Downstream Apron Width when there is NO well defined channel at pipe outlet and the Tailwater Depth is less (<) than the elevation of the center of the pipe use Eq 4 W=3D+La or if the Tailwater Depth is greater (>) than the elevation of the center of the pipe use Eq 5 W=3D+0.4xLa Where D= pipe Diameter La= apron length W= apron width Q=Discharge from pipe CFS Tw=Tailwater 8" Diameter HDPE (smooth interior) Channel CFS Feet Feet (Y or N) Data: Q= 3 D= 0.67 Tw= 0.66 y 1) Apron Width at Outlet Use Channel Bottom Width for Feet 2) Apron Length Use Eq 2 21 Feet 3) Downstream Apron Width Use Channel Bottom Width for Feet 4) Stone Size 4/3 d50 = 0.02 x Q Tw x D 0.20 Feet Use NHDOT Class C Stone Fill C:\Users\Admin\Desktop\15853 CSC - Fine Arts Center\DOCS\Comps\Stone Sizing Outlet Protection - CSC F&PAC.xls
 = 1357.00 Rise (in) = 10.0 Shape = Cir Span (in) = 10.0 No. Barrels = 1 n-value = 0.012 Inlet Edge = Sq Edge Coeff. K,M,c,Y,k = 0.0098, 2, 0.0398, 0.67, 0.")
122 Culvert Report Hydraflow Express Extension for AutoCAD Civil 3D 2009 by Autodesk, Inc. Wednesday, Mar Inch Roof Drain Invert Elev Dn (ft) = Pipe Length (ft) = Slope (%) = 4.00 Invert Elev Up (ft) = Rise (in) = 10.0 Shape = Cir Span (in) = 10.0 No. Barrels = 1 n-value = Inlet Edge = Sq Edge Coeff. K,M,c,Y,k = , 2, , 0.67, 0.5 Embankment Top Elevation (ft) = Top Width (ft) = Crest Width (ft) = Calculations Qmin (cfs) = 1.00 Qmax (cfs) = 4.00 Tailwater Elev (ft) = (dc+d)/2 Highlighted Qtotal (cfs) = 3.00 Qpipe (cfs) = 3.00 Qovertop (cfs) = 0.00 Veloc Dn (ft/s) = 5.60 Veloc Up (ft/s) = 5.79 HGL Dn (ft) = HGL Up (ft) = Hw Elev (ft) = Hw/D (ft) = 2.10 Flow Regime = Inlet Control
123 Stone Fill Sizing - Outlet Protection Calculations 25 year storm Project: F&PAC Roof Drain Pipe Performed By: WTD Checked By: Date: 2/2/2016 Apron Length When Tail water depth at pipe outlet is less (<) than 1/2 the dia. pipe use Eq 1: La = 1.8 x Q + 7 x D D 3/2 When Tail water depth at pipe outlet is greater (>) than 1/2 the dia. pipe use Eq 2: La = 3 x Q + 7 x D D 3/2 Apron Width at Outlet = 3 x D Eq3 or channel bottom width, when there is a well defined channel Downstream Apron Width when there is NO well defined channel at pipe outlet and the Tailwater Depth is less (<) than the elevation of the center of the pipe use Eq 4 W=3D+La or if the Tailwater Depth is greater (>) than the elevation of the center of the pipe use Eq 5 W=3D+0.4xLa Where D= pipe Diameter La= apron length W= apron width Q=Discharge from pipe CFS Tw=Tailwater 8" Diameter HDPE (smooth interior) Channel CFS Feet Feet (Y or N) Data: Q= 3 D= 0.83 Tw= 0.79 y 1) Apron Width at Outlet Use Channel Bottom Width for Feet 2) Apron Length Use Eq 2 18 Feet 3) Downstream Apron Width Use Channel Bottom Width for Feet 4) Stone Size 4/3 d50 = 0.02 x Q Tw x D 0.13 Feet Use NHDOT Class C Stone Fill Q:\15853 CSC - Fine Arts Center\DOCS\Comps\Stone Sizing Outlet Protection - CSC F&PAC.xls
124 Weir Report Hydraflow Express Extension for AutoCAD Civil 3D 2009 by Autodesk, Inc. Tuesday, Feb Micro-Extended Detention Pond (2P) Weir Outlet Trapezoidal Weir Crest = Sharp Bottom Length (ft) = Total Depth (ft) = 1.30 Side Slope (z:1) = 3.00 Calculations Weir Coeff. Cw = 3.10 Compute by: Known Q Known Q (cfs) = 3.00 Highlighted Depth (ft) = 0.21 Q (cfs) = Area (sqft) = 2.23 Velocity (ft/s) = 1.34 Top Width (ft) = Depth (ft) Micro-Extended Detention Pond (2P) Weir Outlet Depth (ft) Weir W.S. Length (ft)
125
126 3.6 Site Specific Soil Survey

127 SITE-SPECIFIC SOIL MAP REPORT Colby Sawyer College New London, NH prepared for Horizons Engineering, Inc PO Box 1825 New London, NH January 31, 2016 Beaver Tracks, LLC 21 Hale Hill Road Swanzey, NH 03446
128 Introduction This report accompanies a site-specific soil survey map produced by Jonathan A Sisson III, NH Certified Soil Scientist. The site-specific soil map was completed on January 26, The site is approximately 4.0 acres of land to the east side of the Colby Farm building on the Colby Sawyer College campus. The soil map is for the construction of a detention pond and new building. This soil map is required for an alteration of terrain permit in New Hampshire. Methodology The soil map was produced according to the guidelines provided in "Site-Specific Soil Mapping Standards For New Hampshire and Vermont", version 3.0, December 2006, SSSNNE Special Publication No. 3. Soil samples were taken using a long handled shovel and a soil auger. Soil series name of each sample was determined from the NRCS Merrimack County Soil Catena table by the parent material, the drainage classification, and presence or lack of a dense layer. Test holes (points) were located with a Thales ProMark 3 GPS unit. Point data was post processed with data from a second Thales ProMark 3 GPS unit located on the property. The corrected data was then imported into Carlson Civil (CAD based program). In Carlson Civil, the final soil lines and text were digitally drawn on the topographic plan provided by Horizons Engineering. Comments The soils in the mapping area is slightly disturbed. Top soil has been pushed around for the construction of the farm house, town water facility, roads and the tennis courts. All areas have a fine sandy loam dense layer. Six test pits were dug by hand and four dug by a small excavator. Only one of the test pits had redox. This one test pit was in a man-made drainage area. The soil series for the area that with redox is Peru. The soil series for the rest of the area (with no redox to 40") is Marlow. The third soil series on the soil map is areas that are filled for roads (gravel and concrete) and buildings. This filled area has an impervious surface over fine sandy loam with a dense layer. Soil Map Unit Descriptions Unit Unit Name Drainage Class Hydrologic Parent Material Symbol Group 76A,B,C,D,E Marlow Well C Glacial Till 78D Peru Moderately Well C Glacial Till

129 Soil Map Unit Descriptions Drainage Class Parent Components of the Disturbed Soil 2 Unit Material Restrictive Ksat Hydrologic Symbol 1 Layer Group 299A/cccbc c=well c= glacial till c= Less than 40 b=moderate c 1 Unit Symbol taken from Catena Key for Disturbed, Filled Land and Bottom Land table on page 22 in NH State-Wide Numerical Soil Legend, Issue #10, January Components of the Disturbed Soil obtained from NH Supplement, Feb 2011 of the Site- Specific Soil Mapping Standards For New Hampshire and Vermont, version 3.0, December 2006, SSSNNE Special Publication No. 3


130 C:\Users\Admin\AppData\Local\Microsoft\Windows\Temporary Internet Files\Content.Outlook\S5NE029K\Colby Sawyer Soil Map.dwg, SOIL MAP 24X36, 2/5/2016 2:37:31 PM, Admin
131 3.7 Infiltration Feasibility Report
132 INFILTRATION FEASIBILITY REPORT COLBY-SAWYER FINE & PERFORMING ARTS BUILDING NEW LONDON, NEW HAMPSHIRE FEBRUARY 2016 TABLE OF CONTENTS I. LOCATION OF THE PRACTICE II. EXISTING TOPOGRAPHY AT THE PRACTICE LOCATION III. TEST PIT LOCATIONS IV. SUBSURFACE SYSTEM PLAN AND DETAILS V. SEASONAL HIGH WATER AND BEDROCK ELEVATION VI. TEST PIT LOGS VII. DESIGN INFILTRATION RATE PROJECT NO Copyright 2016 Horizons Engineering, Inc.
133 I. LOCATION OF THE PRACTICES The proposed Fine & Performing Arts Building is located on the Colby-Sawyer College campus where the Colby Farm House is currently sited. Two (2) infiltration practices are planned; one westerly of the proposed building and one east of the proposed building and south of the tennis courts. II. EXISTING TOPOGRAPHY AT THE PRACTICE LOCATIONS The area where test pits 1 and 2 were excavated is generally level. Test pit 1 was on the bank of a small stormwater pond. This area will be regraded as part of the project. The area around test pit 3 slopes to the east at a gradient of approximately 10%. The gradient near test pit 4 appears to be shallower. This area has been filled to level the southeast corner of the adjacent tennis courts. The field at test pits 3 and 4 is obviously mowed on a regular basis. III. TEST PIT LOCATIONS Four test pits were excavated on January 28, Two are located in each of the proposed practice areas. The locations of test pits 1 and 2 were significantly dictated by subsurface utilities. Utilities were not a problem at test pits 3 and 4. The pits were excavated to determine soil types, the depth to estimated seasonal high water table (ESHWT), and depth to bedrock or other restrictive layer. The test pits were excavated by Andrews Construction, Inc. and logged by Bruce H. Cox, P.E. of Horizons Engineering, Inc. IV. SUBSURFACE SYSTEM PLAN AND DETAILS (SEE ATTACHED) V. SEASONAL HIGH WATER AND BEDROCK ELEVATION TP-1 Ground elevation at the test pit 1360 Pit bottom at 7.5+ elev No bedrock observed to ESHWT: 23 TP-2 Ground elevation at the test pit 1362 Pit bottom at 7 + elev <1355 No bedrock observed to 7 ESHWT: 23 TP-3 Ground elevation at the test pit 1334 Pit bottom at 7 + elev <1327 No bedrock observed to 7 + ESHWT: 23
134 TP-4 Ground elevation at the test pit 1328 Pit bottom at 6 + elev <1322 No bedrock observed to 6 + ESHWT: 24 VI. TEST PIT LOGS Detailed test pit logs were prepared for each excavation as described in Env-Wq (d). The test pit logs are attached. VII. DESIGN INFILTRATION RATE The infiltration rate was determined from Borehole Infiltration tests as described in Env-Wq (e) (4). The tests were completed on January 28, 2016 by Horizons personnel. The test sheets are attached. BIT-1 (TP-2) Depth of test: 23 Rates: >11.5 /hr, 9.9 /hr, 9.0 /hr, 8.0 /hr. Calculated rate = 8.0 /hr BIT-2 (TP-3) Depth of test: 22 Rates: 5.0 /hr, 4.4 /hr, 4.9 /hr, 4.8 /hr. Calculated rate = 4.8 /hr Summary: Given these rates, the existing soils are judged to meet the AoT infiltration requirements without amendment or modification.
135 Project: Fine Arts Building Horizons Engineering, Inc. 176 Newport Road, P.O. Box 1825 New London, New Hampshire Test Pit Log No.: 1 Project No.: Client: Colby Sawyer College Subcontractor: Andrews Construction Operator: Date: 1/28/2016 Inspector: B. Cox Site Conditions Equipment Test Pit Location Partly sunny, teens 30 s Hitachi ZX75US Edge of existing stormwater pond Digging Effort (Easy, Moderate, Depth Sketch Description Difficult) Other 4 ± Dark brown (10YR/3/3) Topsoil (FINE SANDY LOAM). Friable, very fine fine grained, well sorted sand. 10%+ non- plastic fines. Fine roots. Olive brown (2.5Y/4/3) FINE SANDY LOAM. Fine medium grained, moderately poorly sorted sand. Friable. 10% - 20% non-plastic fines. Trace of stones to 2. Very dark grayish brown (10YR/3/2) FINE SANDY LOAM. Friable firm at bottom. Very fine fine grained, moderately well sorted sand. 20%+ nonplastic fines. Dry. Olive brown (2.5Y/4/3) FINE SANDY LOAM (TILL). Dense, platy, very fine fine grained, moderately well sorted sand. 20%± nonplastic fines. 10% stones 3 rarely 12. Mottles at 23. Slightly moist. Summary: No refusal to depth. No seepage observed. Depth to estimated seasonal high water: 23 D (frozen) D (frozen) E E - M
136 Project: Fine Arts Building Horizons Engineering, Inc. 176 Newport Road, P.O. Box 1825 New London, New Hampshire Test Pit Log No.: 2 Project No.: Client: Colby Sawyer College Subcontractor: Andrews Construction Operator: Date: 1/28/2016 Inspector: B. Cox Site Conditions Equipment Test Pit Location Partly sunny, teens 30 s Hitachi ZX75US Near existing stormwater pond Digging Effort (Easy, Moderate, Depth Sketch Description Difficult) Other 4 ± Dark brown (10YR/3/3) Topsoil (FINE SANDY LOAM). Friable, very fine fine grained, well sorted sand. 10%+ non- plastic fines. Fine roots. Olive brown (2.5Y/4/3) FINE SANDY LOAM. Fine medium grained, moderately poorly sorted sand. Friable. 10% - 20% non-plastic fines. Trace of stones to 2. Very dark grayish brown (10YR/3/2) FINE SANDY LOAM. Friable firm at bottom. Very fine fine grained, moderately well sorted sand. 20%+ nonplastic fines. Roots to 21. Dry. Olive brown (2.5Y/4/3) FINE SANDY LOAM (TILL). Dense, platy, very fine fine grained, moderately well sorted sand. 20%± nonplastic fines. 10% stones 3 rarely 12. Mottles at 23. Slightly moist. Summary: No refusal to depth. No seepage observed. Depth to estimated seasonal high water: 23 D (frozen) D (frozen) E E - M
137 Project: Fine Arts Building Horizons Engineering, Inc. 176 Newport Road, P.O. Box 1825 New London, New Hampshire Test Pit Log No.: 3 Project No.: Client: Colby Sawyer College Subcontractor: Andrews Construction Operator: Date: 1/28/2016 Inspector: B. Cox Site Conditions Equipment Test Pit Location Partly sunny, teens 30 s Hitachi ZX75US South of the tennis courts Digging Effort (Easy, Moderate, Depth Sketch Description Difficult) Dark brown (10YR/3/3) Topsoil (FINE SANDY LOAM). Friable, very fine fine grained, well sorted sand. 10%+ non- plastic fines. Fine roots. Very dark grayish brown (10YR/3/2) FINE SANDY LOAM. Friable firm at bottom. Very fine fine grained, moderately well sorted sand. 20%+ nonplastic fines. Mottles at 23. Dry. Very dark grayish brown (2.5Y/3/2) FINE SANDY LOAM (TILL). Dense, platy, very fine fine grained, moderately well sorted sand. 20%± non-plastic fines. 10% stones 3 rarely 12. Mottles at 23. Slightly moist. Summary: E E E - M Other No refusal to depth. No seepage observed. Depth to estimated seasonal high water: 23

138 Project: Fine Arts Building Horizons Engineering, Inc. 176 Newport Road, P.O. Box 1825 New London, New Hampshire Test Pit Log No.: 4 Project No.: Client: Colby Sawyer College Subcontractor: Andrews Construction Operator: Date: 1/28/2016 Inspector: B. Cox Site Conditions Equipment Test Pit Location Partly sunny, teens 30 s Hitachi ZX75US South of the tennis courts Digging Effort (Easy, Moderate, Depth Sketch Description Difficult) Dark brown (10YR/3/3) Topsoil (FINE SANDY LOAM). Friable, very fine fine grained, well sorted sand. 10%+ non- plastic fines. Occasional light medium gray silty inclusions. Fine roots. Very dark grayish brown (10YR/3/2) FINE SANDY LOAM. Friable firm at bottom. Very fine fine grained, moderately well sorted sand. 20%+ nonplastic fines. Very dark grayish brown (2.5Y/3/2) FINE SANDY LOAM (TILL). Dense, platy, very fine fine grained, moderately well sorted sand. 20%± non-plastic fines. 10% stones 3 rarely 12. Mottles at 24. Slightly moist. Summary: E E E - M Other No refusal to depth. No seepage observed. Depth to estimated seasonal high water: 24
139 BOREHOLE INFILTRATION TEST CLIENT: PROJECT: ADDRESS: COLBY - SAWYER COLLEGE FINE ARTS BUILDING COLBY - SAWYER COLLEGE INFILTRATION TEST NO.: BIT-1 ASSOCIATED TEST PIT(S): TP-2 CONDUCTED BY: B. COX DATE: 1/28/2016 DEPTH OF TEST: 23" CASING DIA.: 4" SATURATION PERIOD: START: 12:00 NOON END: 1:00 PM START START END END RATE TIME DISTANCE TIME DISTANCE (IN/HR) 1:00 PM 18 1/2" 2:00 PM 30" >11.5 2:00 PM 18 5/8" 3:00 PM 29 1/2" 9.9 3:00 PM 19 1/2" 4:00 PM 28 1/2" 9.0 4:00 PM 20 1/8" 5:00 PM 28 1/8" 8.0 FINAL RATE: 8.0 IN/HR INFILTRATION TEST NO.: BIT-2 ASSOCIATED TEST PIT(S): TP-3 CONDUCTED BY: B. COX DATE: 1/28/2016 DEPTH OF TEST: 22" CASING DIA.: 4" SATURATION PERIOD: START: 12:05 PM END: 1:05 PM START START END END RATE TIME DISTANCE TIME DISTANCE (IN/HR) 1:05 PM 14 3/4" 2:05 PM 19 3/4" 5.0 2:05 PM 15" 3:05 PM 19 3/8" 4.4 3:05 PM 14 1/2" 4:05 PM 19 3/8" 4.9 4:05 PM 14 3/4" 5:05 PM 19 1/2" 4.8 FINAL RATE: 4.8 IN/HR

 looking southeast.")
140 Infiltration Feasibility Report; Colby-Sawyer Fine Arts Building Site Photographs January 28, 2016 New London, New Hampshire Photo 1: Test pit 1 (foreground) and test pit 2 (background) looking southeast. Photo 2: Test pit 1 looking northeast.


141 Infiltration Feasibility Report; Colby-Sawyer Fine Arts Building Site Photographs January 28, 2016 New London, New Hampshire Photo 3: Test pits 2 looking southeast. Photo 4: Test pit 3 looking east.


142 Infiltration Feasibility Report; Colby-Sawyer Fine Arts Building Site Photographs January 28, 2016 New London, New Hampshire Photo 5: Test pit 3 looking north. Photo 6: Test pit 4 looking northeast.
143 3.8 Inspection and Maintenance Manual
144 Inspection and Maintenance Plan Colby-Sawyer College - Fine & Performing Arts Center New London, NH Introduction This document is intended to provide a unified procedure for the party (ies) responsible for inspecting and maintaining the stormwater management device(s) that are located within the site development (see Design Plan for the device locations). Responsible Parties The ultimate responsibility for complying with this plan rests with the owners of the Property. Owner s Name: Colby-Sawyer College Prior to transfer of ownership to another entity the existing owner shall notify DES in writing of such transfer. Parties assigned to complete inspection and maintenance tasks are presented in the following table: DEVICE TASK PARTY RESPONSIBLE Structural Stormwater Devices Micro-Extended Detention Pond Inspection OWNER Maintenance OWNER Reporting OWNER Catch Basins and Culverts Inspection OWNER Maintenance OWNER Reporting OWNER Stone Infiltration Drip Edge Inspection OWNER Maintenance OWNER Reporting OWNER
145 Frequency of Activities The best time to perform inspections is during the onset of rain. To the extent practicable inspections should be timed to coincide with moderate storms that do not have the potential for severe (thunderstorms, etc.) precipitation. The frequency of inspection and maintenance will vary by intensity of use; however the following shall serve as the minimum inspection frequency: Structural Devices: Spring and fall Infiltration Drip Edges: Once annually, the system should be inspected for a drawdown time of 72 hours. The system has been designed with inspection ports for access for inspection and maintenance. Pretreatment measures should be inspected and cleaned at least twice annually. Ponds should be inspected at least twice annually. Maintenance frequencies will be determined based upon the results of the inspections and if specific maintenance thresholds are observed to have been crossed during inspections. All inspection activities shall be recorded on the appropriate attached Inspection Form. One form shall be used for each stormwater device. Records A record of inspection and maintenance activities shall be recorded on the Inspection and Maintenance Log presented following. Records of Inspection Forms and Inspection and Maintenance Logs shall be made available upon request.
146 Stormwater BMP Inspection and Maintenance Log Year Colby-Sawyer College - Fine & Performing Arts Center New London, NH INSPECTION FOLLOW UP ACTIVITY DEVICE/ LOCATION Date Insp. Name Date Action Taken
147 Micro-Extended Detention Pond BMP Name Inspection Form Colby-Sawyer College Fine & Performing Arts Center New London, NH Date of today s inspection / / Inspector Name Date of last inspection (of this BMP) / / Recent Weather history Storm date(s) Storm duration Rainfall amount Did runoff occur? Today s Weather INSPECTION AREAS Outlet(s) from BMP Banks LOOK FOR CIRCLE ONE IF YES Turbid Discharge? Y N Follow turbidity upgradient to source and stabilize Scour? Y N Replace scour apron to original plan dimensions, may need to increase D 50 stone size Clogged pipe/weir Y N Remove clog and debris in vicinity of outlet Seepage Y N If Dam, consult O&M plan otherwise attempt to find source with dye and plug with bentonite Erosion? Y N Reshape, seed and apply erosion control matting Large areas of sparse growth above Y N Take soil sample and apply slow release amendments(n, K) per results waterline? Large areas below waterline are slumping? Y N Either establish appropriate wetland vegetation or apply stone Settling? Y N Consult Dam O&M plan if
148 Floor Woody growth on dam faces? Trash or debris accumulations? Filter Media failure? Does system drain in 72 hours? applicable, otherwise fill void with specified material, compact, and vegetate Y N Remove per Dam O&M Y N Remove all trash at every inspection Y N Replace per manufacturer s specifications Y N Seek a qualified professional to assess the condition to determine measures required to restore filtration function, including but not limited to removal of accumulated sediments or reconstruction of the filter. Inlet(s) to BMP Is grass covering the 1 gravel debris screen? Y N Replace per manufacturer s specifications Scour? Y N Replace scour apron to original plan dimensions, may need to increase D 50 stone size and/ or add check dam Sediment accumulation? Y N Look at pretreatment device and clean once sediment occupies 50% of volume, then clean out inlet pipe to main device Culverts Sediment or debris at Culvert inlet or outlets? Y N Remove sediment. Inspect culvert and clean if necessary
149 Catch Basins and Culverts BMP Name Inspection Form Colby-Sawyer College - Fine & Performing Arts Center New London, NH Date of today s inspection / / Inspector Name Date of last inspection (of this BMP) / / Recent Weather history Storm date(s) Storm duration Rainfall amount Did runoff occur? Today s Weather INSPECTION AREAS Catchbasin Culverts LOOK FOR CIRCLE ONE IF YES Sump full of sediment? Sediment or debris at Culvert inlet or outlets? Y N Remove sediment. Inspect culvert and clean if necessary Y N Remove sediment. Inspect culvert and clean if necessary
150 3.10 References Preparer s Certification

151 REFERENCES Mays, Larry. Stormwater Collection Systems Design Handbook. McGraw-Hill. New York, NY McCarthy, David. Essentials of Soil Mechanics and Foundations: Sixth Edition. Prentice Hall. Columbus, Ohio NHDES. New Hampshire Stormwater Manual. New Hampshire Department of Environmental Services NHDES. New Hampshire Homeowner s Guide to Stormwater Management. New Hampshire Department of Environmental Services The UNH Stormwater Center, The LID Stormwater Management Systems Demonstrate LID Stormwater Management Systems Demonstrate Superior Cold Climate Performance than Superior Cold Climate Performance than Conventional Stormwater Management Systems, UNH Stormwater Center, NEIWPCC 2007 NPS Conference, Newport, RI, May 2007 PREPARER S CERTIFICATION Prepared by William T. Davis, PE
152 SECTION 4.0 PLANS
153 4.1 Design Plans (Unbound)
154 This Section Left Intentionally Blank (Plans Bound Separately)
155 4.2 Certified Wetlands Plan N/A
156 4.3 Color Coded Hydrologic Soils Group Plans
157 SOIL MAP WAS PRODUCED ACCORDING TO THE GUIDELINES PROVIDED IN "SITE-SPECIFIC SOIL MAPPING STANDARDS FOR NEW HAMPSHIRE AND VERMONT", VERSION 3.0, DECEMBER 2006, SSSNNE SPECIAL PUBLICATION NO. 3 SITE SPECIFIC SOIL MAP WAS COMPLETED JANUARY 26, 2016 SOILS MAPPING COMPLETED BY: Beaver Tracks, LLC 21 Hale Hill Road Swanzey, NH Phone: Fax: beavertracksllc@yahoo.com Q:\15853 CSC - Fine Arts Center\DWGS\Final\15853 Drainage 01.dwg, 4.3A, 2/11/2016 6:02:55 PM, Admin COLOR-CODED SOIL LEGEND HYDRIC SOIL GROUP A B C D W IMPERVIOUS 40 SCALE IN FEET COLOR 76A MARLOW FINE SANDY LOAM, 0-3% SLOPE, WELL DRAINED 76B MARLOW FINE SANDY LOAM, 3-8% SLOPE, WELL DRAINED 76C MARLOW FINE SANDY LOAM, 8-15% SLOPE, WELL DRAINED 76D MARLOW FINE SANDY LOAM, 15-25% SLOPE, WELL DRAINED 76E MARLOW FINE SANDY LOAM, >25% SLOPE, WELL DRAINED 78D PERU FINE SANDY LOAM, 15-25% SLOPE, MODERATELY WELL DRAINED 299A/cccbc-UDORTHENTS, SMOOTHED AREA IS IMPERVIOUS BY EITHER CONCRETE OR GRAVEL DATE OF PRINT 80 C 2016 Littleton NH New London NH Newport VT NEW LONDON, NEW HAMPSHIRE PRE-DEVELOPMENT COLOR CODED SOILS MAP REVISION DESCRIPTION DATE: ENGIN'D BY: CHECK'D BY: HORIZONS ENGINEERING All rights reserved 4.3A NO. COLBY-SAWYER COLLEGE FINE & PERFORMING ARTS CENTER DATE FEB 2016 WTD DEB ENG PROJECT #: DRAWN BY: WTD ARCHIVE #: H-5263 DWG
158 SOIL MAP WAS PRODUCED ACCORDING TO THE GUIDELINES PROVIDED IN "SITE-SPECIFIC SOIL MAPPING STANDARDS FOR NEW HAMPSHIRE AND VERMONT", VERSION 3.0, DECEMBER 2006, SSSNNE SPECIAL PUBLICATION NO. 3 SITE SPECIFIC SOIL MAP WAS COMPLETED JANUARY 26, 2016 SOILS MAPPING COMPLETED BY: Beaver Tracks, LLC 21 Hale Hill Road Swanzey, NH Phone: Fax: beavertracksllc@yahoo.com Q:\15853 CSC - Fine Arts Center\DWGS\Final\15853 Drainage 01.dwg, 4.3B, 2/11/2016 6:03:08 PM, Admin COLOR-CODED SOIL LEGEND HYDRIC SOIL GROUP A B C D W IMPERVIOUS 40 SCALE IN FEET COLOR 76A MARLOW FINE SANDY LOAM, 0-3% SLOPE, WELL DRAINED 76B MARLOW FINE SANDY LOAM, 3-8% SLOPE, WELL DRAINED 76C MARLOW FINE SANDY LOAM, 8-15% SLOPE, WELL DRAINED 76D MARLOW FINE SANDY LOAM, 15-25% SLOPE, WELL DRAINED 76E MARLOW FINE SANDY LOAM, >25% SLOPE, WELL DRAINED 78D PERU FINE SANDY LOAM, 15-25% SLOPE, MODERATELY WELL DRAINED 299A/cccbc-UDORTHENTS, SMOOTHED AREA IS IMPERVIOUS BY EITHER CONCRETE OR GRAVEL DATE OF PRINT 80 C 2016 Littleton NH New London NH Newport VT NEW LONDON, NEW HAMPSHIRE POST-DEVELOPMENT COLOR CODED SOILS MAP REVISION DESCRIPTION DATE: ENGIN'D BY: CHECK'D BY: HORIZONS ENGINEERING All rights reserved 4.3B NO. COLBY-SAWYER COLLEGE FINE & PERFORMING ARTS CENTER DATE FEB 2016 WTD DEB ENG PROJECT #: DRAWN BY: WTD ARCHIVE #: H-5263 DWG
159 4.4 Pre- & Post-Development Drainage Area Plans
160 Dp1 Pr1 LEGEND Q:\15853 CSC - Fine Arts Center\DWGS\Final\15853 Drainage 02.dwg, 4.4A, 2/26/2016 1:31:26 PM, Admin Pr3 Pr2 1P 1R Dp Po1b SCALE IN FEET DATE OF PRINT EXISTING CONTOUR, MAJOR EXISTING CONTOUR, MINOR PROPOSED CONTOUR, MAJOR PROPOSED CONTOUR, MINOR SUBCATCHMENT BOUNDARY WATERSHED LABEL SUBCATCHMENT FLOW PATH REACH PATH 200 C 2016 Littleton NH New London NH Newport VT NEW LONDON, NEW HAMPSHIRE PRE-DEVELOPMENT DRAINAGE PLAN REVISION DESCRIPTION DATE: ENGIN'D BY: CHECK'D BY: HORIZONS ENGINEERING All rights reserved 4.4A NO. COLBY-SAWYER COLLEGE FINE & PERFORMING ARTS CENTER DATE FEB 2016 WTD DEB ENG PROJECT #: DRAWN BY: WTD ARCHIVE #: H-5263 DWG

161 Dp1 Po1a Po1b LEGEND EXISTING CONTOUR, MAJOR Q:\15853 CSC - Fine Arts Center\DWGS\Final\15853 Drainage 02.dwg, 4.4B, 2/26/2016 1:31:38 PM, Admin Po2b Po3 Po2a 5P 1R Dp Po1b SCALE IN FEET DATE OF PRINT EXISTING CONTOUR, MINOR PROPOSED CONTOUR, MAJOR PROPOSED CONTOUR, MINOR SUBCATCHMENT BOUNDARY WATERSHED LABEL SUBCATCHMENT FLOW PATH REACH PATH 200 C 2016 Littleton NH New London NH Newport VT NEW LONDON, NEW HAMPSHIRE POST-DEVELOPMENT DRAINAGE PLAN REVISION DESCRIPTION DATE: ENGIN'D BY: CHECK'D BY: HORIZONS ENGINEERING All rights reserved 4.4B NO. COLBY-SAWYER COLLEGE FINE & PERFORMING ARTS CENTER DATE FEB 2016 WTD DEB ENG PROJECT #: DRAWN BY: WTD ARCHIVE #: H-5263 DWG