Producing Premium DDGS
|
|
|
- Valerie Cummings
- 5 years ago
- Views:
Transcription
1


2 Producing Premium DDGS Can it be Achieved in a Commodity Driven Market? Tara Vigil Vice President Business Development
3

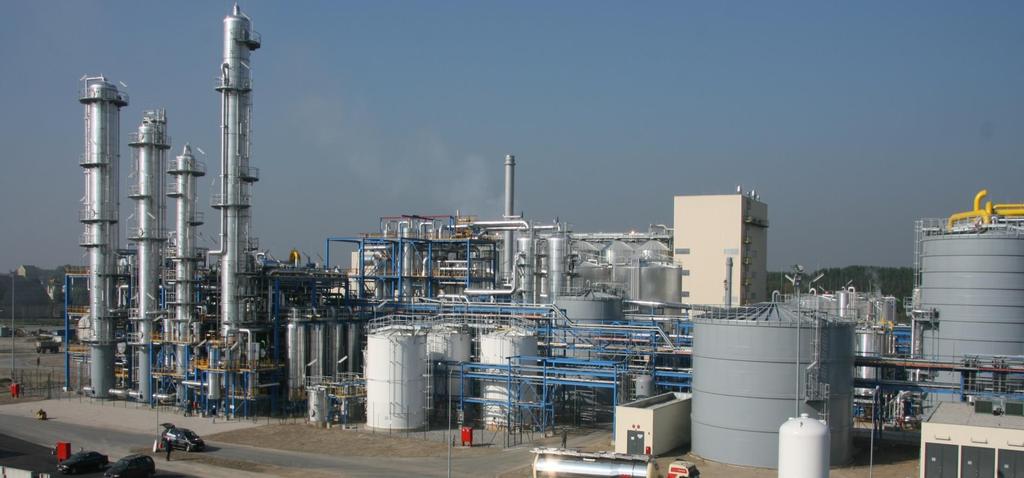
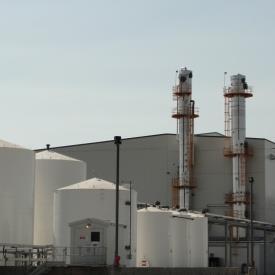
4 Ethanol Plant


5 Profit Considerations Feedstock Dominates Costs Ethanol Dominates Revenue Feedstock Utilities Chemicals Ethanol Coproducts Other Expense Fixed Costs However. Source: USDA Market News, State EthanolPlant Reports as compiled by Agricultural Marketing Resource Center
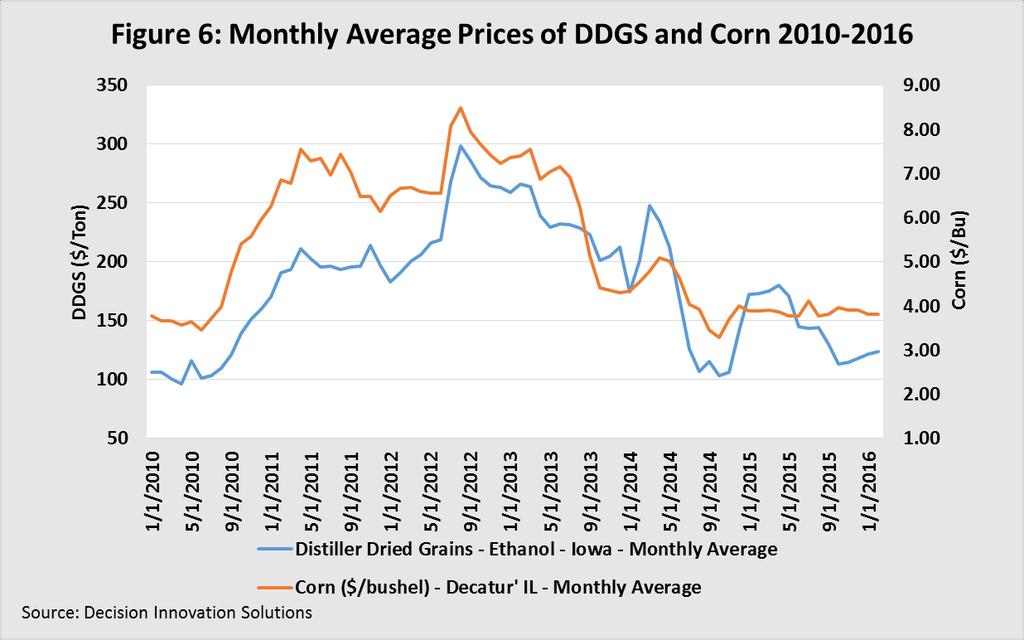
6 Jan-05 May-05 Sep-05 Jan-06 May-06 Sep-06 Jan-07 May-07 Sep-07 Jan-08 May-08 Sep-08 Jan-09 May-09 Sep-09 Jan-10 May-10 Sep-10 Jan-11 May-11 Sep-11 Jan-12 May-12 Sep-12 Jan-13 May-13 Sep-13 Jan-14 May-14 Sep-14 Jan-15 Coproducts Make the Margin $4.00 $3.50 $3.00 $2.50 $2.00 $1.50 DDGS Revenue Ethanol Revenue Total Variable and Fixed Cost Total Ethanol + DDGS Revenue $1.00 $0.50 $- Source: Summarized from Ag Decision Maker, D1-10 Ethanol Profitability 4/16/2015 Don Hofstrand


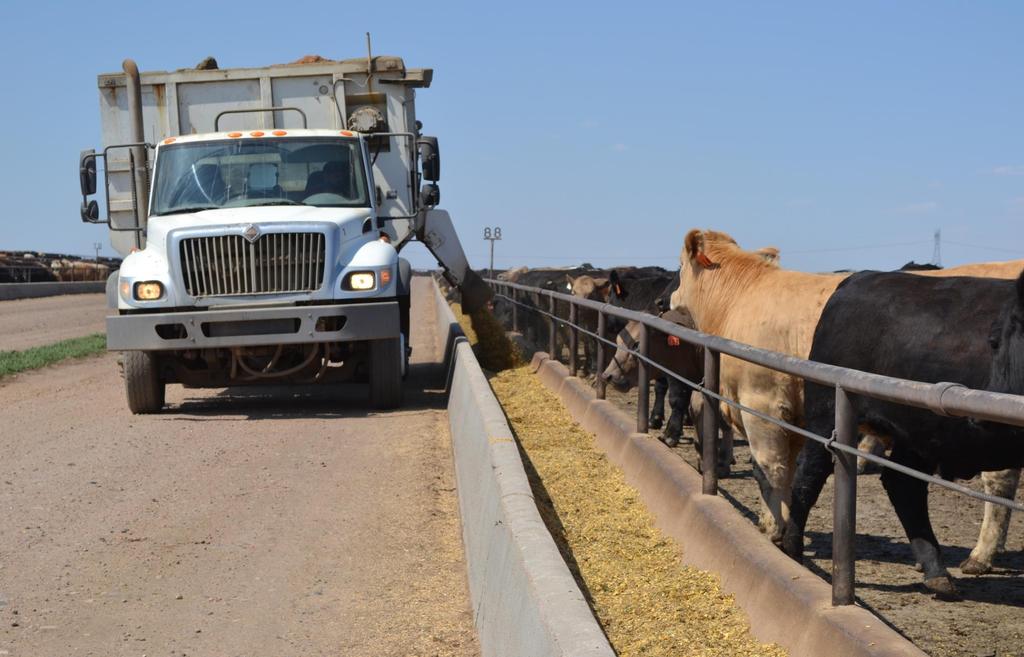
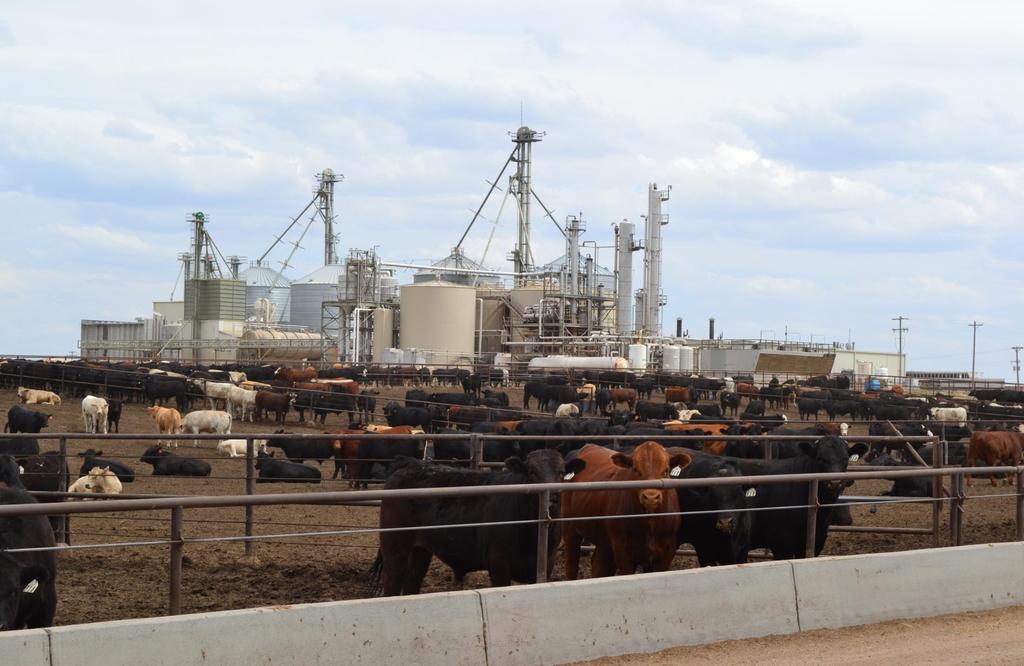
7 Feeders Biggest Beef with DDGS

8 Moisture Fiber Granulation Color Flowability Fat Protein Residual Starch Residual Sugar Sulfur

9 Room for Improvement Average Std. Deviation % Dry Matter % Crude Protein % Crude Fiber % Starch % Crude Fat % Ash % Sulfur Excepted from Dairy One Lab DISTILLERS GRAINS Accumulated crop years: 05/01/2000 through 04/30/2011
10 Composition (%) 50 DDG(S) Composition Variability by Year % Crude Protein Year Summarized from Dairy One Lab DISTILLERS GRAINS Accumulated crop years: 05/01/2000 through 04/30/2014
11 Composition (%) 1.5 DDG(S) Composition Variability by Year % Sulfur 0 Year Summarized from Dairy One Lab DISTILLERS GRAINS Accumulated crop years: 05/01/2000 through 04/30/2014
12 Composition (%) 15 DDG(S) Composition Variability by Year % Starch Year Summarized from Dairy One Lab DISTILLERS GRAINS Accumulated crop years: 05/01/2000 through 04/30/2014
13 Composition (%) 20 DDG(S) Composition Variability by Year % Crude Fat 5 Year Summarized from Dairy One Lab DISTILLERS GRAINS Accumulated crop years: 05/01/2000 through 04/30/2014

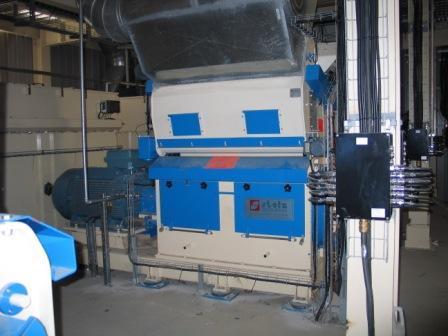
14 Purpose of Dryhouse Remove water that was added into the process Produce high quality animal feed
15 PROCESS WATER RECYCLE BACKSET RECYCLE GRAIN UNLOADING & STORAGE GRAIN MEAL MASH MILLING MASHING/COOKING LIQUEFACTION MASH MFGE MFGE STORAGE DENATURING & LOADOUT DEHYDRATION DISTILLATION BEER SACCHARIFICATION & FERMENTATION CO 2 CO 2 RECOVERY WHOLE STILLAGE THIN STILLAGE DDGS DDGS STORAGE/ LOADING DRYING WDGS WDG CENTRIFUGATION EVAPORATION EVAPORATOR CONDENSATE NAT. GAS COOLING WATER AIR SYRUP FRESH WATER STEAM UTILITIES UTILITIES ELECTRIC

16 Consistent High Quality is Achievable Average Std. Deviation % Dry Matter % Crude Protein % Crude Fiber % Starch % Crude Fat % Ash % Sulfur


17 You Get Out What You Put In INPUTS Grain Fiber Proteins Fat Starch Contaminants Water Enzymes Nutrient Addition Chemical Additions for: Sanitation ph adjustment Bacterial Control Emissions Control Fouling Control Operation s Input


18 Whatever You Put in is Concentrated 3-Fold in the DDGS 1/3 1/3 1/3


19 What Goes into the DDGS Depends on Plant Design Milling Piping Design for Sanitation Equipment Design for Sanitation Instrument Automation Adequate Cooling Water Systems Dryer Design and Sizing Criteria DDGS Handling and Storage


20 Consistency is Key Milling
21 Consistency is Key Piping and Equipment Design for Sanitation Minimizes Chemical Inputs Contributes to Reduction or Elimination of Sulfur Addition Minimizes Caustic Consumption Minimizes Sanitation Chemical Usage Contributes to Elimination of Antibiotic Usage


22 Piping and Equipment Design for Sanitation No Dead Legs


23 Piping and Equipment Design for Sanitation Welding Keep it Smooth


24 Piping and Equipment Design for Sanitation Bio-Focused Design for Piping and Equipment


25 Piping and Equipment Design for Sanitation Bio-Focused Design for Equipment


26 Piping and Equipment Design for Sanitation Bio-Focused Design for Equipment

27 Consistency is Key Automated Processes = Consistent Products Fermenter Fill Yeast Slurry Tank Transfer Mash Cooler Train CIP Yeast Slurry Tank CIP Yeast Slurry Tank Fill Fermenter Transfer Fermenter CIP


28 Adequate Cooling Systems Temperature Maintenance in Fermentation No Stuck Fermenters Minimize Residual Sugar Decrease Infection Potential

29 Dryhouse Design and Sizing Criteria Solids / Liquid Separation Enough Units for Proper Separation Spare Capacity May be Necessary for Consistency

30 Dryhouse Design and Sizing Criteria Dryer Size Matters Affects Temperature Necessary to Dry Influences Protein Degradation Influences Volatile Emissions Influences Product Color DDGS Cooling Must be Properly Sized Avoid Bridging Avoid Spontaneous Combustion

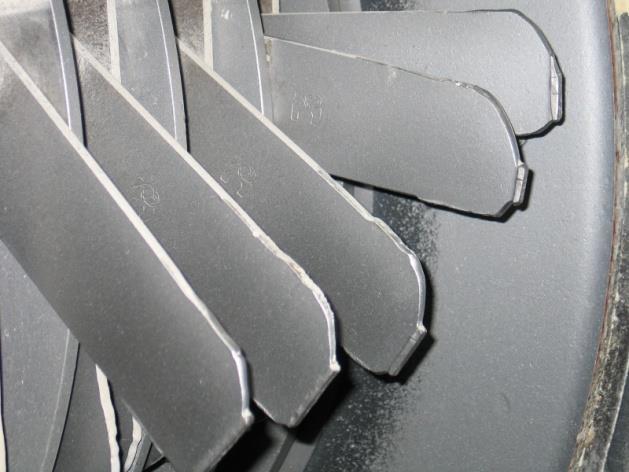
31 DDGS Handling Improper Cooling Leads to Product Bridging


32 DDGS Handling and Storage
33 Design Operations Consistent High-Quality Products

34 What You Put in Also Depends on Plant Operations Backset Sanitation Fermentation Management Chemical Additions
35 Backset Considerations Backset Decreases Fresh Water Input to Plant Amount of Backset Can Affect Viscosity Backset Affects Necessity for Chemicals for ph Control Amount of Backset Increases Potential for Recycling Contamination and Infection Increasing Backset, Increases Non-Fermentable Solids Recycled and Affects Evaporator Performance

36 Make Taking Shortcuts in Sanitation Maintain Schedules Monitor Sanitation Chemical Concentrations and Inventories Importance of Shift Uniformity and SOP Maintenance Unacceptable
37 Laboratory The Lab is the Eyes of the Plant. Without Consistent Lab Sampling and Recording, You are Operating Blind.

38 Consistent Fermentation Monitoring Establish Baseline Repeatable Results Shift Uniformity
 Sulfamic Acid (cleaning) Caustic (cleaning) Water Quality (sulfer,")
39 Process Control with Chemicals Affects Coproduct Quality Sodium Bisulfite or Ammonium Bisulfite Sulfuric Acid (ph control or cleaning) Sulfamic Acid (cleaning) Caustic (cleaning) Water Quality (sulfer, minerals)


40 Inadequate Starch Conversion Poor Yeast Management Poor Fermentation Management Non-Sanitary Operations Inadequate Product Recovery Yield Killers
41 How Much Does Deceased Yield Really Cost?
42 Tangible Costs of Decreased Yield 1. Using more grain per liter of ethanol produced 2. Increased Energy Consumption

43 Realtive Production Yield, Production & Energy Relationship DDGS Ethanol Relative Ethanol Yield Decreased Yield = Decreased Ethanol = Increased DDGS = Increased Drying Energy
44 Process Efficiency 97% 96% 95% 94% 93% 92% Ethanol Yield (L/MT corn) Feedstock-Corn (MT/day) 1,408 1,422 1,437 1,452 1,467 1,483 Additional DDGS Produced (MT/day) Additional Feedstock Cost (US$/day) $(1,940) $(3,931) $(5,955) $(8,022) $(10,092) $(12,246) Revenue from Additional DDGS (US$/day) $1,710 $2,961 $4,233 $5,489 $6,759 $8,126 Energy Cost for Extra Drying (US$/day) $(391) $(678) $(969) $(1,256) $(1,547) $(1,859) Total Yearly Loss from Yield (US$/year) $(217,298) $(576,343) $(941,592) $(1,325,932) $(1,707,628) $(2,092,871) Base Yield of 410 L/MT and 98% Process Efficiency for Comparison 200,000,000 Liter per Year Ethanol Plant

45 Is DDGS Undervalued
46
47

48 Thank You for Your Attention