PM2.5 Designations: Evaluating Contribution of Multiple Pollutants Using the Weighted Emissions Score
|
|
|
- Elisabeth Bishop
- 5 years ago
- Views:
Transcription

1 PM2.5 Designations: Evaluating Contribution of Multiple Pollutants Using the Weighted Emissions Score Discussion with STAPPA/ALAPCO May 5, 2004
2 Timeline for PM2.5 Implementation Program Action Date States/Tribes recommend designations Feb EPA responds with letters describing intended modifications June 15, 2004 EPA proposes implementation rule July 2004 EPA finalizes designations Nov. 17, 2004 Effective date of PM2.5 designations Feb EPA finalizes implementation rule March 2005 State/Tribal plans due Feb. 2008* Attainment dates * Regional haze SIPs will be due at the same time that PM2.5 SIPs are due.
3 What is a nonattainment area? Section 107(d)(1)(A)(I): any area that does not meet (or that contributes to ambient air quality in a nearby area that does not meet) the national primary or secondary ambient air quality standard for the pollutant. Includes areas with violating monitors AND areas contributing to the problem
4 PM2.5 Designations 9 Factors Emissions in areas potentially included versus excluded from the nonattainment area Air quality in potentially included versus excluded areas Population density and degree of urbanization including commercial development in included versus excluded areas Traffic and commuting patterns Expected growth (including extent, pattern and rate of growth) Meteorology (weather/transport patterns) Geography/topography (mountain ranges or other air basin boundaries) Jurisdictional boundaries (e.g., counties, air districts, Reservations, etc.) Level of control of emission sources
5 PM2.5 Designations Differences from Ozone Guidance Five main pollutants: direct PM (carbon, crustal material), SO2, and ammonia in addition to NOx and VOC PM2.5 is a year-round standard. Thus, contributions to nonattainment occur in all seasons and from many directions, not necessarily under one predominant wind direction. PM2.5 guidance did not include a factor taking specifically identifying future regional emissions reduction strategies Possible use of source apportionment studies using speciated data, or interpolated air quality data
6 State Recommendations for PM2.5 Designations Summary 116 NA counties 8 partial NA counties 21 counties in OH and MD recommended as NA in options under consideration Total population of these 145 counties = 82 million Presumptive metro areas associated with these counties ~300 counties with 105 million population Website:
7 State Recommendations for Fine Particle National Ambient Air Quality Standards
 Reasonably available control technology (RACT) Reasonable further progress (RFP) New source review Transportation")
8 Implications of Nonattainment Designation Subpart 1 Requirements (basic provisions) Attain as expeditiously as practicable (by 2010, extension to 2015 is possible) Attainment demonstration Reasonably available control measures (RACM) Reasonably available control technology (RACT) Reasonable further progress (RFP) New source review Transportation Conformity
9 Overall Approach to Evaluating Potential Nonattainment Counties We will consider all 9 PM2.5 factors in our analysis Initial focus on air quality and emissions We have developed a weighted emissions score to take multiple PM2.5 pollutants into account Then a review of the other 7 factors will be taken into account
10 Evaluating Emissions Contributing to PM2.5 Nonattainment Problems Issue: How do we compare county emissions when there are multiple pollutants (direct and precursor) which together contribute to PM2.5 concentrations? RO and HQ work group developed the weighted emissions score Also known as the local emissions score, or Lscore
11 Assumptions Nonattainment problems are caused by a combination of regional and local emissions For purpose of designations, focus on counties within the metro area (1999 and 2003 definitions) and counties adjacent to metro areas For purpose of developing weighted emissions metric, focus on SO2, NOx, direct carbon, and direct crustal emissions Ammonia and VOC emissions not directly included in metric, but can be taken into account in overall analysis

12 Atlanta Example Emissions by County
13 Atlanta Urban Excess Urban monitor Regional monitor Urban excess 18.0 ug/m ug/m3 3.8 ug/m3 Pollutant Percent of Urban Excess Concentration Sulfate 10% 0.4 Nitrate 3% 0.1 Carbon 88% 3.3 Crustal 0% 0.0 Total 3.8
14 Weighted Emissions Score = [(County SO2 tons / CMSA SO2 tons) * (% sulfate of urban excess PM2.5)] + [(County NOx tons / CMSA NOx tons) * (% nitrate of urban excess PM2.5)] + [(County carbon tons / CMSA carbon tons) * (% carbon of urban excess PM2.5)] + [(County crustal PM tons / CMSA crustal PM tons) * (% crustal of urban excess PM2.5)]
15 Example: Bartow County Weighted emissions score = [(154,447 SO2 tons / 244,423 CMSA SO2 tons) * (sulfate 10% of urban excess PM2.5)] + [(43,326 NOx tons / 258,240 CMSA NOx tons) * (nitrate 3% of urban excess PM2.5)] + [(1621 carbon tons / 24,642 CMSA carbon tons) * (carbon 88% of urban excess PM2.5)] + [(5174 crustal PM tons / 27,025 CMSA crustal PM tons) * (crustal 0% of urban excess PM2.5)] = =.125 = 12.5 score

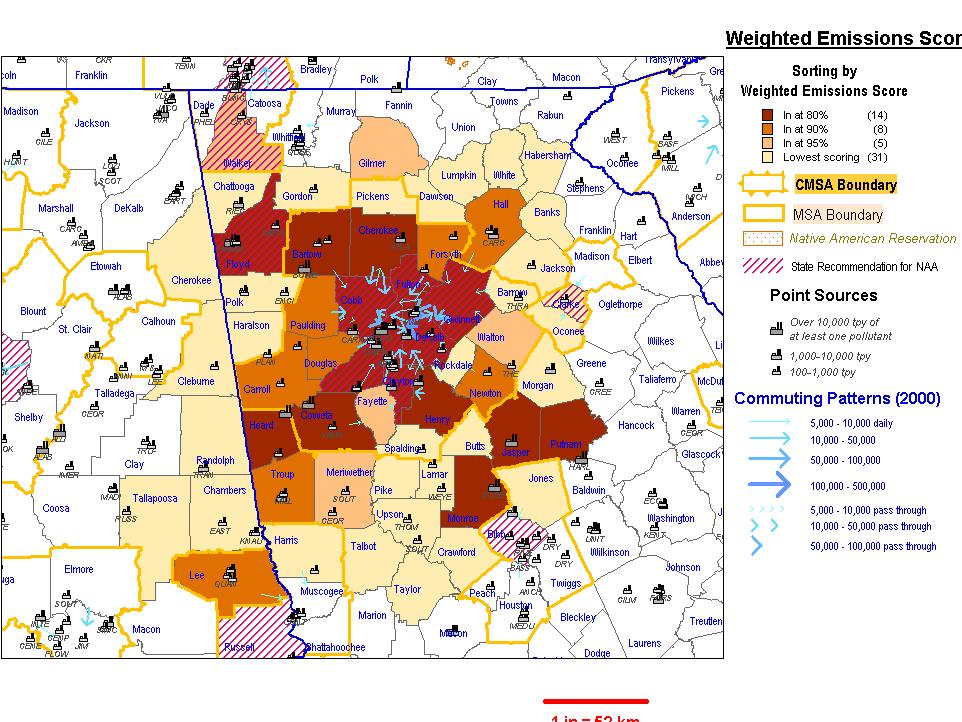
16 Atlanta Weighted Emissions Scores by County
17 THE CUMULATIVE WEIGHTED EMISSIONS SCORE CAN BE USED TO IDENTIFY POSSIBLE GUIDELINE LEVELS FOR INCLUDING COUNTIES IN THE CMSA AND/OR FOR INCLUDING ADJACENT COUNTIES E.G. 80%, 90%, 95%
18