Definition Recurrence Interval. The 100 year flood--what it means. Sacramento flooding issues Flood control methods
|
|
|
- Sara Owen
- 5 years ago
- Views:
Transcription

1 Definition Recurrence Interval The 100 year flood--what it means Sacramento flooding issues Flood control methods


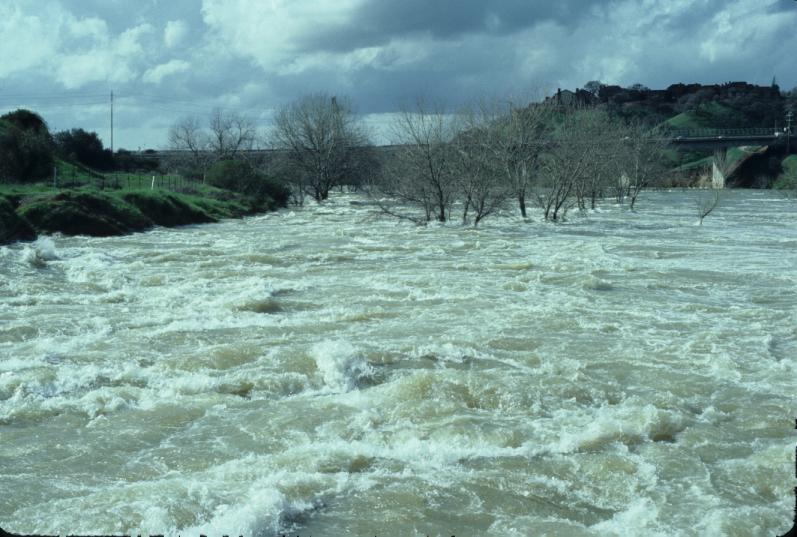
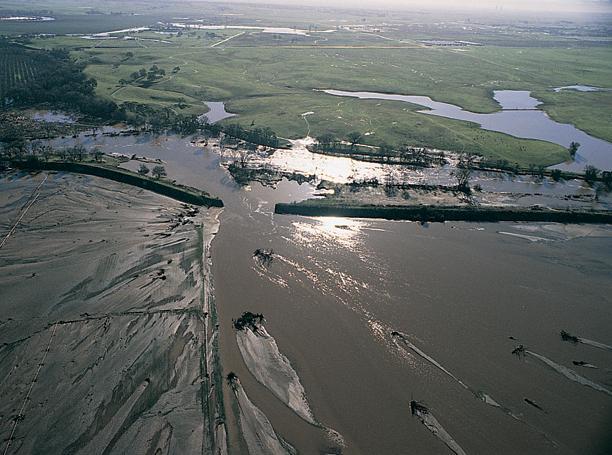
2 Occurs when water overtops a stream s banks and spills out onto the flood plain.


3 s/sw

4 Discharge, cfs California Stream Hydrograph Why Not January 1 through Dec 31? 0 1/1 2/20 4/10 5/30 7/19 9/7 10/27 12/16 Date
, in each year of record http://waterdata.usgs.")
5 Annual Peak discharges: maximum momentary peak discharge (Q), in cubic feet/second (cfs), in each year of record
6 Peak Q Annual flood series: a list of annual floods Station : Peak discharge Water Year

7 We need a measure of flooding for which we can associate a probability. If we use the maximum instantaneous streamflow during an annual period, we can determine an annual exceedance probability.
 annual peak flows on a stream, can we")
 recorded values to say something about")
 to have an annual peak bigger than")
8 If we have a record of 10 (or 50 or 100 or..) annual peak flows on a stream, can we use those 10 (or 50 or 100 or..) recorded values to say something about how likely it will be next year (or any year) to have an annual peak bigger than the largest recorded value?
9 Year Discharge (cfs) , USGS site: N Yuba R Bl Goodyears Bar, CA , ,200
10 Year Discharge (cfs) Rank , , , Hydrologists list the discharges in descending order and rank them
11 Discharge (cfs) Rank Probability of Exceedance 27, , , Next we need to find the probability that in any given year the instantaneous discharge will exceed the recorded discharge value
12 Discharge (cfs) Rank Probability of Exceedance 27, /9= 11% 15, /9= 22% 10, /9= 33% /9= 44% /9= 56% Are these probabilities realistic? /9= 67% /9= 78% /9= 89% /9= 100%
13 Discharge (cfs) Rank Probability: (rank/ (n+1)) 27, /10= , /10= , /10= /10= /10= 0.5 More realistic-- method used by Hydrologists /10= /10= /10= /10=0.9
14 Probability: (rank/ (n+1)) Recurrence Interval (R=1/ P) in years 1/10= 0.1 1/ 0.1 = 10 2/10= 0.2 1/ 0.2 = 5 3/10= 0.3 1/ 0.3 = 3.3 4/10= 0.4 1/ 0.4 = 2.5 5/10= 0.5 1/ 0.5 = 2.0 6/10= 0.6 1/ 0.6 = 1.7 7/10= 0.7 1/ 0.7 = 1.4 Use your calculator to find the recurrence interval, or can rearrange the recurrence interval equation to: R= (n+1)/m where m= rank 8/10= 0.8 1/ 0.8 = 1.3 9/10=0.9 1/ 0.9 = 1.1
15 Discharge, cubic feet per second N YUBA R BL GOODYEARS BAR, CA 100,000 10,000 ANNUAL PEAK DISCHARGE Recorded 1, Recurrence interval, years Annual peak Q values plotted on lognormal probability paper
16 Discharge, cubic feet per second N YUBA R BL GOODYEARS BAR, CA 100,000 10,000 ANNUAL PEAK DISCHARGE Recorded Best Fit Line 1, Recurrence interval, years
17 Discharge, cubic feet per second N YUBA R BL GOODYEARS BAR, CA 100,000 Extraploated 100 Year Discharge 10,000 ANNUAL PEAK DISCHARGE Recorded Best Fit Line 1, Recurrence interval, years
18 Discharge, cubic feet per second N YUBA R BL GOODYEARS BAR, CA 100,000 Extraploated 100 Year Discharge 10,000 ANNUAL PEAK DISCHARGE Recorded Log Pearson Distribution Best Fit Line 1, Recurrence interval, years

19 Limitations: Extrapolating too far past the data; USGS rule of thumb don t extrapolate past twice the record length Not using the appropriate scales to plot probabilities and recurrence intervals Sometimes other probability methods may be more appropriate

20 R n m 1

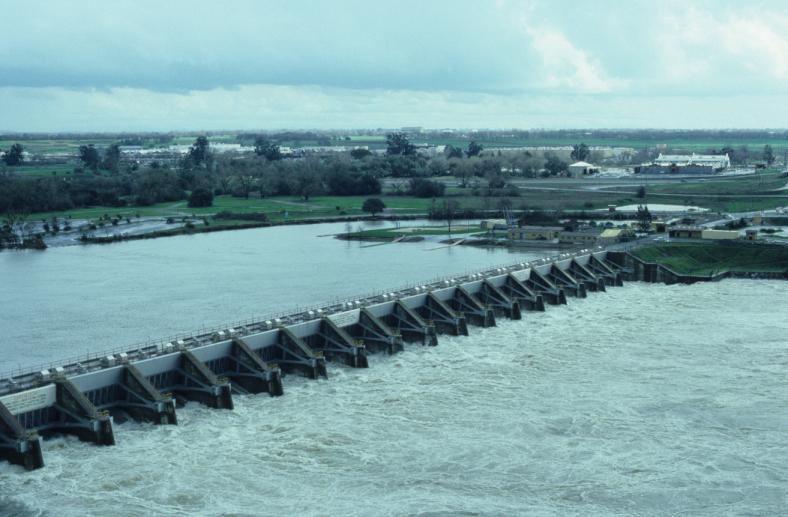
21 Store lots of water at high elevation Drain water quickly Into flat area with a single, narrow outlet


22

23


24

25 Flood of 1862
26 inches rain in 11 days Folsom Lake exceeds designed capacity Record releases from Folsom Dam Folsom Dam protection downgraded to about 70 year flood 1997 Record Flow Rates Sacramento spared from flooding Modesto hit hard

27


28
29

30 Paving increases amount and rate of surface runoff

31

32 Sacramento Feather Yuba American Consumnes Mulkemne Stoney Cr. Cache Cr.


33 Dams upstream 26 dams Levees River bypasses Hold 75% of Sac. River Water during floods

34

35


36

37 Auburn Dam Proposed in 1960s Environmental opposition Recently active fault mapped at dam site Raise and strengthen levees Raise Folsom Dam Increase spillways on Folsom Dam

38 Auburn Dam Proposed in 1950s Environmental opposition Raise and strengthen levees Raise Folsom Dam Increase spillways on Folsom Dam

39 1999 US Congress Appropriated funds to improve Folsom Dam 2000 Sacramento voters approved an increase in property taxes to improve flood control


40 July 17 Drained 40% of Folsom Lake 40,000 cfs $20 M repair cost Fresh water in SF Bay Salmon and Bass fooled into beginning fall migration