Where IS the best place to grow greenhouse crops in Australia? Facilitated by GRAEME SMITH CONSULTING.
|
|
|
- Zoe Moore
- 5 years ago
- Views:
Transcription

1 Where IS the best place to grow greenhouse crops in Australia Facilitated by GRAEME SMITH CONSULTING
2 CRITICAL FACTORS Compare 8 Australian Capital Cities (,,, Darwin,,,, ) What tools needed for a fair assessment Outcomes are: tools to develop a business plan; or an improved understanding of your own situation Knowledge of some critical factors in protected cropping Grading Matrix
3 Darwin Lat 12.4 Lat 27.4 Lat 31.9 Lat 34.9 Lat 33.9 Lat 35.3 Lat 37.8 Lat 42.9
4 CRITICAL FACTORS (for the 8 Australian Capital Cities) Climate radiation temperature (Production Potential!) rh wind Water / Rain Energy Freight Market Strength & Access Labour Local/State Government Support Food Miles Lifestyle
5 CLIMATE - Radiation The sun drives all the planets (& greenhouse) processes Radiation (sunlight) levels are directly proportional to production potential Crops can suffer from too much as well as too little radiation (daily & annual basis) Most greenhouse set-points can be linked to radiation levels (or sum)


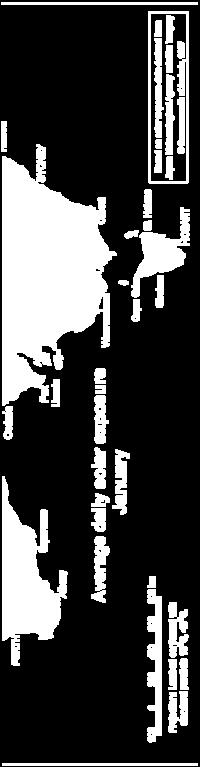
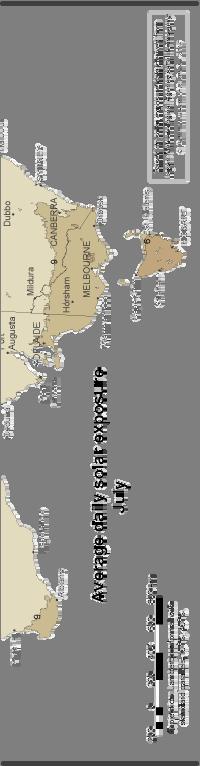
6 CLIMATE - Radiation Average Daily Solar Radiation January July
7 CLIMATE - Radiation Mean No. of Cloudy Days Jan Feb Mar Apr May Jun Jul Aug Sep Oct Nov Dec Darwin Mean Daily Sunshine Hours Jan Feb Mar Apr May Jun Jul Aug Sep Oct Nov Dec Darwin
8 CLIMATE - Radiation Daily Radiation 30 MegaJoules/Sqm/Day Jan Feb Mar Apr May Jun Jul Aug Sep Oct Nov Dec Darwin Total Average Annual Radiation J/cm2/year 800, , , , , , , , ,000 Darwin
9 CLIMATE CLIMATE - Radiation Radiation Darwin Ann Dec Nov Oct Sep Aug Jul Jun May Apr Mar Feb Jan * Monthly summary for period M/Joules/m2/day* Radiation
10 CLIMATE - Temperature Crops respond to 24hour temperature averages (plant development) Ideally we should be measuring PLANT temperature ± 18 20ºC C is optimum photosynthesis (growth) rate for most crops (day temp!)

11 CLIMATE - Temperature
12 CLIMATE - Temperature Mean Daily 24 Hour Average Temperature Deg C Jan Feb M ar Apr M ay Jun Jul Aug Sep Oct Nov Dec Darwin Jan Feb Mar Apr May Jun Jul Aug Sep Oct Nov Dec Ann Darwin
13 CLIMATE Humidity (rh) Ideally we should be aiming for ± 60 80% greenhouse humidity (±( 3 7gm/m³ HD) Greenhouse humidity is influenced by external climate (radiation, temp, rh, wind, etc) High humidity slows transpiration (costs energy to drive with heat) Low humidity increases transpiration (every 1% below 50%, increases transpiration rate 1.5 times)
14 CLIMATE Humidity (rh) Mean 9am Relative Humidity 90 % Darwin 40 Jan Feb Mar Apr May Jun Jul Aug Sep Oct Nov Dec Mean 3pm Relative Humidity 80 % Darwin 30 Jan Feb Mar Apr May Jun Jul Aug Sep Oct Nov Dec
15 CLIMATE - Wind Wind speed and direction influences greenhouse climate and orientation (e.g. wind speed >m/s greatly affects CO ² efficiency related to light levels) Improved ventilation related to greenhouse alignment Physical affect on ventilators (eg. ageing)
16 CLIMATE Wind Roses (e.g. ) 9am 3pm (nb. km/h to m/s, divide by 3.6)
17 Production Potential Production Potential can be modelled using TomSim (Tomato Simulator) TomSim models using unique site data: average daily radiation levels average 24hour temperature greenhouse CO ² levels growth period (days) Tomsim.exe

18 Production Potential - TomSim Tomsim.exe
19 Production Potential - TomSim CO2 Level 350ppm ppm Potential Production (@ Varied CO2 Levels & Average 24hr Temp) Darwin kg/m2 (Tomsim) ppm 600ppm Darwin
20 CLIMATE Water / Rain Harvestable water off roof (average annual rainfall) assume 0% capture & retain Plant transpiration & drainage assume 3ml per Joule light over 350 days
21 CLIMATE Water / Rain Ann Rainfall (mm) Harvestable Water (M1/ha) Annual Radiation (J/cm2) Typical Water Use (Ml/ha) % of Water Needs Supplied % Water Needs at 40% Recirc , % 79% , % 79% , % 56% 1, , % 123% Darwin , % 70% , % 57% , % 61% 1, , % 116%
22 CLIMATE Water / Rain megalitres/ha Harvestable Rain W ater (assume average annual rainfall) Darw in 140% 120% 0% 80% 60% 40% 20% 0% % of Water Needs Supplied % Water Needs at 40% Recirc Darwin
23 ENERGY Energy demand is a function of climate (internal & external), crop and stage Rule of Thumb for each ºC C difference between external 24hr temp & target greenhouse temp = 5m³ natural gas consumed (e.g. external average temp = ºC, target G/H temp = 20ºC, Difference = ºC x 5 = 50³m m natural gas) Assume average natural gas price = $9.80/gJ energy & 1m³ natural gas = 38.8mJ energy Assume target average G/H 24hour temp = 20ºC
24 ENERGY Mean Annual Energy Requirements 16,000 gj/year 14,000 12,000,000 8,000 6,000 4,000 2,000 0 Darwin
25 ENERGY Mean Monthly Energy Requirement 35% % 30% 25% 20% 15% % 5% Darwin 0% Jan Feb Mar Apr May Jun Jul Aug Sep Oct Nov Dec
26 ENERGY Annual Energy $/Ha (assume natural gas = $9.80/gJ) $160,000 $140,000 $120,000 $0,000 $80,000 $60,000 $40,000 $20,000 $0 Darwin
27 FREIGHT & MARKET STRENGTH Costs relatively same to each local market Arguably the strongest markets would be: (based on population, supply/demand, etc) Other market destinations would bear significant costs
28 FREIGHT COSTS (nb.. Not including GST or fuel Levy) Pallet Rate in $ TO Darwin n/a $170 $160 $240 $275 $75 $250 $150 $150 n/a $140 $290 $365 $5 $450 $95 $185 $170 n/a $495 $3 $80 $440 $75 FROM Darwin $190 $2 $340 n/a $480 $220 $3 $360 $215 $250 $150 $470 n/a $95 $400 $140 $95 $165 $0 $4 $200 n/a $375 $95 $130 $260 $250 $460 $350 $170 n/a $190 $165 $140 $95 $490 $295 $95 $4 n/a SCT Logistics
29 LABOUR access relatively same to each local market Strong need to plan early your labour needs for future enterprise development Each new stage may strain a depleting market
30 MUNICIPAL/STATE SUPPORT Early signs that some areas are actively discouraging protected cropping development (e.g. & ) Strong need to plan early your permit needs for future enterprise development
31 FOOD MILES a potential indicator for the environmental impact of the food and its components not only how far the food has traveled but how it has traveled how the food has been produced and what energy is used in its production Carbon imprints, carbon tax & credits Opportunity to produce local foods
32 LIFESTYLE Are we content in this location Do suitable services, facilities & infrastructure exist for happy, healthy & productive situation Are we willing to forgo potential production or $ advantages for a selected location
33 GRADING MATRIX ADELAIDE BRISBANE CANBERRA DARWIN HOBART MELBOURNE PERTH SYDNEY Production Potential Energy Water/Rain Freight Market Strength Labour Access Municipal Support Food Miles Lifestyle totals
34 GRADING MATRIX ADELAIDE BRISBANE CANBERRA DARWIN HOBART MELBOURNE PERTH SYDNEY Production Potential Energy Water/Rain Freight Market Strength Labour Access Municipal Support Food Miles Lifestyle totals
35 GRADING MATRIX ADELAIDE BRISBANE CANBERRA DARWIN HOBART MELBOURNE PERTH SYDNEY Production Potential Energy Water/Rain Freight Market Strength Labour Access Municipal Support Food Miles Lifestyle totals
36 GRADING MATRIX GRADING MATRIX totals Lifestyle Food Miles Municipal Support Labour Access Market Strength Freight Water/Rain Energy Production Potential SYDNEY PERTH MELBOURNE HOBART DARWIN CANBERRA BRISBANE ADELAIDE
37 GRADING MATRIX GRADING MATRIX totals Lifestyle Food Miles 5 5 Municipal Support Labour Access Market Strength Freight Water/Rain Energy Production Potential SYDNEY PERTH MELBOURNE HOBART DARWIN CANBERRA BRISBANE ADELAIDE
38 GRADING MATRIX THE BEST PLACE TO GROW GREENHOUSE CROPS IN AUSTRALIA IS
39 Thank You. Questions