Landscape Scale Response to Climate Change : A Biogeochemical Perspective
|
|
|
- Josephine Waters
- 5 years ago
- Views:
Transcription


1 Landscape Scale Response to Climate Change : A Biogeochemical Perspective Susan Newman 1, William Orem 2,Todd Z. Osborne 3, K. Ramesh Reddy 1 Everglades Systems Assessment Section, South Florida Water Management District, West Palm Beach, FL 2 US Geological Survey, Reston, VA 3 Wetland Biogeochemistry Laboratory, University of Florida, Gainesville, FL


2 Presentation Objectives Present interpretations of modeling results relative to biogeochemical properties of Greater Everglades Focus on C, N, P, S, and Hg in ecosystem compartments Overview of key findings Discuss challenges / decisions facing future landscape scale interpretations


3 Rationale Big picture perspective Identify regional impacts hot spots = areas of concern Identify trends at ecosystem scale Assess of gaps in current understanding of the system ENP
4 Approach and Assumptions Greater Everglades divided into hydrologic units, key zones within each unit highlighted (overdrained, good, ponded, enriched etc.) Climate change scenarios evaluated qualitatively ± 30 days hydroperiod change considered within realm of modelling error, ± 60 days significant effect on soil chemistry. Evaluation presented as,, 0,,. Used habitat hydroperiods from McVoy et al., 2011 to guide decisions re: accumulation and loss of different soils
5 Carbon Cycle UV CO 2 CH 4 CO 2 Decomposition/leaching Import Detritus Decomposition/leaching Microbial biomass DOC HCO 3 CaCO 3 Export Peat Microbial biomass DOC HCO 3 CH 4 Decomposition/leaching Modified from: K. R. Reddy, and R. Delaune 2008
6 0/ 0 0/ 0/ 0 0/ /0 0/ 0 0/ Baseline Condition Key differences between wet and dry years northern WCA1 and most of WCA2A and HL are experiencing peat oxidation during dry years, with peat accumulation during normal/wet years. P enriched areas have increased soil accretion, but also greater decomposition so less organic C. northern portions of WCA3A and most of 3B are experiencing peat oxidation during dry years, peat accumulation during normal/wet years during normal/wet years ENP has peat accumulation only in major sloughs (Shark River and Taylor) little peat accumulation in Rocky glades areas during wet years. Oxidation throughout during dry years. coastal areas little impacted by wet and dry years; some mangrove areas accrete peat Source: Reddy et al., 2005
7 0/ 0 /0 0 /0 10 % increase rainfall Key points overdrained areas of WCA1, WCA2A, WCA2B, HL, RTB, WCA3A and 3B get more water promoting peat accretion; other areas maintain peat accretiondependent on ponding depth uncertainty. dry years still see shorter hydroperiods in overdrained areas and potential peat loss. increased freshwater flow down Shark/Taylor Sloughs widens sloughs and promotes peat accumulation; mutes seawater intrusion and peat erosion. Source: Reddy et al., 2005
8 % decrease in rainfall or 10 % increase in ET 0 Key points between wet and dry years 0 0 narrowing of slough WCA1, WCA2A&B, HL, and WCA3A&B all are significantly drier under dry year condition leading to peat oxidation. ENP at end of the water flow pipeline will experience significant drying, narrowing of Shark and Taylor sloughs, peat oxidation and absence of marl deposition in marl prairies; intrusion of saltwater up Shark Slough will result from SLR and decreased freshwater flow, erosion of coastal peat Source: Reddy et al., 2005
9 0/ 0/ 10 % decrease rainfall increase ET Key points northern & central peatlands are overly dry even in wet years ENP narrowing of Shark/Taylor Sloughs; peat loss outside of center slough narrowing of slough dry years are catastrophic with limited water throughout and systemwide peat loss; likely greater fire frequency saltwater intrusion; initial peat tidal erosion before mangrove peat established. Source: Reddy et al., 2005
10 Nitrogen Cycle UV Plant biomass N N 2 N 2 O (g) Nitrogen Fixation N 2 Litterfall NH 3 Volatilization NO 3 Nitrification NH 4 Organic N Mineralization. NH 4 Water Column NO 3 Denitrification N 2, N 2 O (g) [NH 4 ] s Plant uptake Organic N Peat accretion Microbial Biomass N [NH 4 ] s AEROBIC ANAEROBIC Adsorbed NH 4 Source: K. R. Reddy, and R. Delaune 2008

11 Baseline Effects of climate change scenarios Overall, strongly tied to C cycling, so systemwide responses are similar under the different scenarios. Key differences with C cycle most peat C originates from vascular plants while N is from Nfixation in cyanobacteria coastal zone N sourced from offshore Increased rainfall: Increased freshwater flow down Shark/Taylor Sloughs widens sloughs and enhances N fixation; freshwater mutes seawater intrusion and offshore N flux N Decreased water present: ENP narrowing of Shark/Taylor Sloughs; less wetland for Nfixing cyanobacteria Saltwater intrusion; increased N flux from offshore Source: Reddy et al., 2005
12 Phosphorus Cycle UV Runoff, Atmospheric Deposition Plant biomass P Litterfall Outflow DIP POP DOP DIP Periphyton P PIP AEROBIC DIP DOP POP Peat accretion DOP DIP Adsorbed IP [Fe, Al or Cabound P] PIP ANAEROBIC Source: K. R. Reddy, and R. Delaune 2008

13 Baseline Condition Key differences with climate change Increased rainfall may see increased P loads through structures, potentially greater fertilizer and particulate runoff increased flows increased P supplypotential for local nutrient loading excessive inundation leading to P release from more stable pools due to more acidic ph Decreased rainfall and/or increased ET increased overdrainage, conversion of organic to inorganic P internal eutrophication, greater P input due to soil loss upstream Source: Reddy et al., 2005
14 UV Plant BiomassS Sulfur Cycle Deposition SO 4 2 Runoff, Atmospheric Deposition Litterfall H 2 S DMS SO 4 2 Tidal Exchange OrgS Mineralization H 2 S DMS Oxidation S o Oxidation. SO 4 2 AEROBIC S 2 SO 4 2 Mineralization Reduction OrgS S 2 S o Reduction SO 4 2 Adsorbed SO 4 2 Me S FeS 2 Microbial BiomassS ANAEROBIC Source: K. R. Reddy, and R. Delaune 2008

15 Baseline Effects of climate change scenarios Overall, strongly tied to C cycling, so systemwide responses are similar under the different scenarios. Key differences are: Increased rainfall increased loading due to increased runoff from surrounding EAA and soil oxidation less oxidation of soils will result in H 2 S accumulation likely will result in small increases in atmospheric S loading. Source: Osborne et al., unpublished Decreased rainfall/increased ET oxidation induced S release is a significant risk in the water conservation area soils SLR and saltwater intrusion at coastextent of intrusion will be a function of balance between rate of C accumulation and rate of SLR
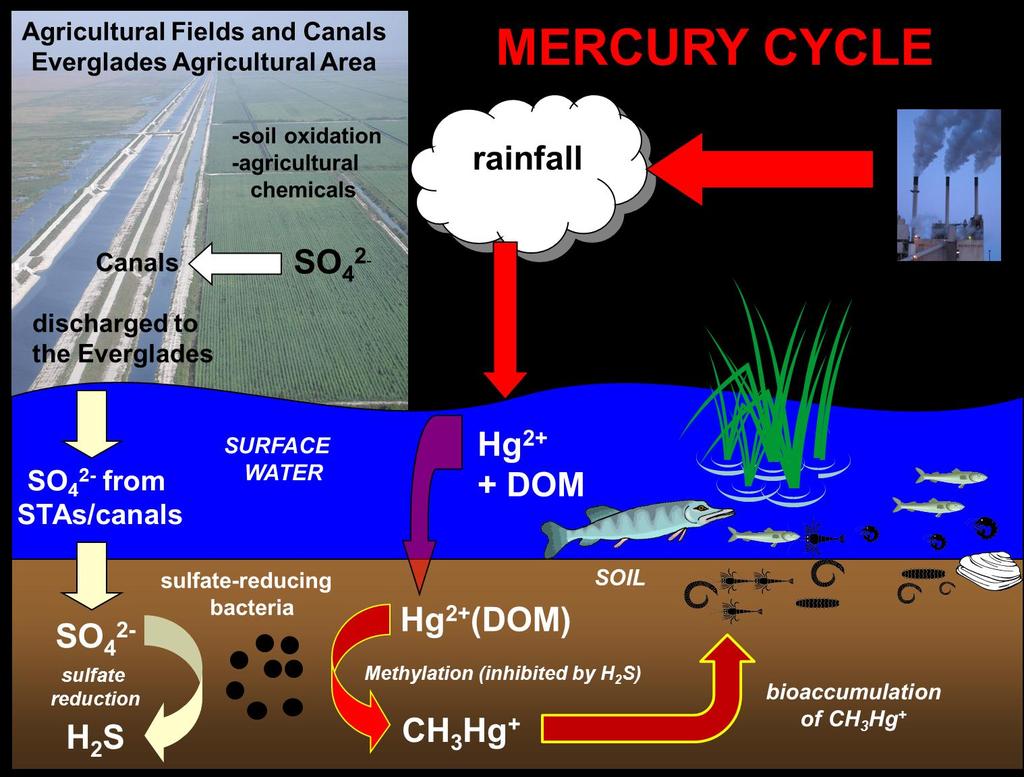
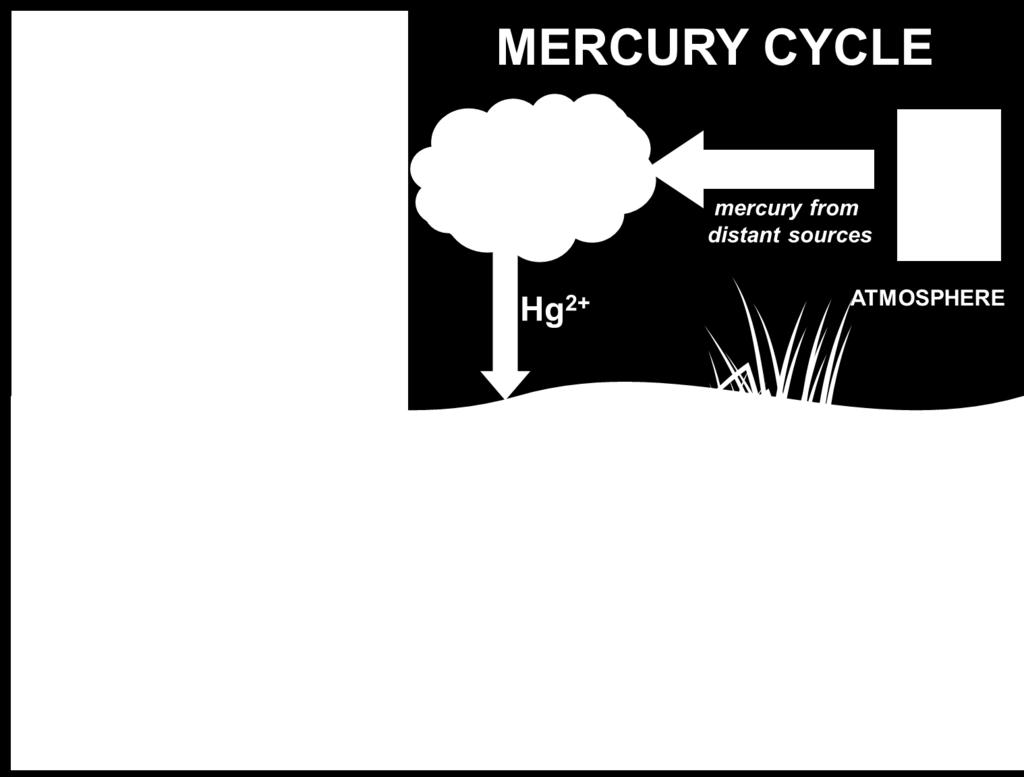
16

17 Baseline Increased rainfall larger area submerged and anoxic increase CH 3 Hg production greater Hg 2 deposition on Everglades increase CH 3 Hg production greater runoff of SO 4 2 from EAA increase CH 3 Hg production overall; but H 2 S buildup will cause inhibition of methylation in some regions especially in the north and near STA and canal discharges OVERALL IMPACT Decreased rainfall/increased ET more frequent drying events and organic soil oxidation and release of Hg 2 and SO 4 2 from soil increase CH 3 Hg production lower Hg 2 deposition on Everglades decrease in CH 3 Hg production lower runoff of SO 4 2 from EAA decrease in CH 3 Hg production overall smaller area submerged and anoxic decrease in CH 3 Hg production OVERALL IMPACT Source: Cohen et al., 2009
18 Effect of increased temperature Increased microbial activity increased decomposition increased growth rates and nutrient uptake increased CO 2 and CH 4 production increased rate of nitrification, denitrification and biological N 2 fixation increased rate of organic P and S mineralization increase CH 3 Hg production typically see higher rates of methylation in the summer than winter
19 Effect of increased CO 2 to 490 ppm Increased primary productivity C, N and P sequestration Increased microbial activity nitrification rate, denitrification, and biological N 2 fixation increased rate of nutrient release from soils Constraints In P limited areas, P limitation may constrain increased productivity, unless microbial activity sufficiently increased, and org P pools made available to remove P limitation
20 Uncertainties Water depth/duration that results in anaerobic processes outcompeting productivity At southern end of system, with RF scenario, difficult to assess what is ponding versus saltwater intrusion Seasonality of rainfall versus total rainfall; impacts of longer dry seasons under and RF scenarios To what extent fire frequency changes under the different scenarios Effects of increased CO 2 in P limited areas of the system Increased saltwater on the stability of organic matter Will increase SLR cause erosion of accumulated C due to tidal flux (increased DOC/DON load to Fl Bay), or increase C due to mangroves expanding northward
21 Research Suggestions Studies to test water depth/duration that results in anaerobic processes outcompeting productivity. Studies of optimum conditions for stimulating peat accumulation can peat growth be manipulated to keep up with SLR What are salinity limits for freshwater Everglades could salt/fresh mix augment water in Glades under dry scenario Relationships between the peat capillarity, water table and subsidencenumber of dry days to negate accretion
22 Research Suggestions Modeling Hg deposition under different rainfall scenarios Assessment of increased CO 2 on balance between productivity, microbial activity and P availability
23 Conclusions

24 Thank You Questions?