Hubbard Brook: An Overview of a World Renowned Ecological Research Site
|
|
|
- Mercy Bell
- 5 years ago
- Views:
Transcription

1 Hubbard Brook: An Overview of a World Renowned Ecological Research Site

2 Say Hubbard Brook to your average resident of central New Hampshire, and they will have no idea what you are talking about, but say Hubbard Brook to a group of ecological scientists any where across the country, and even around the world, and it is likely they will all know exactly what you are talking about and where it is located. This small valley located in Thornton, NH; is famous as the location for the scientific study of processes in forested ecosystems. Hubbard Brook Experimental Forest [External Link] was originally established in 1955 by the USDA Forest Service as a center for hydrologic research in New England. Precipitation monitoring stations, weather instrumentation, and weirs to allow monitoring of stream flow were initially installed on watersheds 1 3. Early research focused on the effects of forests on the water cycle, erosion, and water quality. In the early 1960 s, the Hubbard Brook Ecosystem Study involving manipulations of the small watersheds was begun between scientists with the Forest Service and researchers at Dartmouth College. Key personnel in the initial research were Dr. Robert Pierce who served as Project Leader for the US Forest Service from ; Dr. Herbert Bormann, a Botany Professor who had been bringing his students to tour Hubbard Brook, Dr. Gene Likens, a Professor in Biology; and Dr. Noye Johnson, a Professor of Geology. Today, the study has expanded to include researchers from over 40 colleges, universities, government agencies and other research institutions. Over 1400 scientific papers and eight books have been published about the research conducted at Hubbard Brook. For a list of current research projects visit the Hubbard Brook Ecosystem Study Current Research Projects page [External Link]. Ten of the sub watersheds within the Hubbard Brook Experimental Forest have been delineated and contain various monitoring sites. Some of these have been subjected to various experimental treatments, while others have been left alone to serve as reference watersheds (experimental controls). Six of the watersheds lying in the northern part of the watershed face south (#1 6). There are also three delineated

3 watersheds at the southern boundary that face north (#7 9). A tenth watershed (#101) lies near the center of the watershed, but also faces south. Watersheds 1 9 contain stream gauging stations to monitor water flow volume, while for watershed 101 water quality is monitored but not flow volume. Experimental treatments for the watersheds vary greatly. In watershed 1, the calcium content in the soil was increased to see the role it played in the base forest and aquatic ecosystems. This occurred in Watershed 2 was clear felled in the winter of and kept de vegetated for three years after that by applying herbicides to prevent re growth. Watershed 3 was left alone for hydrologic reference. Watershed 4 was strip cut in 1970, 1972, and 1974 to determine how progressive strip cutting affects nutrient and hydrological cycling. Watershed 5 had a whole tree harvest in 1962 resulting in the removal of biomass to determine the forest s reaction to the whole tree harvest. Watershed 6 was left alone to use it as a biogeochemical reference watershed. Watersheds 7 9 have been left alone. And the last watershed, watershed 101 was commercially logged in 1970 with the branches left on the site to study the effect of block clear cutting on watershed hydrology and nutrient flux and cycling. Stream ecosystem research started at Hubbard Brook in the mid 1960 s. Some of the experiments that were first used were long term studies on stream chemistry, temperature, and hydrology, surveys of invertebrate taxa, flux, cycling and mass balance approaches to element cycling, and manipulative experiments to examine stream processes. Many researchers compared the stream processes among forested and deforested watersheds. For further details on the history of stream research at Hubbard Brook visit the Stream Ecosystem Research page [External Link]. Three Dimensional (Hillshade) View of the Hubbard Book Valley

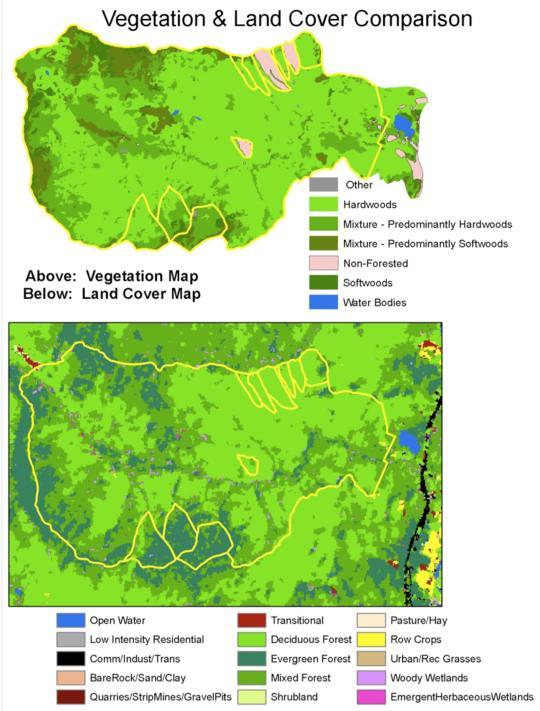
4 Schwarz Plots and Vegetation The Schwartz Plots are 500 meter squared circular plots established on transect lines across the whole Hubbard Brook Valley, excluding Watersheds #1 6. These were created as part of Paul Schwarz s dissertation research for his Ph.D. thesis from Cornell University (Spatial Patterns of Abundance of Northern Hardwood Conifer Species in a Forested Valley in the White Mountains, New Hampshire, USA). Fifteen separate transect lines spaced at 500 meter intervals, with plots located at intervals from 25 meters to several thousand meters stretch across the valley and provide permanent locations for vegetation and soil studies. This map shows those plots superimposed over the Vegetation data. From the metadata associated with the vegetation file, it appears the vegetation units were digitized from a paper copy of a map from It appears that the data was updated sometime after that, as three of the experimental watersheds are shown as non forested. The map below shows a comparison of the vegetation data pictured above to the National Land Cover Data set. This file was created as part of the National Land Cover Data project utilizing Landsat Thematic Mapper imagery from As you will note from the legend, an attempt has been made to match the colors for the two data sets as much as possible, given the different categories of data. As shown in the map below, and even more clearly in the larger view of the north facing watersheds, there are some similarities and some differences between the vegetation unit and land cover data in terms of the location and abundance of the various forest types. It would be interesting to do some ground truthing to determine which appears to more accurately represent the composition of the various watersheds today.
5

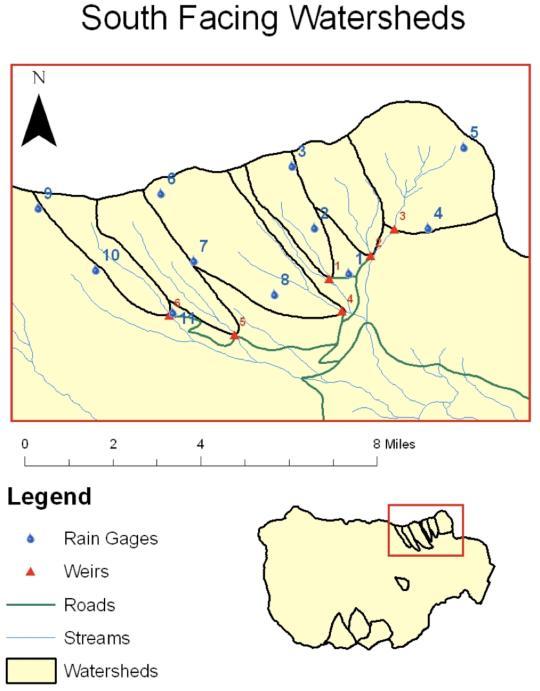
6 The maps below show larger scale views of the south and north facing watersheds. Watersheds 1 9 are each equipped with rain gages and weirs. The rain gages at Hubbard Brook are used to measure precipitation levels at daily and weekly intervals. There are 24 standard rain gages and 7 weighing recording rain gages. The standard gages accumulate water through out the period of a week, while the recording gages

7 chart information continually throughout the week giving more details about exactly when the precipitation events occurred. Together, each test helps to show the precipitation levels year round. In the winter months, the rain gages are charged with antifreeze and the funnels are removed so that snow samples can be collected. Weekly precipitation levels have been collected at Hubbard Brook since 1956, some of the longest running data of its kind. The weirs at Hubbard Brook are designed to intercept all the water flowing down a stream and so determine the total discharge from the delineated watershed above the weir. Each of the nine gauged watersheds contain a V notch weir, while watersheds 5 9 also contain a San Dimas flume to determine stream flow when the water overtops the V notch weirs. For further information on the structure and function of the weirs see What is a weir and how does it work? from the Hubbard Brook Forest Virtual Tour [External Link]. Experiments involving the weirs have been ongoing since 1956, and regular data has been collected since. North Facing Watersheds
8

9 Watershed 1: Calcium Studies The most recent watershed to receive an experimental treatment is watershed 1, which is the focus of calcium addition studies. One of the most recognized research findings to come out of the experiments at Hubbard Brook is a better understanding of the impacts of acid rain on an ecosystem and mechanisms by which acid rain acts. The objective of the watershed 1 manipulation of the Hubbard Brook Experimental Forest is to evaluate the role of the calcium supply in regulating the structure and function of base poor forest and aquatic ecosystems. It was hypothesized that the calcium addition would help neutralize some of the impacts of acid precipitation.

10 The calcium content of the soil was increased through the application of wollastonite. The application of 1.2 metric tonnes Ca/ha was intended to raise the saturation from 10% to 19%. 19% was thought to be the saturation percentage of Hubbard Brook 50 years ago. In addition to watershed one, a small destructive plot was created adjacent to watershed one, which was designed for treatment and eventual study. This was designed to be an area for destructive sampling without disturbing the environment in watershed one. On October the wollastonite application process started. One ton sacks were flown in by helicopter. On October 19 a total of 46 tons were applied to watershed one. 110 collectors were placed every 25m to collect samples and ensure even spreading of the pellets. Studies show that the application process was successful and even. High quality pellets prevented small particles from spreading through the air, and the prevailing winds from the west prevented the contamination of watershed 6. A photo essay showing the wollastonite addition can be found on the Hubbard Brook website [External Link]. Nupert Sites Nupert (nutrient perturbation) sites are located just west of watershed 6. In 1995 plots were created where Calcium (Ca) and Aluminum (Al) were being added to the soil. There were twelve plots total, some of which received calcium, others aluminum, and others serving as control plots. Numerous studies of the effects of these additions on various aspects of plant vegetation have been and are being conducted.

11 Another area of monitoring at Hubbard Brook is phenology. Phenology is the study of periodic plant and animal life cycle events and how they change over time. The information that is gathered by phenologists can be used to determine if there is a change in climate or a pattern over time. Hubbard Brook has several spots where they have gathered phenology data from leaves on certain trees since The types of trees they look at are sugar maples, yellow birches, and beech trees. One number is recorded every week from each tree at each location in spring and in autumn. They don t need to record numbers in summer or winter unless there is an insect attack or some other remarkable natural phenomenon. Trees are given numbers according to the condition of the leaves on a scale of 0 4. In the spring 0 represents the least leaf development and 4 represents full leaf development. In the fall, 4 represents full leaf development with little color change and 0 represents all leaves fallen from the tree.

12 Beginning in 1982, a series of sandbox experiments were conducted in an attempt to further understand the sources and role of nitrogen in the long term development of productive ecosystems. First at Pleasant View Farms, and later at a site in the field below the Pierce lab, lined boxes were created and filled with a substrate of local glacial sands with low nitrogen content. The sand boxes were then planted with various tree species and outlet drains allowed for hydrologic and nutrient monitoring of the output. This Community Atlas project has only touched on the variety and extent of the research conducted at Hubbard Brook Experimental Forest. It was completed as part of a service learning project by the Environmental Science class at Plymouth Regional High School, Plymouth, NH. For further information on the project, please visit the second Community Atlas project submitted by PRHS for the school year entitled GIS Mapping for Hubbard Brook Experimental Forest. Data Sources: Hubbard Brook GIS data files are used courtesy of the USDA Forest Service, Northeastern Research Station, Durham, NH GPS points for the Weirs, Rain Gages, and Nupert Plots are used courtesy of Chris Eager, Hubbard Brook Project Leader, USDA Forest Service, Northeastern Research Station, Durham, NH 2009 NAIP Imagery courtesy of US Department of Agriculture s Farm Service Agency.

13 Project Assistance: Amey Bailey, forest service technician at Hubbard Brook, devoted a great deal of time to working with our students to prepare maps and GIS files for the project. Geoff Wilson, Hubbard Brook Research Foundation technician, provided the students with a tour of Hubbard Brook as well as critiques of their maps. Don Buso, Institute of Ecosystem Studies technician; Chris Eager, Project Leader for the US Forest Service; and Adam Finkleman, graduate student at Plymouth State University s Center for the Environment all provided information utilized in the project. Rebecca Lilja, GIS specialist for the US Forest Service and Shane Bradt, Geospatial Extension Specialist at UNH Cooperative Extension also provided assistance and answered questions. A special thank you to all for your assistance, time, and patience! Looking Up the Valley Three dimensional view looking up the Hubbard Brook Valley (prepared with ESRI s ArcGIS Explorer).