Perspectives on the Nation s Ground- Water Availability. William M. Alley Sioux Falls October 30, 2007
|
|
|
- Samuel Arnold
- 5 years ago
- Views:
Transcription
1 Perspectives on the Nation s Ground- Water Availability William M. Alley Sioux Falls October 30, 2007


2 Principal Aquifers of the United States Source: Ground Water Atlas of the United States

3 20 aquifers account for 90% of total aquifer withdrawals (Maupin and Barber, 2005)

4 Long-term interest in ground-water monitoring The program should cover the water-bearing formations in all sections of the country; it should include beds with water-table conditions, deep artesian aquifers, and intermediate sources...this nationwide program should furnish a reliable basis for periodic inventories of the ground-water resources, in order that adequate provision may be made for our future water supplies. O.E. Meinzer, 1935

5

6 Ground-Water Reservoirs with Perennial Overdraft (Thomas, 1951)

7 Significant Cones of Depression (Thomas, 1951)

8 Water-Table or Artesian Water-Level Decline > 40 feet Source: 1983 National Water Summary

9 Artesian Well Woonsocket, SD Circa 1900

10 Artesian Well Lancaster, CA Circa 1920

11 Ground-Water Sustainability Source: DOI, Upper San Pedro Partnership
 X (Specific")
12 The Myth of Recoverable Ground Water in Storage Top of aquifer Volume of aquifer Bottom of aquifer Recoverable Ground Water = (Volume of aquifer) X (Specific yield)


13 Depletion of a small part of the total volume of water in storage can have large effects on surface water, water quality, and subsidence which become limiting factors to development. Houston, TX Upper San Pedro Basin, AZ Republican River Basin, CO, KS, NE Edwards Aquifer, TX
14 Land surface Water table Stream Height of water table above stream bottom Ground-water system Thickness below stream bottom


15 GW and SW: A single resource Tonight I m calling on Democrats and Republicans to pass legislation to protect our groundwater against withdrawals that significantly damage our rivers, lakes, wetlands, and springs. Governor James Doyle, 2004 Wisconsin State of the State address.

16 The time period and locations over which capture occurs depends on aquifer shape, hydraulic properties, and proximity of pumping to recharge and discharge features. Fillippone and Leake, 2005

17 Example of Simulated Streamflow Capture Leake, Hoffmann, and Dickinson, 2005

18 Water Availability & Water Quality Contamination from land surface Cross contamination in wells Contamination by surface water Naturally-occurring substances Saltwater intrusion Artificial recharge


19 Antelope Valley Subsidence Source: Galloway and others, 2003

 in April 1 snow-water content at western")

20 Water Availability & Climatic Change Less snow/more rain Knowles et al., 2006 Less spring snowpack Mote, 2003 TRENDS ( ) in April 1 snow-water content at western snow courses -2.2 std devs LESS as snowfall +1 std dev MORE as snowfall Mote, 2003 Spring snowmelt-onset dates Earlier snowmelt runoff Stewart et al., 2005

21 Importance of Long-Term Data

22 Predevelopment water-level observations are needed to estimate ground-water depletion
23 Without consistently measured water levels, intermediate information on the ground-water system is incomplete Site ID: Well Name: D DAD1 Longitude: Latitude: Altitude of Land Surface: 1212 [ft AMSL] Well Depth: 404 [ft] USGS data ADWR* data 0 50 Site ID: Well Name: D DDD Longitude: Latitude: Altitude of Land Surface: 1200 [ft AMSL] Well Depth: 385 [ft] USGS data ADWR* data Depth to Ground Water Below LSD [feet] Depth to Ground Water Below LSD [feet] Dec-26 Dec-31 Dec-36 Dec-41 Dec-46 Dec-51 Dec-56 Dec-61 Dec-66 Dec-71 Dec-76 Dec-81 Dec-86 Dec-91 Dec-96 Dec-01 Dec-06 Date of Measurement 600 Dec-26 Dec-31 Dec-36 Dec-41 Dec-46 Dec-51 Dec-56 Dec-61 Dec-66 Dec-71 Dec-76 Dec-81 Dec-86 Dec-91 Dec-96 Dec-01 Dec-06 Date of Measurement This well does not provide a clear picture of ground-water conditions in the 35 years between observations. A nearby well was measured more consistently.

24 Consistent and frequent observations allow identification of recent trends, even if comparison to predevelopment water levels is not possible. Tillman and Leake, in press


25 Microgravity Pool and others, 2000

26
27 Ground-Water Response to Pumping
28 Each ground-water system is unique in its response to pumping Alley and others, 2002; Data from Johnston, 1997
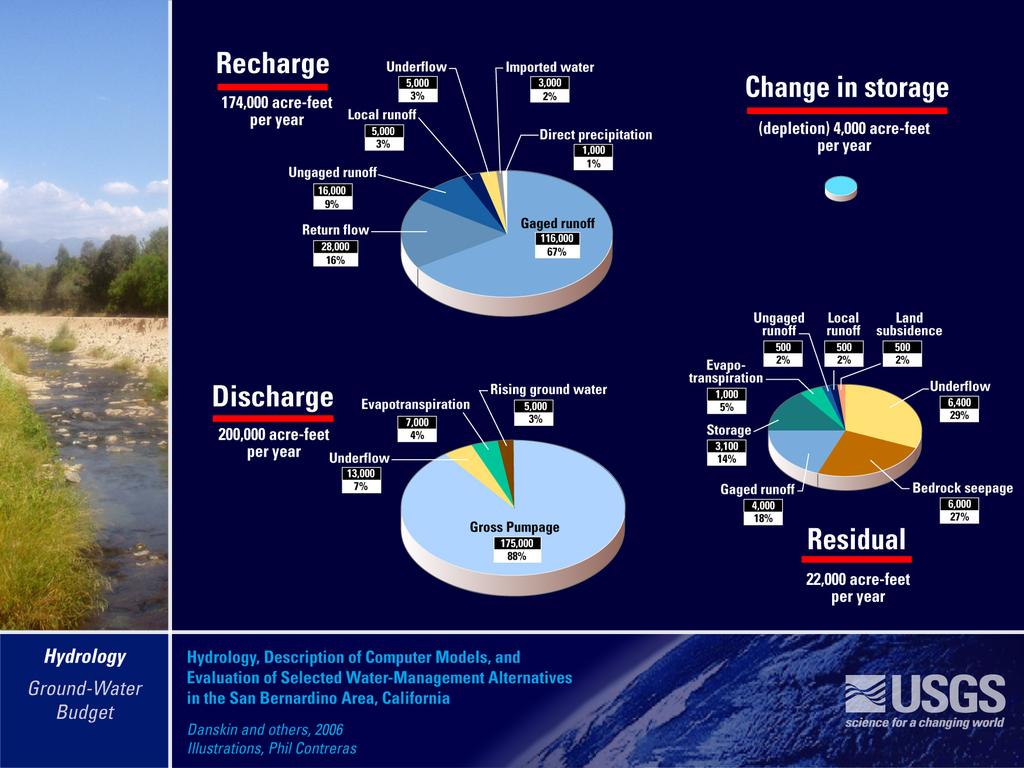
29 Examples High Plains aquifer Middle Rio Grande Basin San Bernardino area, CA

30 High Plains Aquifer WATER IN STORAGE IN THE HIGH PLAINS AQUIFER, PREDEVELOPMENT AND ,000 Predevelopment ,500 1, Colorado Kansas Nebraska New Mexico Oklahoma South Dakota Texas Wyoming 0 Data from McGuire and others, 2003 Water in storage, Million acre-feet


31 High Plains Aquifer Bathtub or Egg Carton? Alley and Schefter, 1987

32 Rio Puerco Cochiti Lake Rio Grande Albuquerque Santa Fe Middle Rio Grande Basin Study Area: between Cochiti and San Acacia about 3,000 mi 2 Rio Salado San Acacia Mullins and Hare (1999)

 Modified from Hawley")
33 Need for Better Understanding of Geologic Framework With limited information in the 1960 s With more information in the 1990 s Modified from Bjorklund and Maxwell (1961) Modified from Hawley (1995)
 (Plummer, et al.")
34 Need for Better Understanding of Recharge and SW/GW Interactions Aquifer recharge less and distributed differently than assumed Improved understanding of river depletion in response to pumping (less hydraulic connection in some areas) (Plummer, et al., 2004)
35 Simulated Annual Water Budget Source: McAda and Barroll, 2002

36
37

38
39 Subcommittee on Ground Water Bob Schreiber, ACWI ASCE Bill Cunningham, USGS Executive Secretary Chris Reimer, NGWA Monitoring Inventory Work Group Bill Cunningham, USGS Mike Wireman, USEPA Emery Cleaves, AASG Data Standards and Data Management Work Group Chuck Job, USEPA Field Practices Work Group Rod Sheets, USGS Mike Nickolaus, GWPC Monitoring Network Work Group Bob Schreiber, ACWI- ASCE Quantity Quality Quantity Quality
40 Integrated Monitoring and Modeling Monitoring (Water Levels, Water Quality, Streamflow, Water Use) Initial Model Adjust monitoring network Update Conceptual Model Adjust monitoring network Simulation Model Update Conceptual Model Adjust monitoring network Simulation Model Environmental Tracer Data Geologic and Hydrologic Studies Environmental Tracer Data Geologic and Hydrologic Studies Alley, 2006

41 USGS Ground-Water Resources Program Regional Water Availability Studies
42 Products Water budgets of major aquifer systems Current estimates and historic trends in ground-water storage, recharge, and discharge Ground-water models that provide Regional context for more local studies Tool for future projections of water availability Estimates of key hydrologic variables across major regional aquifers Evaluation of existing monitoring network Testing and evaluation of new approaches for analysis of regional aquifers
43 In Summary Some ability to track ground-water conditions for many aquifers in U.S Much more limited ability to place data in context of ground-water sustainability (a societal concept) Dynamic response to stress and associated issues of concern vary among regional aquifer systems Need integrated approach with feedback among monitoring, simulation, scientific studies, and management approaches A full national picture would require synthesis of investigations at multiple scales done by many agencies