Type of Area Density (persons/ha) Large lots 5-7 Small lots, single family 75 Small lots, two family 125 Multistory apartments min.
|
|
|
- Gabriella Chase
- 5 years ago
- Views:
Transcription
1 Design of Sanitary Sewer System Key components Service connections, Manholes and pump stations Design Flows 1. Infiltration and interflow (71 to 14 m 3 /d/km). Flow from the service connections Type of Area Density (persons/ha) Large lots 5-7 Small lots, single family 75 Small lots, two family 15 Multistory apartments 5 Design period: usually of the order of 5 years Variation in flow peak ave 5.5 ( P /1).18, min ).16 ave.( P /1 P population of the service area Example: You are required to estimate the peak and minimum sewage flows for a town having an area of 5 ha. The residential area is 6% of the total area, whereas commercial and industrial areas are 3% and 1% of the total area, respectively. Of the residential area, 4% are large lots, 55% small single-family lots and 5% multistory apartments. The wastewater from the residential area is estimated to be 8 Lpcd. The sewage from commercial and industrial areas is estimated to be 5 L/ha/d and 4 L/ha/d, respectively. Type Area(ha) Density (persons/ha) Population Flow (m 3 /s) Large lots.4(15) 6 6 3,6.3 Small single family.55(15) , lots Multistory.5(15) , apartments Total 5,
2 Commercial sector 3% of 5 ha 75 ha Average flow from commercial sector 75x5, L/d. m 3 /s Industrial sector 1 % of 5 ha 5 ha Average flow from industrial sector 5x4, L/d.1 m 3 /s Thus, Average wastewater flow (excluding I/I) m 3 /s Assuming total population is equal to residential population, i.e. P 5,975 Then, peak ave 5.5 ( P /1) 5.5 (5.975) min ( P /1).(5.975) ave.48 Hence, Peak flow Peak factor x wastewater + I/I.(.68) m 3 /s Minimum flow.48(.68) m 3 /s Hydraulics of Sewers Minimum velocity (self-cleansing velocity).6 m/s Maximum velocity 3.5 m/s Minimum pipe diameter 15 mm. Sanitary sewers up to 375 mm diameter should be designed to run half full. Larger pipes may run three-fourths full.
3 The design problem Given: 1. Discharge,. Pipe Diameter, D 3. Pipe slope, S Determine: 1. Depth of flow, h. Minimum velocity, V min 3. Maximum velocity, V max θ h D D θ θ sinθ h 1 cos A D 8 P Dθ A A n P /3 S 1/ Combining these equations we get ( θ sinθ ) θ /3 5/ 3.16n 8/ 3 1/ D S After solving it by trials we can compute A and then, V A If V < V min, reduce the diameter to achieve V Vmin If diameter is the minimum (15 mm), put from the Manning s equation. V Vmin and find the slope of the pipe 3
4 Example: Determine the average velocity in a trunk sewer made of concrete (n.15) having 15 mm diameter laid on a slope of 1%. The peak discharge through the pipe is estimated to be 4L/s. Given: n.15, 4m 3 / s S., 1, D 1. 5m ( θ sinθ ) θ /3 5/ 3.16(.15)(4) 8/ 3 1/ (1.5) (.1) By trials, θ 3.5radian Therefore, 4
5 D θ h 1 cos 1 cos. 88m θ sinθ sin A D 1.5 The average flow velocity in the sewer is given by V 4 3.7m s A 1.8 / 1.8m Sewer Pipe Material Rigid Pipes: Concrete, Cast iron, Vitrified clay Flexible pipes: Ductile iron, Steel, PVC Advantages and disadvantages of each category Typical Manholes 5
6 Sulfide Generation EBOD Z S 33 P B EBOD BOD 1.7 BOD S Slope of the pipe Discharge through the pipe B T 5-day biochemical oxygen demand P, Wetted perimeter and top width of the flow, respectively. Z values Sulfide Condition Z < 5, Sulfide rarely generated 5,< Z < 1, Marginal condition for sulfide generation Z > 1, Sulfide generation common Example: Check the potential for sulfide generation in the trunk sewer of the previous example, if 5-day BOD of the sewage is measured as 16 mg/l and the ambient temperature in the sewer is 3 o C. Solution: EBOD BOD 1.7 T D P θ. 65m D θ B sin sin. 738m EBOD P Z S B > 1 So, sulfide generation will be common in the sewer
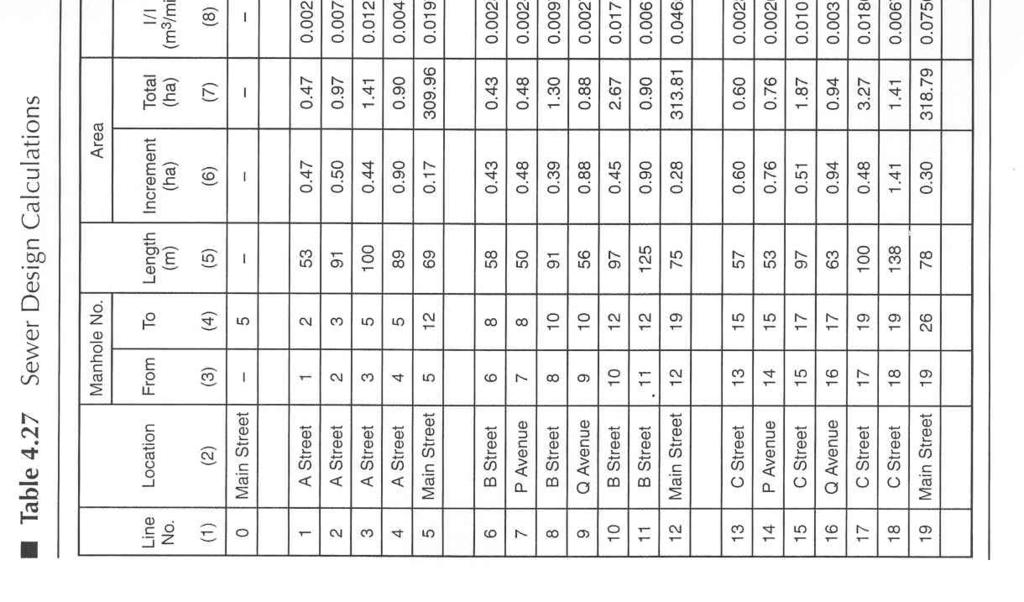
7 Design Computations 7
8 Example A sewer system is to be designed to service the area shown in the following Figure. The average per capita wastewater flow-rate is estimated to be 3 L/d/person, and the infiltration and inflow (I/I) is estimated to be 7 m 3 /d/km. The sewer system is to join an existing main sewer at manhole MH 5, where the average wastewater flow is.37 m 3 /s, representing the contribution of approximately 1, people. The I/I contribution to the flow in the main sewer at MH 5 is negligible, and the main sewer at MH 5 is 1,65 mm in diameter, has an invert elevation of m, and is laid on a slope of.9%. The layout of the sewer system shown in the figure is based on the topography of the area, and the pipe lengths, contributing areas, and ground-surface elevations are shown in the table. Design the sewer system between A Street and C Street for a saturation density of 15 persons/ha. Municipal guidelines require that the sewer pipes have a minimum cover of m, a minimum slope of.8%, a peak flow factor of 3., a minimum flow factor of.5, and a minimum allowable pipe diameter of 15 mm. 8
9 9

 Use SewerCAD to design Reference:")
10 Tutorial Problem (a) Use MS-Excel to design the sewerage system for Streets A and B shown in the previous example. (b) Use SewerCAD to design the sewerage system for Streets A and B shown in the previous example. Reference: Water Resources Engineering by Chin,. 1