The Impact of Excess Phosphorus on Minnesota s Lakes and Rivers presented at SERA 17 November 2015
|
|
|
- Benjamin Stevens
- 5 years ago
- Views:
Transcription
1 The Impact of Excess Phosphorus on Minnesota s Lakes and Rivers presented at SERA 17 November 2015 Steven Heiskary Research Scientist III Environmental Analysis and Outcomes Division
2 Overview 1. Minnesota geographic & lake patterns 2. P Impacts on lakes 3. Development of lake phosphorus water quality standards (WQS) 4. P Impacts to rivers 5. Development of river phosphorus WQS 6. Summary


3 Impact of P on lakes has been firmly established for decades e.g. Experimental Lakes Area Canada ELA Lake & 1994 ELA Lake 226 c 1973
4 Eutrophication & Lake Assessment Since mid 1980s MPCA routinely monitored & assessed lake status for Clean Water Act 305(b) report to Congress; Conducted detailed assessments of 100 s of lakes, Wide range of research and numerous publications on this work; After almost two decades of work (c ) MN promulgated lake eutrophication (nutrient) WQS in 2008 (in support of CWA);

5 Minnesota exhibits distinct patterns in geomorphology, soils, potential natural vegetation & land use hence ecoregion approach. Lake condition varies regionally.
 CHF-Metro (n=20) CHF-Rural (n=15) CHF- Shallow (n=5) WCP - Deep (n=5) WCP/NGP -")
6 Sediment cores as a basis for assessing change over time & regional patterns Diatom-inferred TP: Pre-European vs. Modern-day TP ppb NLF (n=20) CHF-Metro (n=20) CHF-Rural (n=15) CHF- Shallow (n=5) WCP - Deep (n=5) WCP/NGP - Shallow (n=6) Pre-E Modern

7 Shaokotan a prairie lake in SW MN with long history of monitoring, excessive P loading & BMP implementation.


8 Shaokotan responds to decreased TP input; 2013 TP decreased but yet blue green dominated TP declined further 2014 & 2015, algal levels low, clarity increased, rooted vegetation present across the lake


9


")


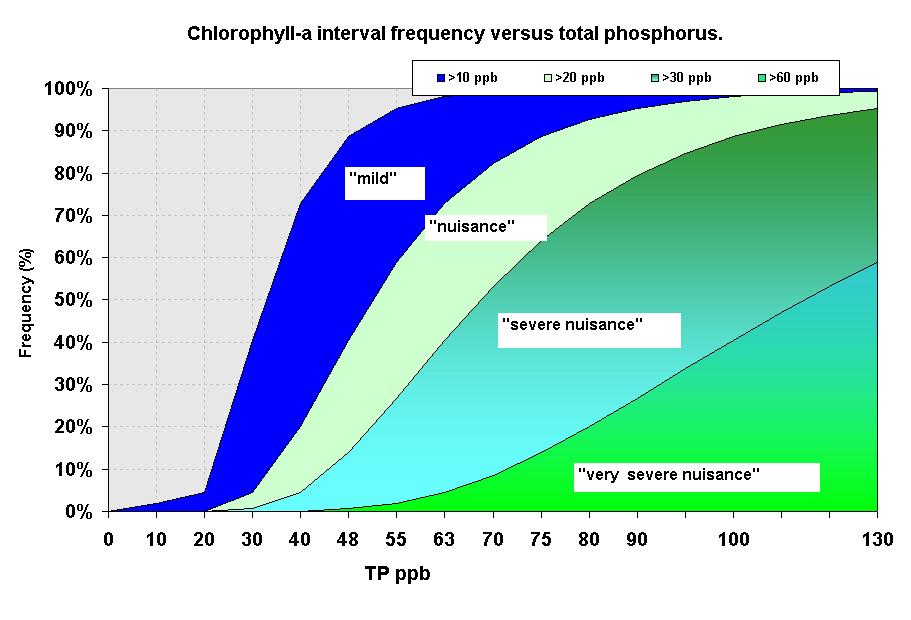
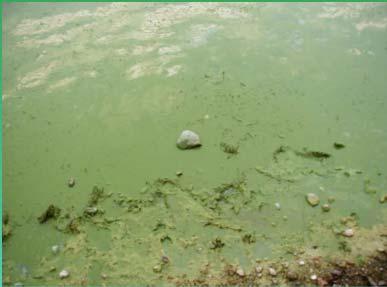
10 Harmful algal blooms (blue green algae) Principal drivers: high phosphorus warm water >75 80 F calm sunny conditions

11 HAB toxin production & concerns Three classes of toxins (all highly toxic) Hepatotoxins (liver) Neurotoxins (nervous system) Dermatoxins (skin) In MN reports of dog deaths & illness occur each summer, e.g. 3 in 2015, 5 in 2007; Human illness gasterointestinal, rash and allergic reactions common response to contact with toxins; One case of youth hospitalized after contact with HAB in 2015.


12 Fish species vary relative to lake trophic status (Carlson s TSI) As TP increases across this gradient, fishery composition changes Based on work of Dennis Schupp & paper by Schupp & Wilson 1993
13 Lake Eutrophication Standards: Use to assess lake condition in MN for Clean Water Act 303(d)


14 Excess nutrients impact rivers too Blue Earth River Watonwan River Pipestone Creek Minnesota River 14
15 P impacts more subtle in rivers & there was a need to establish linkages in support of WQS Bacteria Phosphorus Suspended Algae BOD Daily DO Flux Conceptual model influenced extensive studies & statistical analysis, which led to river WQS Biological Condition 15
16 River Eutrophication WQS: 2014 in MN Rule Region Total Phosphorus ppb Chlorophyll ppb Response criteria DO flux ppm BOD 5 ppm North Central South Includes causative criteria: summer mean TP and 3 response criteria If TP and one or more response variables is exceeded, WQS is violated (river reach impaired) 16
 list; c.~573 lakes listed as impaired; d.")
17 2014 Lake Assessment a. 1,859 fully assessed (using lake WQS), b. 29% impaired & placed on 303(d) list; c.~573 lakes listed as impaired; d. Of these: 263 (46%) have a NPDES discharge in their watershed
18 Stream status (~c2013) Assessments relative to river WQS underway
19 Summary There is no dispute on the impact of excess P on lakes and rivers in MN & elsewhere for that matter; Excess P in lakes & rivers yields excessive growth of algae that negatively impacts recreational use, aesthetics and aquatic life; Blue greens are the most common bloom forming algae many of which produce toxins, a world wide concern; MN has done extensive monitoring & assessment of its surface waters and has developed eutrophication standards for both lakes and rivers. Excess P arises from regulated & un regulated sources and all must be addressed to improve water quality


20 Questions?