RE ENGINEERING O&M PRACTICES TO GET NITROGEN & PHOSPHORUS REMOVAL WITHOUT FACILITY UPGRADES
|
|
|
- Kellie Carr
- 5 years ago
- Views:
Transcription
1 RE ENGINEERING O&M PRACTICES TO GET NITROGEN & PHOSPHORUS REMOVAL WITHOUT FACILITY UPGRADES GRANT WEAVER, PE & WASTEWATER OPERATOR WISCONSIN WASTEWATER OPERATORS ASSOCIATION WISCONSIN DELLS, WI OCTOBER 11, 2012

2 Re Engineering O&M to get N+P Removal Nitrogen Removal Science Design Theory Phosphorus Removal Science Design Theory O&M Strategies Case Studies


3 Traditional Approach
.")
4 Cost of Facility Upgrades $85 billion taxpayer dollars spent building 15,000 wastewater treatment plants (1972 Present). $250 billion needed to fix existing treatment plants and CSO pollution (2010 EPA 20 year Needs Assessment).

5 Wastewater One Percenters Connecticut s Nitrogen Trading Program ( ) 1% of the Capital Cost No Facility Upgrade 10 of 80 plants: Process $50,000 per plant 6 mg/l total N 99 Percenters; Everybody Else Facility Upgrades 48 of 80 plants: N Removal $6.15 Million per plant 6 mg/l total N Phosphorus Experience

6 Re Engineering
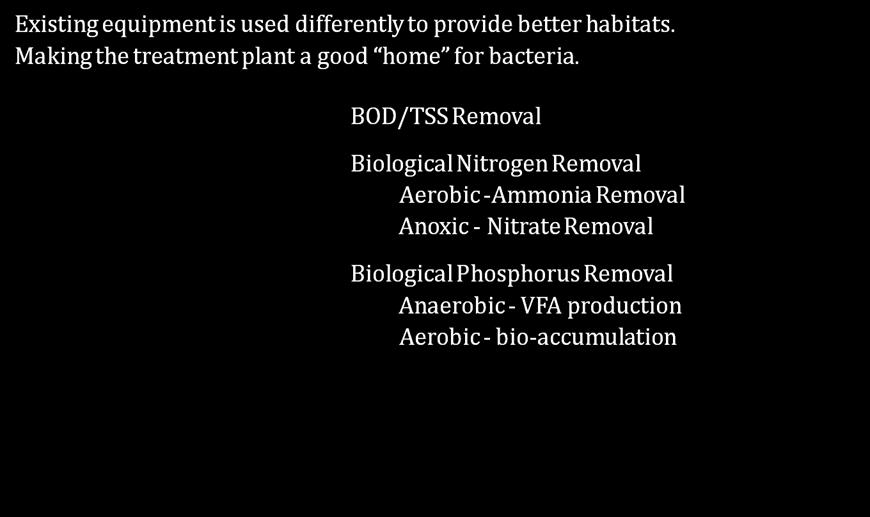
7 How to make any treatment plant remove Nitrogen & Phosphorus Oxygen Rich, low BOD environment Nitrogen Ammonia Removal Nitrification Phosphorus Dissolved Phosphorus converted to TSS (particulate Phosphorus) Oxygen Poor, high BOD environment Nitrogen Nitrate Removal Denitrification Phosphorus Volatile Fatty Acid (VFA) production; if anaerobic/fermentative TSS Removal Nitrogen 12% of MLSS is Nitrogen (8 mg/l TSS = 1 mg/l total N) Phosphorus 3 5% of MLSS is Phosphorus (2 mg/l TSS = 0.1 mg/l total P)
8 Case Study Plainfield (CT) Village Plant ReEngineered for N&P Removal Design Flow: 0.5 MGD Actual: 0.2 MGD Effluent total N Before Changes: 20 mg/l (10 TKN, 8 Ammonia, 10 Nitrite + Nitrate) After Changes: 6 mg/l (2.5 TKN, 0.5 Ammonia, 3.5 Nitrite + Nitrate) Effluent total P Before Changes: 3 mg/l After Changes: 0.75 mg/l
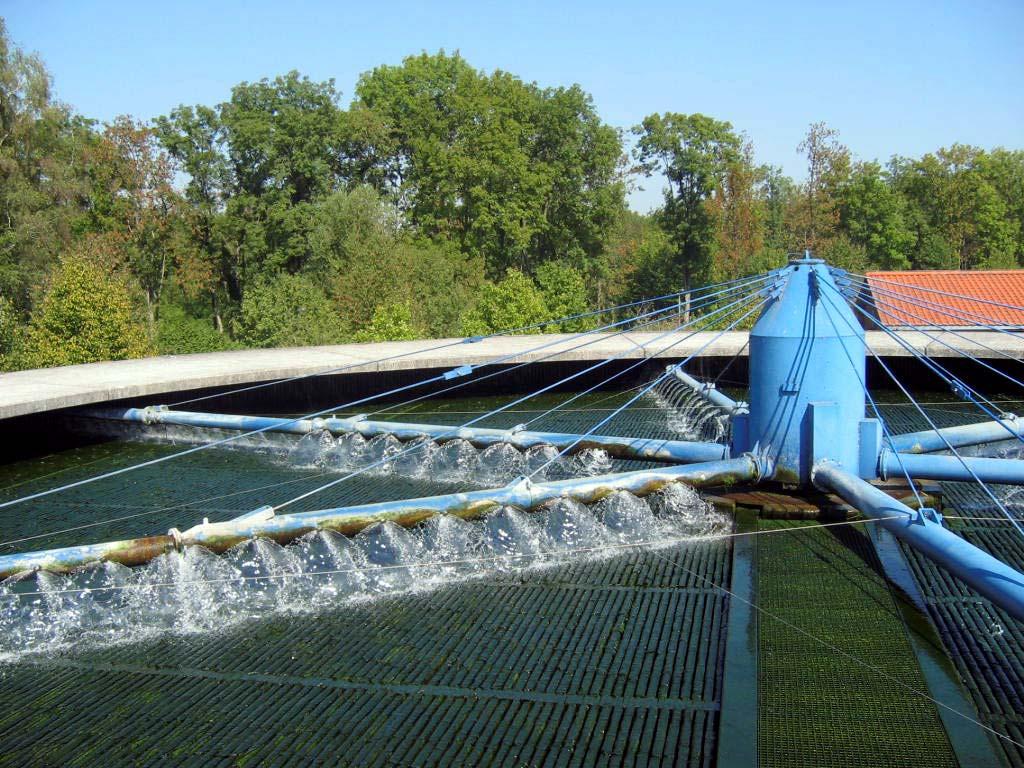
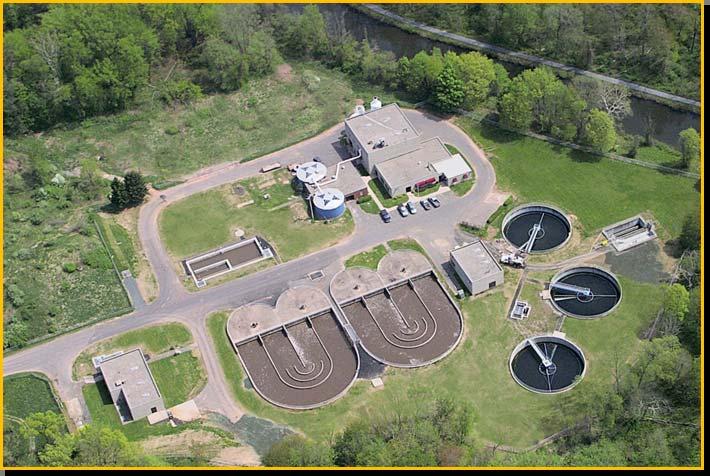
9 Plainfield Village Secondary Clarifier AERATION Gravity Thickener
10 Plainfield Village Gravity Thickener as Post Anoxic Denitrification Secondary Clarifier AERATION ANOXIC Gravity Thickener


11 Nitrogen and Phosphorus Removal
12
13 Biological Nitrogen Removal Organic Nitrogen (org N) Ammonia (NH 3 ) Nitrate (NO 3 ) Nitrogen Gas (N 2 ) Ammonia Removal Nitrification: Bacteria Convert Ammonia to Nitrate Nitrate Removal Denitrification: Bacteria Convert Nitrate to Nitrogen Gas
14 Re Engineering O&M for Nitrogen Removal Ammonia Removal Nitrate Removal
15 Ammonia Removal Oxygen Oxygen Ammonia Nitrite Nitrate Alkalinity
16 Ammonia Removal Nitrification Create a Habitat to motivate and support Bacteria that remove Ammonia (NH 3 ) Dissolved Oxygen (DO) +100 ORP Low BOD Old Sludge (High MLSS, High MCRT/SRT; Low F:M) Alkalinity to keep ph from dropping Time (HRT) Temperature


 Alkalinity to keep")
17 Ammonia Removing Technologies Dissolved Oxygen (DO) & ORP Old sludge (High MLSS / MCRT / SRT; Low F:M) Low BOD Time (HRT) Alkalinity to keep ph from dropping
18 Nitrate Removal BOD Oxygen Nitrate Nitrogen Gas Alkalinity
19 Nitrate Removal Denitrification Create a Habitat so the Bacteria that Remove Nitrate (NO 3 ) will be motivated to do it Little to Zero DO 100 ORP Surplus BOD (High F:M) Time (HRT) They give back one half of the Alkalinity that the Nitrifiers removed

20 Nitrate Removal Habitats
21 Nitrate Removing Technologies Post Anoxic Denitrification Pre Anoxic Denitrification (MLE: Modified Ludzack Ettinger) SBR, or Cycling between Nitrification and Denitrification Oxidation Ditch (Bardenpho) HABITAT Little to Zero DO 100 or lower ORP Surplus BOD (High F:M) Time (HRT)
22 BOD Secondary Clarifier AERATION POST ANOXIC Post Anoxic Denitrification
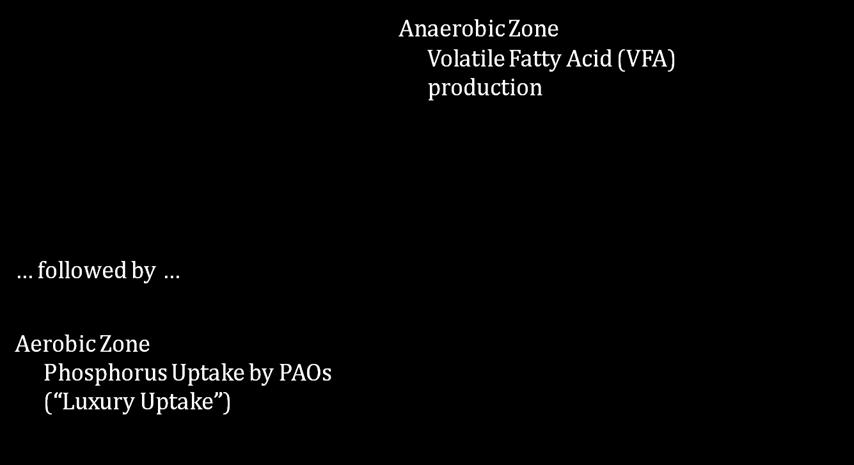
23 Mixed Liquor Recycle Secondary Clarifier PRE ANOXIC AERATION Sludge Recycle Pre Anoxic: MLE Process
24 Fill React Settle Decant ANOXIC AERATION Sequencing Batch Reactor (SBR)

25 Mixed Liquor Recycle Secondary Clarifier ANOXIC AERATION ANOXIC AERATION RAS Oxidation Ditch: Bardenpho Process
26 Nitrogen Removal Simplified
27

28 Phosphorus: Soluble and Particulate Soluble Phosphorus Convert to TSS (Particulate) Biological P removal Chemical P removal Particulate Phosphorus Remove phosphorus by removing TSS
29 Phosphorus Removal Strategy Convert up to 0.05 mg/l of Soluble Phosphorus to TSS (Particulate) Biologically Chemically Particulate Phosphorus Remove as much TSS as necessary to meet Phosphorus Limit Rule of Thumb: 2 mg/l TSS = 0.1 mg/l t P
30 TSS Removal Requirements If all but 0.05 mg/l of Soluble Phosphorus is Converted to Particulate Phosphorus (Biologically and/or Chemically) And, if Effluent TSS is 5% total Phosphorus, Effluent TSS cannot exceed the numbers shown in the table P Limit max TSS
31 Habitats


")
32 Anaerobic Zone Volatile Fatty Acid (VFA) formation


33 Aerobic Zone Phosphorus Accumulating Organisms (PAO) concentrate soluble Phosphorus. PAOs contain 3 times as much Phosphorus as regular bacteria do. The phosphorus concentration in the mixed liquor increases from <2% total P to as much as 5% total P.
34 Biological Phosphorus Removal ANAEROBIC zone for VFA production followed by AEROBIC zone for Phosphorus uptake by PAO bacteria
35 Anaerobic Zone (Fermentation) Mainstream Pre Anaerobic Zone Modify Pre Anoxic Modify Existing Tanks Sidestream RAS piping Gravity Thickener Primary Sludge WAS Combined Primary & Secondary Sludge Storage Septage

36 Chemical Phosphorus Removal Soluble ortho Phosphate is taken out of solution and made into TSS. The particulate Phosphorus is settled. Iron Ferric Ferrous Aluminum Alum PAC Sodium Aluminate
37 Phosphorus Removal Convert soluble Phosphorus to particulate Phosphorus Biological: Anaerobic (Fermentation) followed by Aerobic Chemical: Iron or Aluminum compound Remove the TSS that contains the particulate Phosphorus Achieving low total P compliance requires Low to almost zero soluble P Low to almost zero effluent TSS

38 Case Studies Greater than 50% Nitrogen Reduction Greater than 50% Phosphorus Reduction Capital Cost: as little as ZERO No New Tanks O&M: generally, a cost SAVINGS No Chemicals Carbon Footprint: REDUCED


39 Re Engineering O&M Optimizing Existing Equipment Ongoing Monitoring of Ammonia Nitrite + Nitrate Alkalinity ORP Using In line instrumentation connected to SCADA Hand held equipment Field Test Kits such as Test Strips And Ongoing Process Changes to Optimize Habitats

40 Re Engineering for Nitrogen Removal t N Before t N After Suffield, CT Montague, MA Windsor Locks, CT East Hampton, CT Plainfield Village, CT Manhattan, MT 12 7 Conrad, MT 12 7 Amherst, MA 25 8 Plainfield North, CT 15 8 Farmington, CT 12 8 Chinook, MT 25 12

41 Re Engineering for Phosphorus Removal t P Before t P After Keene, NH East Haddam, CT Montague, MA Suffield, CT Plainfield Village, CT

42


43 Trickling Filters, Lagoons, etc.
44 Case Study Nitrogen & Phosphorus Removal Plainfield, Connecticut Village Plant Design Flow: 0.5 MGD Actual: 0.2 MGD Effluent total N Before Changes: 20 mg/l (10 TKN, 8 Ammonia, 10 Nitrite + Nitrate) After Changes: 6 mg/l (2.5 TKN, 0.5 Ammonia, 3.5 Nitrite + Nitrate) Effluent total P Before Changes: 3 mg/l After Changes: 0.75 mg/l
45 Plainfield Village Secondary Clarifier AERATION Gravity Thickener
46 Plainfield Village Gravity Thickener as Post Anoxic Denitrification Secondary Clarifier AERATION ANOXIC Gravity Thickener
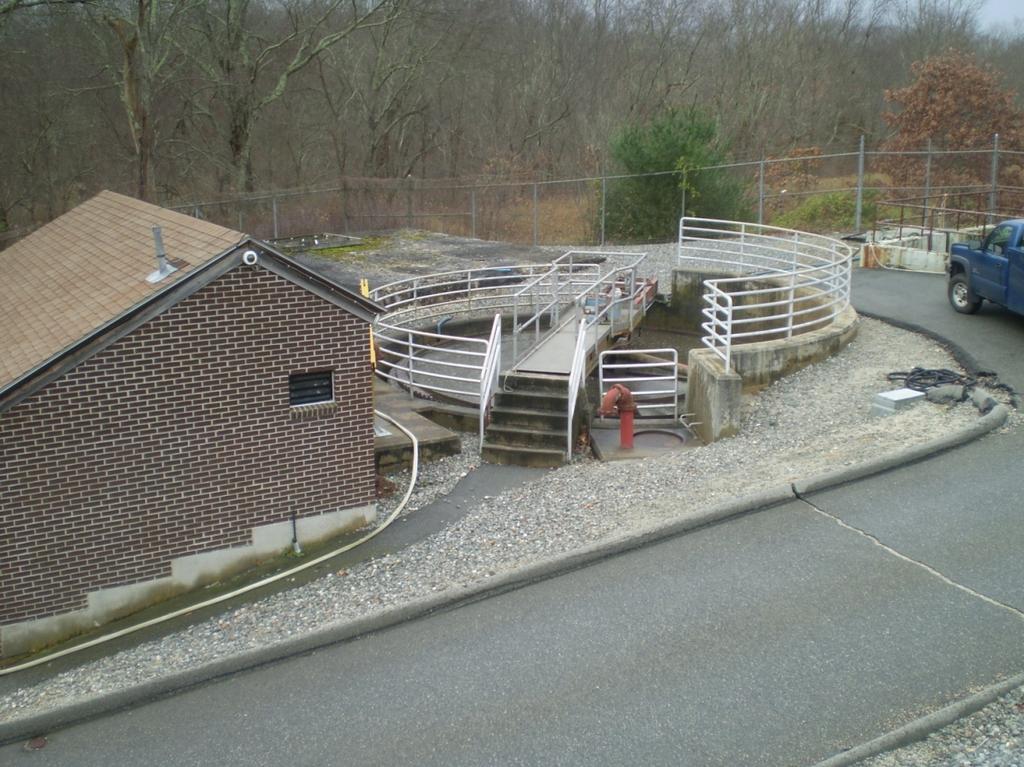
47 Plainfield Village
 After Changes: 3.5 mg/l (2.0 TKN, 0.5 Ammonia, 1.5 Nitrite + Nitrate) Effluent total P Before Changes: 2.")
48 Case Study Nitrogen & Phosphorus Removal Montague, Massachusetts Design Flow: 1.8 MGD Actual: 1.0 MGD Effluent total N Before Changes: 11 mg/l (6.0 TKN, 4.2 Ammonia, 5.0 Nitrite + Nitrate) After Changes: 3.5 mg/l (2.0 TKN, 0.5 Ammonia, 1.5 Nitrite + Nitrate) Effluent total P Before Changes: 2.5 mg/l After Changes: 0.6 mg/l
49 Primary Clarifiers Aeration Tanks Secondary Clarifiers AERATION AERATION Montague, Massachusetts
50 Montague
51 Primary Clarifiers Aeration Tanks Secondary Clarifiers Air ON Air OFF Montague Process
52 Primary Clarifiers Aeration Tanks Secondary Clarifiers Air OFF Air ON Montague Process
53 Montague
 After Phase I Changes: 8 mg/l (2 TKN, 0.")
54 Case Study Nitrogen Removal Plainfield, Connecticut North Plant Design Flow: 1.0 MGD Actual: 0.4 MGD Effluent total N Before Changes: 15 mg/l (5 TKN, 2 Ammonia, 10 Nitrite + Nitrate) After Phase I Changes: 8 mg/l (2 TKN, 0.5 Ammonia, 6 Nitrite + Nitrate) After Phase II Changes: 5 mg/l (anticipated) (2 TKN, 0.5 Ammonia, 3 Nitrite + Nitrate) Effluent total P Before Changes: 2.0 mg/l After Phase II: 0.75 mg/l (anticipated)
55 Plainfield North
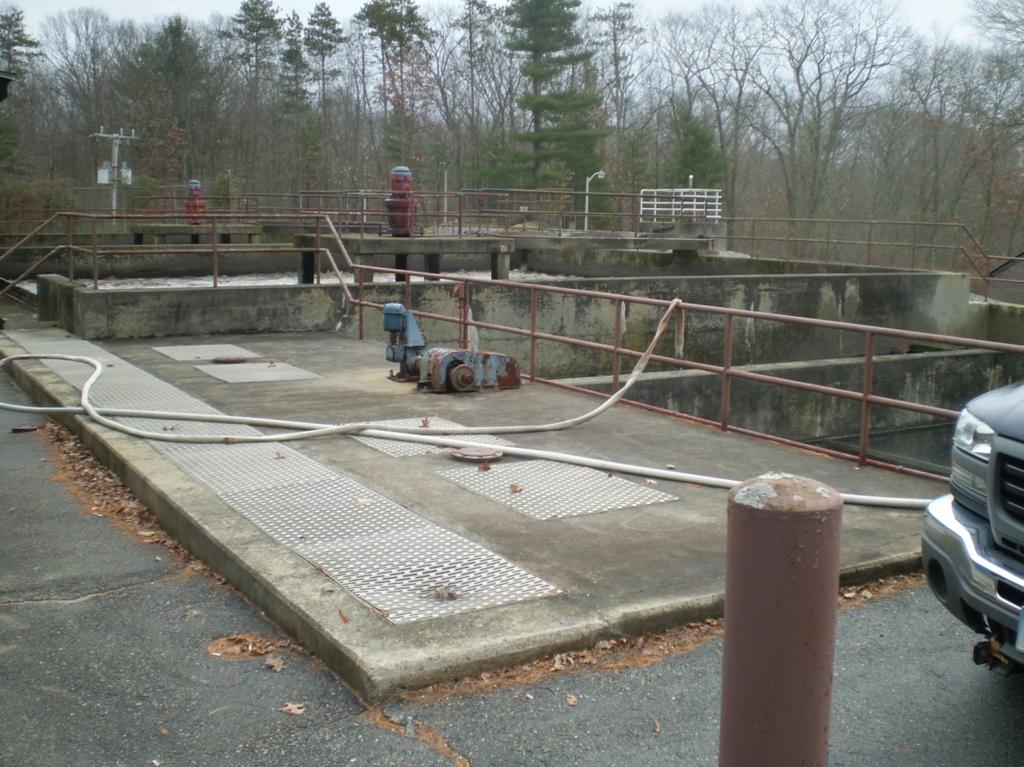
56 Primary Clarifier Aeration Tank Secondary Clarifier North Plant Plainfield, Connecticut
57 Primary Clarifier Aeration Tank Secondary Clarifier North Plant Plainfield, CT

58 Cycling Aeration to create ideal habitats for Ammonia and Nitrate removal
59 North Plant Plainfield, CT Drover Process

60 Drover Process Convert Primary Clarifiers to pre Anoxic tanks (MLE)

61 Case Study Phosphorus Removal Keene, New Hampshire Design Flow: 6.0 MGD Actual: 3.0 MGD Effluent total N Before & After: 8 mg/l (3.5 TKN, 1.5 Ammonia, 4.5 Nitrite + Nitrate) Effluent total P Before Changes: 3.0 mg/l After Changes: 0.2 mg/l
62 PAC Primary Clarifier Aeration Tank PAC Secondary Clarifier PAC Keene, New Hampshire

63 Keene, New Hampshire


 Effluent total P")
64 Case Study Phosphorus Removal East Haddam, Connecticut Design Flow: MGD Actual: MGD Effluent total N Before & After: 6.5 mg/l (2 TKN, 0.5 Ammonia, 3.5 Nitrite + Nitrate) Effluent total P Before Changes: 3 4 mg/l After Changes: 0.35 mg/l
65 Fill React Settle Decant ANOXIC AERATION East Haddam, Connecticut

66 East Haddam, Connecticut
 After Changes: 6 mg/l (2 TKN, 0.")
67 Case Study Nitrogen Removal East Hampton, Connecticut Design Flow: 2.0 MGD Actual: 1.5 MGD Effluent total N Before Changes: 11 mg/l (2 TKN, 0.5 Ammonia, 9 Nitrite + Nitrate) After Changes: 6 mg/l (2 TKN, 0.2 Ammonia, 4 Nitrite + Nitrate) Effluent total P Before & After: 1 3 mg/l

68 East Hampton, Connecticut
69 Primary Clarifier Mixed Liquor Recycle Secondary Clarifier PRE ANOXIC AERATION Sludge Recycle East Hampton, Connecticut
70 Mixed Liquor Recycle Secondary Clarifier PRE ANOXIC AERATION Sludge Recycle
71 Percent Nitrate Removal as Recycle Pump Rate Increases
72 Mixed Liquor Recycle Secondary Clarifier PRE ANOXIC AERATION Sludge Recycle Water Planet s s Observation 100% Recycle Rate
73 Mixed Liquor Recycle Secondary Clarifier PRE ANOXIC AERATION Sludge Recycle 200% Recycle Rate
74 Mixed Liquor Recycle Secondary Clarifier PRE ANOXIC AERATION Sludge Recycle 300% Recycle Rate
 After Changes: 2.0 mg/l (1 TKN, 0.1 Ammonia, 1 Nitrite + Nitrate) Effluent total P Before Changes: 3.0 mg/l After Changes: 0.")
75 Case Study Nitrogen & Phosphorus Removal Suffield, Connecticut Design Flow: 2.0 MGD Actual: 1.0 MGD Effluent total N Before Changes: 7 mg/l (3 TKN, 0.5 Ammonia, 4 Nitrite + Nitrate) After Changes: 2.0 mg/l (1 TKN, 0.1 Ammonia, 1 Nitrite + Nitrate) Effluent total P Before Changes: 3.0 mg/l After Changes: 0.7 mg/l
76 Suffield, Connecticut
77 Mixed Liquor Recycle PRE ANOXIC Secondary Clarifier AERATION ANOXIC AERATION ANOXIC RAS Suffield, Connecticut
78 Re Engineering O&M for Nitrogen & Phosphorus Removal Oxygen Rich, low BOD environment Nitrogen Ammonia Removal Nitrification Phosphorus Dissolved Oxygen converted to TSS (particulate Phosphorus) Oxygen Poor, high BOD environment Nitrogen Nitrate Removal Denitrification Phosphorus Volatile Fatty Acid (VFA) production; if anaerobic/fermentative TSS Removal Nitrogen 12% of MLSS is Nitrogen (8 mg/l TSS = 1 mg/l total N) Phosphorus 3 5% of MLSS is Phosphorus (2 mg/l TSS = 0.1 mg/l total P)

79 Questions, Comments, Discussion
80 Making clean water affordable