Volatile Organic Compound Measurements and Mititgation
|
|
|
- Marilyn Quinn
- 5 years ago
- Views:
Transcription


1 Volatile Organic Compound Measurements and Mititgation Air quality and odor workshop Albuquerque, NM Oct Frank Mitloehner, PhD Associate Professor & CE Specialist Animal Science, UC Davis
2
3
4 What do we know about VOCs? VOC = 1000s individual reactive gases (also referred to as ROG) VOCs are compounds like ketones, alcohols, aldehydes, acids, esters etc. VOCs plus NOx form ozone (smog)
5 Ozone Cycle and the Dependence on NOx and VOC: Winner, Cass and Harley, Atmos. Env. 1995
6
7 Great variation in ozone formation potential (lbs. ozone per lb. VOC) even among similarly volatile molecules Molecule Boiling Point, C MIR acetic acid butanol (n-) butyl acetate (n-) octane octene (1-) toluene xylene (para,ortho,meta) ,7.5,10.6 From a CA regulator: Unfortunately, this may be one issue where the legal system hinders [progress]. We are legally required the inventory is calculated based on mass not reactivity.
8 Dairy VOCs and Regional Ozone Formation -The California VOC Learning Experience- Peter G. Green, Bob Flocchini, Mike Kleeman & Frank Mitloehner Wenli Yang, Cody Howard and Doniche Derrick, Irina Malkina & Yongjing Zhao
9 San Joaquin Valley ozone improving, but too slowly (2005 was best yet, but also note ~1980, ~1998 and 2003) SJV Exceeding US 8hour Ozone Standard Days per year y = -0.6x + intercept Year
10 Total Reactive Organic Gases (non-exempt VOCs) have actually been quite greatly reduced. SJV Summer Emissions Inventory for ROG (non-exempt VOC) tons/day year Natural Grand Total
11 NOx show a delayed trend/forecast -- and monitoring data suggests may be slower SJV Summer Emissions Inventory for NOx tons/day year Natural Grand Total
12 Since VOC + NOx + light => Ozone then why isn t SJV Ozone improving? Idea#1: Reactive organic gases are still available in excess to the limiting reagent (NOx) and natural background limits our ability to lower VOCs Idea#2: Until NOx emissions are also sufficiently reduced, ozone may not improve, or not improve enough Fact: Different compounds do not react equally So, reducing total pounds may not reduce reactivity And therefore not reduce ozone
13 2007 SJV Implementation Plan gives precedence to NOx reductions, and mentions: Ingenuity No stone unturned Incentive-based measures Technology advancement Most cost-effective way Innovative VOC reductions will also help, especially for more reactive compounds
14 VOC + NOx + sunlight -- > Ozone Regulations oversimplify VOCs as pounds By either exempting, or counting by total mass We must consider the relative reactivity, -- to best improve air Typical past studies for urban air use high NOx We use levels typical for summer in San Joaquin Valley More diverse types of molecules in rural VOC Some unstable, others mutually incompatible We assess the entire sample of air at the source, and assess ozone formation immediately
15 Since we can t bring whole rural air into the lab, we re taking the lab out to the air. Since total VOCs cannot be measured, we measure the ozone they would make.
16 10
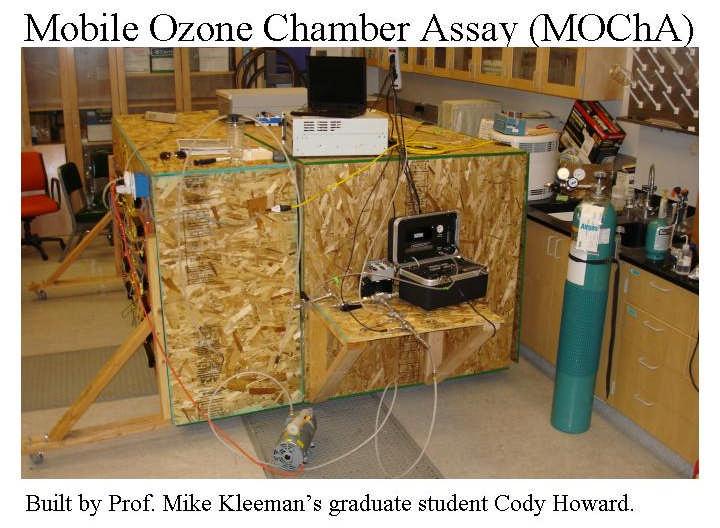
17 Overall Operations Flush with zero air between experiments Teflon diaphragm pump quickly loads 1000L of air Monitors for NO+NO2 (=NOx), Ozone Also temperature, humidity, UV intensity Produce photo-chemical ozone in ~2-3 hours INNOVA for on-line measurement of up to 6 gases Roughly 4 hour cycle time start 8am, 12noon, 4pm Mobile can move with pick-up truck And is on wheels!

18

19

20

21 MOChA2 on the road
22 Key results to date: Dairy chamber (ration + cow, ration + cow + waste) Air sample does have substantial VOC Makes quite low ozone; VOCs mostly ethanol Others (methanol, acetone, acetic acid) even less reactive Ethanol has low MIR, and we see low reactivity One relevant source does produce ozone But the main VOC present, ethanol, is not the cause
23 Ethanol-NOx Isopleth 100 Initial NOx Mixing Ratio, ppbv Initial Ethanol Mixing Ratio, ppbc
24 A dairy example of relative reactivity: ozone forms, but not from the leading VOC! 120 Now, we are Ozone, ppbv 5 data pt per min :00 12:00 14:00 16:00 Ethanol, ppbv data pt per min :00 12:00 14:00 Time of Day 16:00 following up to identify what these more reactive compounds might be.
25 Work in progress Confirming and extending all this effort For example, at NAEMS dairy Also looking at non-dairy VOCs Computer modelling of low NOx, dairy VOCs Rather than urban-like MIR, we seek the Ozone Potential of Emissions in Rural Air OPERA? To be published in refereed journals Peer-review by other researchers is a vital aspect of quality control and assurance before releasing data Trade-offs with greenhouse gas emission mitigation Also trade-offs with water management
26 Need to know which organics: Are they high or low reactivity? What source are they from, and how do they form? How to mitigate them? Look for win-win situations reduce odor, aerosol, greenhouse gasses with same mitigation effort And avoid making things worse! Effort reducing the more highly ozone-forming VOCs can get us moving cost-effectively in the right direction. For SJV, a percentage NOx reduction should be several times more effective than generic VOC reduction.

27 Appendix F March 2007.pdf Between 1994 and 2004, ambient NOx concentrations were flatter, with only a modest reduction of about 5 percent. Because ambient ROG levels have changed faster than NOx levels, the ratio of ROG to NOx has decreased from 5.0 to 2.9 in 2004.
28
29 GEOPHYSICAL RESEARCH LETTERS, VOL. 30, NO. 12, 1613, doi: /2003gl017024, 2003 Increasing Background Ozone During Spring on the West Coast of North America D.Jaffe, H.Price, D.Parrish, A.Goldstein and J.Harris
30

31
32 What are the dairy VOC species?
33 m101 (ppb) 0.2 m87 (ppb) m83 (ppb) 0.4 m69 (ppb) m63 (ppb) 1 m45 (ppb) Unknown Masses with Similar Time Profiles 340 Day of Inlet Outlet
34 VOC species Acetone Acetic acid Ethanol Methanol Isoprene DMS


35
36 What are the relative alcohol emission differences across silage, fresh waste and lagoon waste?
37 EtOH emission rate (ug/hr/g) :00 5:00 10:00 15:00 20:00 Time Lagoon water Fresh manure Corn silage
38 CH4 emission rate (ug/hr/g) :00 5:00 10:00 15:00 20:00 Time Lagoon water Fresh manure Corn silage
39 What is the ozone formation potential of dairy emission sources?
40

41
42 Bottom line Cooperation success Measurement method improvement Greatly improved knowledge of VOC sources and VOC profiles and GHG since Aug 05 Fermented (and certain wet) feedstuff seems to be a major VOC source on dairies Stored waste VOC emissions are far less than previously thought Alcohols (not VFAs) seem to be among the main VOC group by mass Greatly improved emission estimates can assist agencies to optimize BACT recommendations
43 Bottom line Main dairy GHG source are cows (i.e. enteric fermentation and respiration) CH4 emissions from enteric fermentation might be reduced through improvements of feed efficiency (feed additives) and adjustments of feeding strategies N2O dairy emissions are comparatively unimportant CO2 emissions from cow respiration cannot be mitigated w/o reducing herd size Source/Sink

 752-3936;")
44 Frank Mitloehner, PhD; Air Quality CE Specialist Animal Science Department; University of California, Davis (530) ;