Integration of Demand Response with Renewable Energy for Efficient Power System Operation
|
|
|
- Sharyl Hodge
- 5 years ago
- Views:
Transcription


1 Integration of Demand Response with Renewable Energy for Efficient Power System Operation Part B Tutorial Prof. Saifur Rahman Virginia Tech, USA PES ISGT Asia 20 May 2014 Kuala Lumpur, Malaysia 1
2 Tutorial B Part 3: Demand Response Technologies Demand response and demand side management (DSM) Demand response technologies supply side and demand side Performance of demand response technologies Part 4: Demand Response Planning and Operations Sample demand response programs in operation Customer incentives and participation Impact of demand response on the electrical load shape (c) Saifur Rahman 2
3 What is the Challenge? It will be difficult to keep on building large central station power plants in response to traditional demand projections. The impact on fuel supply and the environment will be too high. We need to start thinking about what help we can get from energy conservation and renewable energy. Renewable energy cannot just be an afterthought. It needs to be an integral part of the plans for meeting the load. 3
4 Operation Issues Intermittency Supply-Demand mismatch Demand Response to address the mismatch 4
5 Basic Definitions Peak Load Reduction Actions taken to modify the level and pattern electricity consumption of consumers during peak hours or periods of very high demand: minimize the operation of expensive peaking units avoid transmission congestion costs defer the building of new generation and transmission capacities. (c) Saifur Rahman 5
6 Basic Definitions, contd. Demand Side Management (DSM) Activities and incentive programs implemented and administered by utilities to modify energy consumption and load shape of customers. These include: load control, load shifting, energy efficiency and conservation. Demand Response (DR) Demand Response can be seen as Demand Side Management but on the customer s terms, i.e., the customer decides what loads to control and for how long, often in response to a economic/price signals or special requests by utility. (c) Saifur Rahman 6
7 DSM Load Shape Objectives Source: Primer on Demand Side Management, World Bank Document CRA No. D06090, 02/2005 (c) Saifur Rahman 7
8 Demand Response Definition Demand Response is the set of actions taken by consumers to reduce their consumption of electricity and/or increase their own production of electricity in response to economic signals or dispatch requests. (c) Saifur Rahman 8
9 Demand Response Examples Examples of Demand Response actions include: reducing the duty cycles of HVAC and water heaters, shedding load or shifting electricity usage to off peak hours and, turning on the onsite back up generation (diesel or renewables). Demand Response is considered capacity, i.e., equivalent to a generator that can be dispatched by the utility to keep the grid in balance and maintain its reliability. (c) Saifur Rahman 9
10 Energy Efficiency as Demand Response Energy Efficiency (EE) measures, such as one off installation of efficient devices and appliances as well as adoption of efficient processes and systems that provide long term and continuous reduction in electricity demand can be considered as a form of Demand Response. (c) Saifur Rahman 10
11 Energy Efficiency as Demand Response, contd. EE measures require no action by customer once installed. Examples include: replacing incandescent lighting with compact fluorescent or solid state lighting, installing building automation, installing adjustable speed drives for electric motors used in HVAC and industrial processes. However, EE measures need to be updated to the bestavailable technologies every few years to qualify as Demand Response. (c) Saifur Rahman 11
12 Benefits of Demand Response Demand Response is far cheaper than dispatching the peaking unit, often a natural gas fired turbine plant. Demand Response can be dispatched and realized within 5 10 minutes as compared to the minutes needed by a peaking unit turbine to ram up to full capacity. Demand Response helps reduce transmission congestions and electricity price volatilities thus enabling power exchanges in the wholesale market from regions with surplus to regions with shortage and ensuring the reliability of the system. (c) Saifur Rahman 12
13 Benefits of Demand Response, contd. Demand Response, unlike peaking thermal units, does not emit greenhouse gases and can be considered as clean energy. Demand Response is more reliable than the capacity obtained from a single peaking power station, as it can be sourced from a large and distributed population. (c) Saifur Rahman 13
14 Some major benefits of DR are: Saving in generation investment, deferring T&D upgrades Energy efficiency Benefits & Potential in the US Market Facilitating renewable energy integration Better equipment use (e.g. increase in load factor) DR and Smart Grid: Smart Grid technologies (e.g. smart meter) facilitate DR (c) Saifur Rahman 14
15 Benefits & Potential in the US Market, contd. Potential (US Federal Energy Regulatory Commission, FERC): Existing DR capability: Can reduce 4% of US peak demand (810,000 MW in 2009) DR could shave about 32,000 MW off US peak load in 2010 Based on current industry best practices: 9% US electricity demand can be saved With improved DR: peak shaving could reach 14 20% of the peak (c) Saifur Rahman 15
16 Types of Demand Response Demand Response can be broadly classified into two: Economic Response: Capacity available on a day to day basis created through price signals to the consumer. Response is voluntary. Reliability Response: Capacity on standby that can be called upon to maintain system reliability, also referred to as Contingency or Emergency Response. Response can be both voluntary and obligatory (direct load control, interruptible load etc.) (c) Saifur Rahman 16
17 Demand Response Enabling Technologies Some technologies enabling the Smart Grid Distribution Automation Automated Metering Infrastructure (AMI) Home/Building Energy Management Programmable Lighting and Load Controllers Embedded Controls and Communications Home Area Networks (HAN) Wide Area Networks (WAN) (c) Saifur Rahman 17
18 How is Demand Response Implemented? Demand Response Programs are often outsourced by utilities to third party providers called Aggregators or Curtailment Service Providers (CSP) who: enroll customers in DR programs, provide the technology and initial investment to customers manage the Demand Response programs for customers in return, take a share of the customer s revenue With the advent of the Smart Grid and its enabling technologies such as Automated Metering Reading (AMR) and Home Automation Networks, utilities are increasingly bypassing Aggregators and beginning to provide Demand Response services themselves directly. (c) Saifur Rahman 18
19 How is DR implemented? DR Users Independent System Operators (ISO) Regional Transmission Orgs. (RTO) Utilities DR Sellers Residential Commercial Industrial DR Aggregators or Curtailment Service Providers Enroll DR participants Manage DR programs Revenue Sharing EnerNoc NuEnergen Ameresco Comverge etc. (c) Saifur Rahman 19
20 How is Demand Response Marketed? Demand Response capacities are considered same as generation capacities and are therefore being traded the same way, i.e., on day ahead markets operated by power exchanges, RTOs and ISOs. Aggregators can offer demand response capacity to the market. If cleared, customers will be paid the market clearing price. Demand Response capacities now fetch, by rule, the market price for electricity, known as the locational marginal price (LMP), when it is established to be costeffective to use them to cover for generation shortage. (FERC Order 745, Docket No. RM ) (c) Saifur Rahman 20
 14,940 MW (2014 2015) Type: Managed by: Combined EE, economic and direct load control.")
21 Example DR Programs in Operation (PJM) PJM System: Regional transmission organization (RTO) serving 17 utility zones. Gen. Capacity: 180,400 MW Demand Response: 9,052 MW ( ) 14,940 MW ( ) Type: Managed by: Combined EE, economic and direct load control. Third party Curtailment Service Providers (CSPs), (c) Saifur Rahman 21
 and Economic Demand Response summary, PJM (c) Saifur Rahman")
22 Example Demand Response Event Baltimore Gas and Electric, PJM About 2,300 MWs of Demand Response were invoked at LMP ranging $200 $500/MWh Source: 2011 Final Emergency Load Management (ILR/DR) and Economic Demand Response summary, PJM (c) Saifur Rahman 22

 (c) Saifur")
23 Example Demand Response Event (managed by a Curtailment Service Provider) (c) Saifur Rahman 23
24 DR Capacities of Major ISOs and RTOs Demand Response (MW) % Peak Demand Demand Response (MW) % Peak Demand California ISO (CAISO) 3, , Electric Reliability Council of Texas 1, , (ERCOT) ISO New England, Inc. (ISO NE) 2, , Midwest Independent Transmission 5, , System Operator (MISO) New York Independent System 3, , Operator (NYISO) PJM Interconnection, LLC (PJM) 10, , Southwest Power Pool, Inc. (SPP) 1, , Source: Assessment of Demand Response and Advanced Metering, Staff Report, FERC, Nov (c) Saifur Rahman 24
 Saifur")
25 Potential Peak Load Reduction attained by Demand Response (by region and customer class, 2010) Source: Based on Survey undertaken for the 2010 Assessment of Demand Response and Advanced Metering report by the Federal Energy Regulatory Commission (c) Saifur Rahman 25
26 Customer Incentives and Participation Utilities often provide incentives enticing customers to join demand response programs. Some examples: Utility Type Description PG&E Technical Assistance and Technology Incentive (TA&TI) Up to $125/kW of demand response to assist customers with investment in demand response and energy management technologies; Up to 75% of the demand response project costs NYSERDA TA&TI Up to $100/kW Upstate and $200/kW Downstate to offset cost of equipment and technology; 75% of project cost SDGE TA&TI Up to $300/kW (c) Saifur Rahman 26 SCE TA&TI Up to $300/kW
27 How can Demand Response Improve Acceptance of Renewables into the Electric Power Grid? (c) Saifur Rahman 27
 Saifur Rahman 28")
28 PJM 13 Month Wind Generation Source: PJM wind power statistics, 2011 (c) Saifur Rahman 28 28
 Saifur Rahman")
29 13700 MW Peak Saving w/ DR MW Peak Saving (c) Saifur Rahman 29
30 22500 MW Peak Saving w/ DR MW Peak Saving Wind Power Output MW (c) Saifur Rahman 30
31 How can the Smart Grid Help? Peak load reduction, generator efficiency improvements and DER integration are major benefits of the smart grid Load control at the customer level can provide significant peak load reductions How to incentivize the customer? (c) Saifur Rahman 31 31

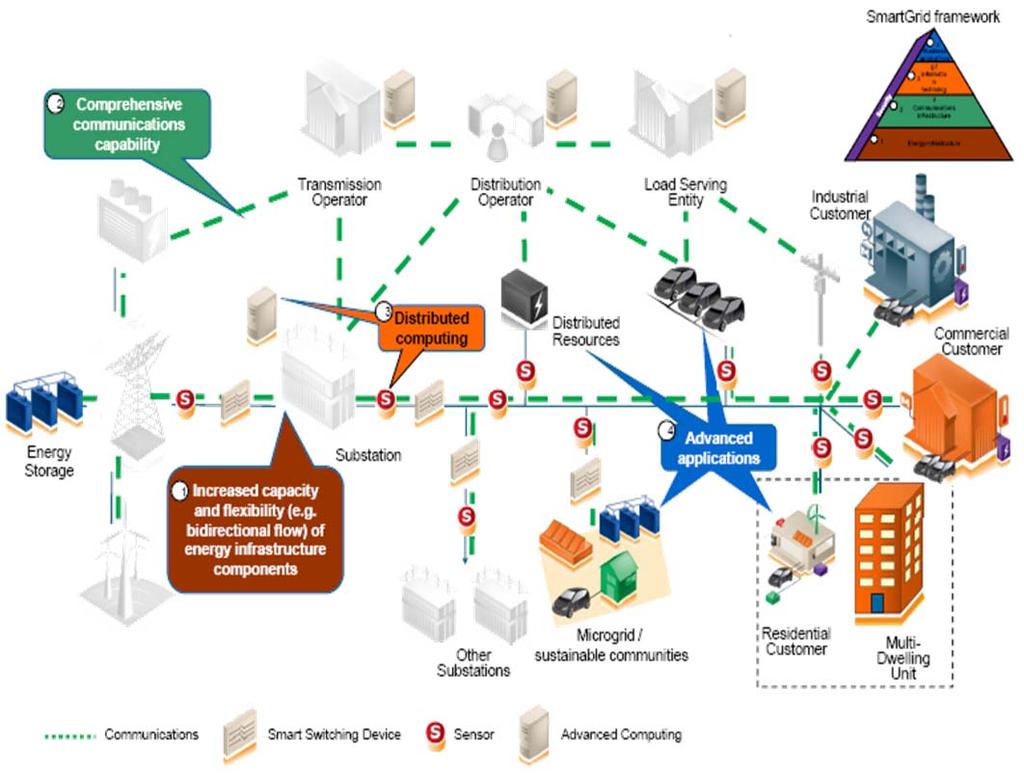
32 Smart Grid Definition According to United States Department of Energy s modern grid initiative, an intelligent or a smart grid integrates advanced sensing technologies, control methods and integrated communications into the current electricity grid. 32 (c) Saifur Rahman 32
33 Smart Grid AMI Capability+ Remote detection sensors everywhere Central and distributed analysis Correction of disturbances on the grid Optimizes grid assets Distribution Automation Customer Voltage Measurement Customer Outage Detection AMI AMR Capability+ AMR Automated Meter Reads Price Signals sent to Customer New Rate Design Leverage data to understand system performance better Self Healing Enable use of renewable resources Remote TFTN Hourly Remote Meter Reads Theft ID Remote Meter Programming Load Control Enable electrification of transportation 3 3 (c) Saifur Rahman Source: EnerNex


34 Starting and End Points of a Smart Grid From Generator to Refrigerator Power Plant Transmission Distribution Home Business End-use Appliances (c) Saifur Rahman 34
35 Electric Power & Communication Infrastructures 1.Power Infrastructure Data network Users Central Generating Station Step Up Transformer 2. Information Infrastructure Control Center Distribution Substation Gas Turbine Receiving Station Distribution Substation Recip Engine Microturbine Distribution Substation Photo voltaics Residential Data Concentrator Recip Engine Cogeneration Fuel cell Commercial Batteries Flywheel Residential Industrial Commercial Source: EPRI (c) Saifur Rahman 35

36 PG&E Smart Grid Vision Today s Grid Future Grid Source: Andrew Tang, PG&E s Smart Grid Vision, April Online [Available]: %20CEC%20SmartGrid%20workshop% %20v1.pdf (c) Saifur Rahman 36
 Saifur Rahman")
37 Building Blocks of the Smart Grid Saifur Rahman (c) Saifur Rahman 37

38 Smart Grid Projects in the United States (c) Saifur Rahman 38
39 References used 1. SideManagement.pdf and operations/demand response.aspx 5. response demand side management what s difference/ 6. and operations/demand response/~/media/markets ops/rpm/ dr ee in rpmcollateral.ashx 7. and operations/demand response/~/media/markets ops/dsr/dr sympoisum ii proceedings.ashx 8. act/demand response.asp 9. and operations/demand response/~/media/markets ops/dsr/2011 final energy load managementand economic demand response summary.ashx response demand side management what s difference/ (c) Saifur Rahman 39
40 Thank you Saifur Rahman