NCAR Mesa Lab Exhibit Hall
|
|
|
- Amos Rogers
- 5 years ago
- Views:
Transcription


1 NCAR Mesa Lab Exhibit Hall

2 Clouds Field Guide

3 ipad & iphone app in the works Clouds Field Guide

4 Sort Clouds
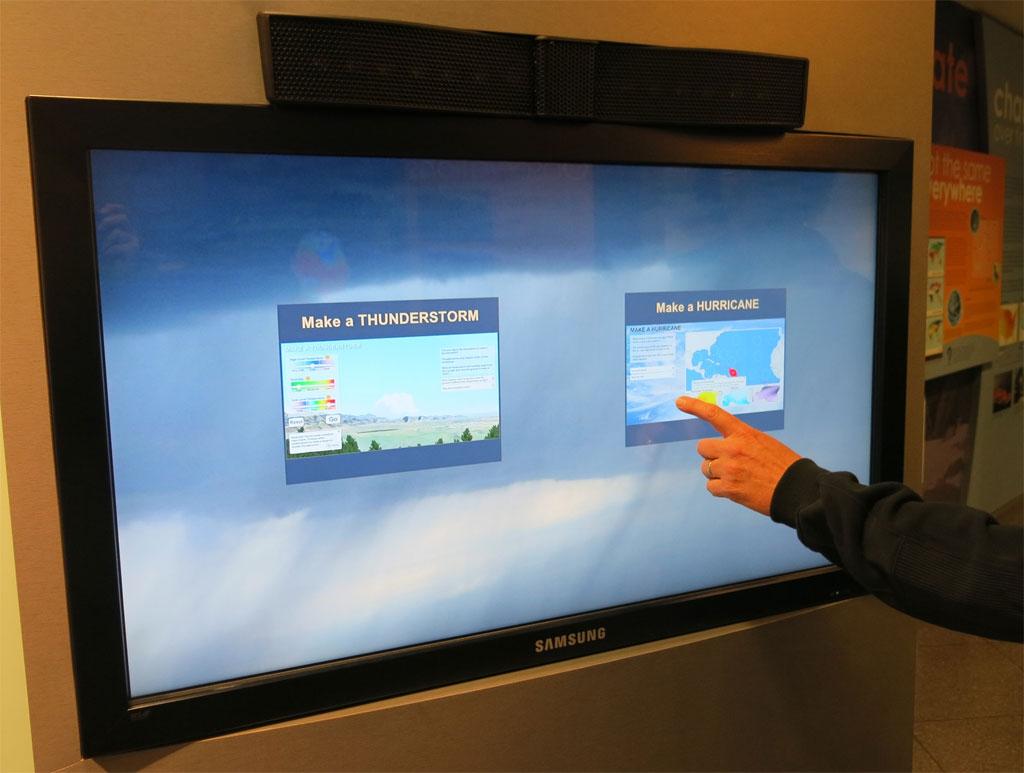
5 Make Thunderstorm


6 Clouds Memory Game
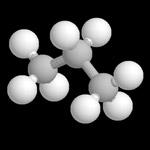
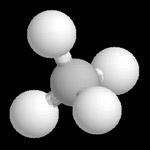


7 Molecules Atmospheric Chemistry


8 Match but not identical!


9 Clouds Game Match Picture to Name Cirrus Cirrocumulus Cumulus Len.cular also, match two different photos of same type of cloud.

10 Computational Science Activities

11 Series of 4 Webinars: Teaching Climate with Models Teaching Climate with Models: Breathing of the Earth June 11, 2012 archived; 48 attendees Heating and Warming: Sensitivity of Earth s Climate to Atmospheric CO 2 September 24, 2012 archived; 48 attendees Teaching Climate with Models: Future Climate Projections scheduled for February 28, 2013 Opportunities for Abundance: Solving the problems of energy, carbon, and climate scheduled for April 25, 2013

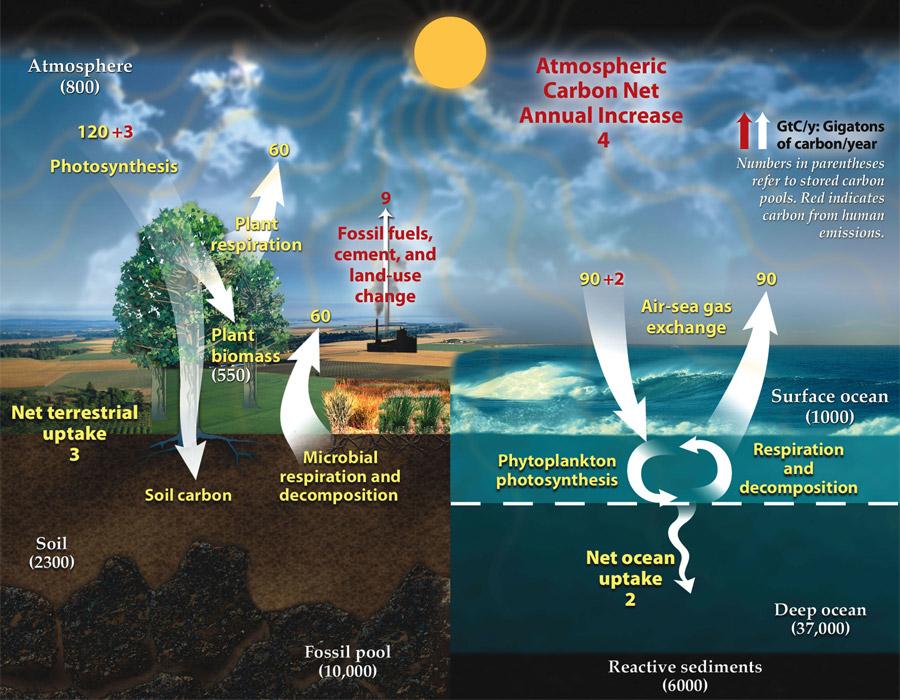
12 Breathing Earth: Carbon Cycle Diagram from DOE
13


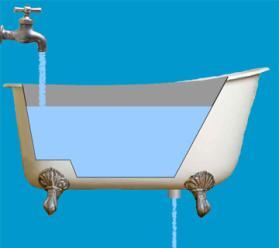
14 Carbon Cycle diagram with Bathtub Atmosphere


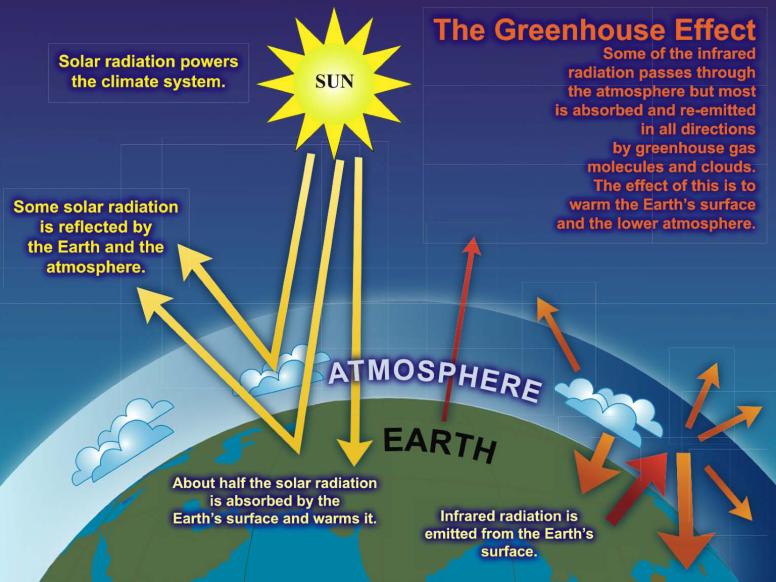
15 Heating and Warming: Sensitivity of Earth s Climate to Atmospheric CO 2 Scott Denning Randy Russell


16 Heat Budgets
 hot Mercury or 53% said Pluto,")

17 Poll: Which gives off longer wavelength infrared radiation: Responses: 11% said Mercury, A) hot Mercury or 53% said Pluto, B) cold Pluto? 35% did not respond Pluto surface temperature: as low as -400 Fahrenheit Mercury surface temperature: up to 800 Fahrenheit
18 Planetary Heat Balance Heat In = Heat Out Absorbed solar energy in = emitted thermal energy out HEAT IN: S * (1-albedo) * area of Earth s shadow = HEAT OUT: Thermal emission * area of Earth s surface area of Earth s surface = 4pR 2


19 Energy In vs. Energy Out We can think of Earth as a circle when calculating sunlight absorbed We must treat Earth as a sphere when calculating energy emitted
 1/4 4σ T = 255 Kelvin = -18 Celsius = 0 Fahrenheit Brrrrrr!")
20 Planetary Heat Balance S(1 α )π R 2 = σt 4 4π R 2 S(1 α ) = σt 4 4 T = S(1 α ) 1/4 4σ T = 255 Kelvin = -18 Celsius = 0 Fahrenheit Brrrrrr!

21 Interactive: Earth s Energy Balance
22 Questions? Is an albedo of 0.9 really bright? Please explain the discrepancy between Earth's theoretical temperature (no atmosphere) of 0 F and what we observe? Temperature calculation seems to be for one wavelength; is there a significant difference when integrating across the whole spectrum? What do you mean Earth's temperature is 0 F? I thought it was about 59 F.
23


24 Transparency and Opacity: Infrared vs. Visible Light


25 Transparency and Opacity: Infrared vs. Visible Light


26 Transparency and Opacity: Infrared vs. Visible Light

27 Hot (Dry) Air is NOT Visible in the Infrared


28 Hot Car Exhaust (with lots of CO 2 ) IS Visible in the Infrared VERY hot tailpipe Hot exhaust with lots of CO 2

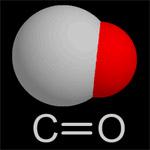
29 Molecular Vibration Modes and the Greenhouse Effect


")
 Carbon")

30 Poll: Which is NOT a GHG molecule? A) Water vapor 2 C) Hydrogen 31 B) Carbon monoxide 0 14 did not respond D) Methane 0
31 Climate Feedback Processes DS DT S Dvapor Positive feedbacks amplify the changes Warmer surface has less ice and snow (darker) A darker surface absorbs more incoming sunshine Darker surface warms D albedo
 and September 2002 (right) show")

32 Ice Albedo Feedback Satellite (LANDSAT) images of the coast of Greenland in August 1985 (left) and September 2002 (right) show how ice reflects much more sunlight than water. Melting ice causes more absorption of energy from sunlight, leading to further warming.

 and")
33 Sea Ice Decline in the Arctic The amount of sea ice in the Arctic has been declining dramatically in recent decades, as seen here in 1980 (left) and 2007 (right).


34 Graphing Sea Ice Extent Activity and animations and interactive viewer.
35 Climate Feedback Processes D hi cloud D lo cloud DS DT S Dvapor Negative feedbacks reduce the changes Some extra water vapor turns into extra low clouds Low clouds block sunlight, but don t block as much outgoing thermal energy Extra low clouds cool the surface D albedo


36 High vs. Low Clouds Different Effect on Climate


37 Satellite Views of Clouds in Visible Light and Infrared Satellite views of clouds over Panama in April 2000 show how low and high clouds have different impacts on climate. Image on left is visible light; only shows low clouds. Infrared image on right also shows high cirrus clouds.
38 Questions on the side Do contrails from airplanes add to this? Scott responds: yes, contrails are high thin clouds that don't block much sunshine, but they are quite good at blocking outgoing thermal radiation
39 Questions? I've never hear carbon monoxide called a GHG before, only an indirect contributor because it helps form ozone. Are most of the CO2 normal modes of vibration radiative during photon absorption?
 After Ice Age, extra 7.")
40 Learning from the Past Ice Age surface heat balance was about ( ) = 7.1 W m -2 less Ice Age surface temperature was about 5 C colder (about 9 F) After Ice Age, extra 7.1 W m -2 heat warmed surface by 5 C Total Climate Sensitivity about 0.7 C per W m -2
 x (0.")
41 Climate Sensitivity to CO 2 4 Watts 1 m Doubling CO 2 in the atmosphere would add 4 Watts of heat to every square meter of Earth Climate sensitivity with all positive and negative feedbacks = 0.7 C per W m -2 Climate sensitivity to doubling CO 2 is about (4 W m -2 ) x (0.7 C per W m -2 ) Climate Sensitivity about 3 C per doubling of CO 2

42 Climate Sensitivity Calculator
43 Questions throughout Why does CO2 radiate more towards the Earth than away from? How are Ice Ages triggered by small changes? Pleistocene - Wisconsian Ice Age More ice, and as it accumulates, more reflection? Lower energy input, lower surface temps, more ice and less albedo? Thanks! Thought so, good to have it confirmed... More on Ice Ages - What are negative feedbacks (limits) on Ice Ages, even one as extensive as the hypothesized Snowball Earth? Doesn t the solar radiation meet the bottom with a small angle at the (melting) pole-regions, so that the energy transfer to the water is not so big? And aren t those polar regions only radiated (about) half a year? Yes CO2 concentration higher but solubility is also effected by temp???
44 Comments & Discussion I love the bathtub analogy! Dorothy - check out the archived presentation from June 11, They go into the bathtub analogy extensively How if at all does temperature effect ocean acidity CO2 less soluble so less acidic? How is this important There is more CO2 in the atmosphere so more CO2 dissolves into the ocean
45 Webinar 1 Survey Feedback 42 of the 48 attendees responded to survey Responses to Likert Scale questions 5 = Excellent, 4 = Good, 3 = Average, 2 = Fair, 1 = Poor Overall, the Web Seminar was valuable to me The content of this Web Seminar was relevant to me The interactive nature of the Web Seminar was valuable. Would you like to see more Web Seminars like this one offered in the future? Yes 100%, No 0% Evaluation of Presenters knowledge, clarity, responsiveness, pace Scott (4.93, 4.83, 4.81, 4.76) Randy (4.88, 4,79, 4.76, 4.67)
46 Webinar 1 Survey Feedback Very engaging and content rich!! Love the bathtub model - what a great model to use to aid in student understanding! (4) I found the carbon cycling in the oceans fascinating. I really enjoyed the interactive models. The web polls allowed me to see where I stood in respect to the other participants. I learned that climax forests are balanced in terms of their net impact on Carbon amounts in various locations. They take up as much C as they release. I never thought of using a bath tub to model flow. I normally use the flow chart which is still so abstract I think because students have nothing to compare it with. This is why I really enjoyed the use of the bath tub as the model. I liked the tub analogy for modeling; I had always called them "sinks". I would like suggestions for more interactive approach in the classroom. I did like the graphics.
47 Webinar 1 Survey Feedback I learned more background details of the carbon cycle that I can share with my students. Responses to the audience's questions...and the modifications made to the script towards this particular audience. Great! Loved the easy to use visuals! Very interesting to learn how the deep oceans have yet to absorb fossil fuel carbon emissions I expected more climate discussion, but I'm glad the presenters started at the basics and that this webinar is the first of four. Interesting fact about acidification of ocean affecting the growth of shells on shellfish. Enjoyed the interactive animation the most; learned a lot about the carbon cycle; look forward to the next webinar in the series.
48 Webinar 1 Survey Feedback Great web seminar! I look forward to using the models in my classes. I would love to see real time data that I could use in the classroom for inquiry added to this presentation. As a middle school teacher I find it difficult to find usable, real time data to use in the classroom. Provide the misconceptions that students have on the topic. How do they get off track in their understanding? Include optional models for ESL learners. I thought there would be more info on how to get students to construct their own models as is suggested in the Next Gen Sci Standards. I would like more seminars that focus on constructing models & engineering design thinking. Less science background, more about using the models in the classroom, pros and cons of using models in teaching, etc.
49 Webinar 2 Survey Feedback 43 of the 48 attendees responded to survey Responses to Likert Scale questions 5 = Excellent, 4 = Good, 3 = Average, 2 = Fair, 1 = Poor Overall, the Web Seminar was valuable to me The content of this Web Seminar was relevant to me The interactive nature of the Web Seminar was valuable. Would you like to see more Web Seminars like this one offered in the future? Yes 100%, No 0% Evaluation of Presenters knowledge, clarity, responsiveness, pace Scott (4.77, 4.74, 4.91, 4.81) Randy (4.91, 4.81, 4.79, 4.74)
50 Webinar 2 Survey Feedback I didn't know why certain gases were greenhouse gases, but Dr. Denning explained it well (the ability of the atoms in a molecule to vibrate in more than one way). Even after my many years of teaching, I know I can still learn more and that is why I attend these webinars :-) Sometimes it's the way someone says something or the way something is illustrated that makes something more clear. I was glad to see some math too. It was explained well. The combination of concept presentation and then augmenting with the web tour interactives helps me incorporate this into my curriculum for my students. There are some great new tools online that can help teach these concepts that so many have trouble comprehending. I liked the tools on molecule vibrations. The polls were good and the question sessions were also. It was great to see the interactive demonstrations that are available now.
51 Webinar 2 Survey Feedback Positive and negative feedbacks are something I am just beginning to think about/work with. I am trying to put together a short unit on GCC for my preservice teachers, and haven't yet figured out what small slice I can carve out for elementary teachers. This gave me some ideas. I learned that there is a lot more to the global heating and cooling than what I ever knew. Appreciated the explanations of radiation, etc in more detail than I have found previously. Thank you for the visuals. Use of lots of pictures and access to these same pictures for using with my students is useful. nice calculations and calculator I am anxiously waiting for sessions three and four in this series. I really loved the discussion of positive and negative feedback loops and wish we had spent more time on those.
52 Webinar 2 Survey Feedback I thought the interactive tools to use with students were among the best content. Overall, I really loved the whole experience. Clear explanations of complex topics. Mathematical, verbal, and graphic representations of information to allow us to use the materials with different kinds of learners. Enjoyed the tag-team approach by Scott and Randy. Loved that we could actually play around with the online animations. Very cool! One of the best I've attended in a while: content rich, good resources, and the presenters were not denigrating to the audience. More interactive components for attendees. Keeps us more engaged. (2) A little more time to play with the interactives during the web tours and then a little more question/reflection time to go after each interactive on line exercise. conceptual animations are always good
53 Webinar 2 Survey Feedback Less time on basic definitions such as wavelength and energy. The audience is science teachers with college course background. Thereby, more topcial information can be covered. I appreciated the double explanations -- ie., Scott first and then another way of thinking about it with Randy. The topic was much too in depth for my students. I was expecting a web seminar on how to teach this to my students, not for it to explain the concept to me in such detail. However, it was good information. Subjects taught: Biology 14, Earth Science 13, General Science 11, Chemistry 10, Physical Science 9, Life Science 9, Physics 9, Environmental 8, Science and Technology 6, Informal Educator 5, Mathematics 3, Other 7