Coachella Valley Regional Water Management Group (CVRWMG)
|
|
|
- Augustine Shaw
- 5 years ago
- Views:
Transcription

1 April 13, 2015
2 SNMP Overview Introduction Regulatory Framework Water Quality Objectives Basin Characterization Ambient Water Quality and Assimilative Capacity Estimate of Future Water Quality Salt and Nutrient Management Strategies Monitoring Plan

3
4 Coachella Valley Regional Water Management Group (CVRWMG) Held public workshops on the SNMP process Developed an approach and scope of work Approach Phase I: Initial SNMP scoping and work plan development Phase II: SNMP development Phase III: SNMP monitoring and other follow-up work Phase II Current Phase Preliminary data review and determination of quantitative methods Determination of ambient water quality (AWQ) and documentation of salt and nutrient sources and sinks Identification of water management goals and salt and nutrient management strategies
5 2009 Recycled Water Policy Requirement: Facilitate basin-wide management of salts and nutrients from all sources in a manner that optimizes recycled water use while ensuring protection of groundwater supply and beneficial uses, agricultural beneficial uses, and human health.
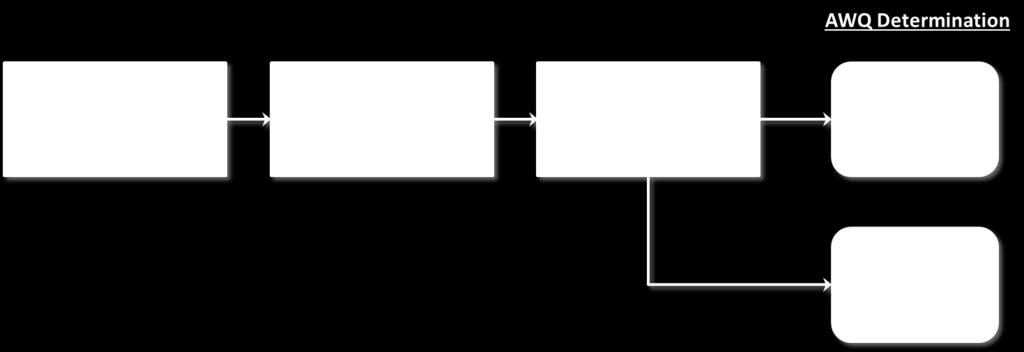
6 Stakeholder Process Define System Approximate Future Water Quality Develop Strategies Documentation Water Quality Hydrogeology Management Zones Planned supply and quality Consistent with state policy? Protect Beneficial Uses of Groundwater Data Gaps Monitoring Plan Work Completed
7
8
9 SNMP
10 Recycled Water Policy (Policy) (2009/2013) Porter-Cologne Act Water Quality Control Plans (Basin Plans) Water quality objectives Beneficial uses Implementation plan Resolution No State Anti-degradation Policy
11 State Water Resources Control Board Resolution No *, Policy For Water Quality Control for Recycled Water (Policy) Goal: Facilitate basin-wide management of salts and nutrients from all sources in a manner that optimizes recycled water use while ensuring protection of groundwater supply and beneficial uses, agricultural beneficial uses, and human health. Streamline Recycled Water Project Permitting * Amended in 2013, now includes monitoring for constituents of emerging concern from groundwater replenishment reuse projects
12 Supplies are limited due to: Growth, Conversion of Land Drought Overdraft Environmental Constraints Climate Change Uncertainty State Policy Encourages Increased Recycled Water and Stormwater Use Promotes Sustainable Local Water Supply Additional Supply to Offset Freshwater Supply Drought Resistant Highly Reliable
13 SNMP
14 Constituent Taste and Odors (TDS) Chemical and Physical Quality (Nitrate) Brines Water Quality Objective (WQO) Ground waters for use as domestic or municipal supply shall not contain taste or odor-producing substances in concentrations that adversely affect beneficial uses as a result of human activity. Sections (Inorganic Chemicals), (Organic Chemicals), and (Lead and Copper) of California Code of Regulations, Title 22. Discharges of water softener regeneration brines, other mineralized wastes, and toxic wastes to disposal facilities which ultimately discharge in areas where such wastes can percolate to ground waters usable for domestic and municipal purposes are prohibited.
15 Nitrate TDS Based on drinking water standards specified in Title 22 = 45 mg/l (Nitrate as NO 3 ) Shall not adversely affect beneficial uses as a result of human activity Based on Title 22 Consumer Acceptance allows municipal use up to 1,000 mg/l Levels above 1,000 mg/l are only acceptable for existing consumers on a temporary basis Based on Colorado River objectives Imperial Dam = 879 mg/l Lake Havasu = 747 mg/l


16 Ability of a water body to receive and accommodate natural and anthropogenic sources of pollutants, while maintaining water quality standards that are protective of the beneficial uses of the water resource
17 SNMP

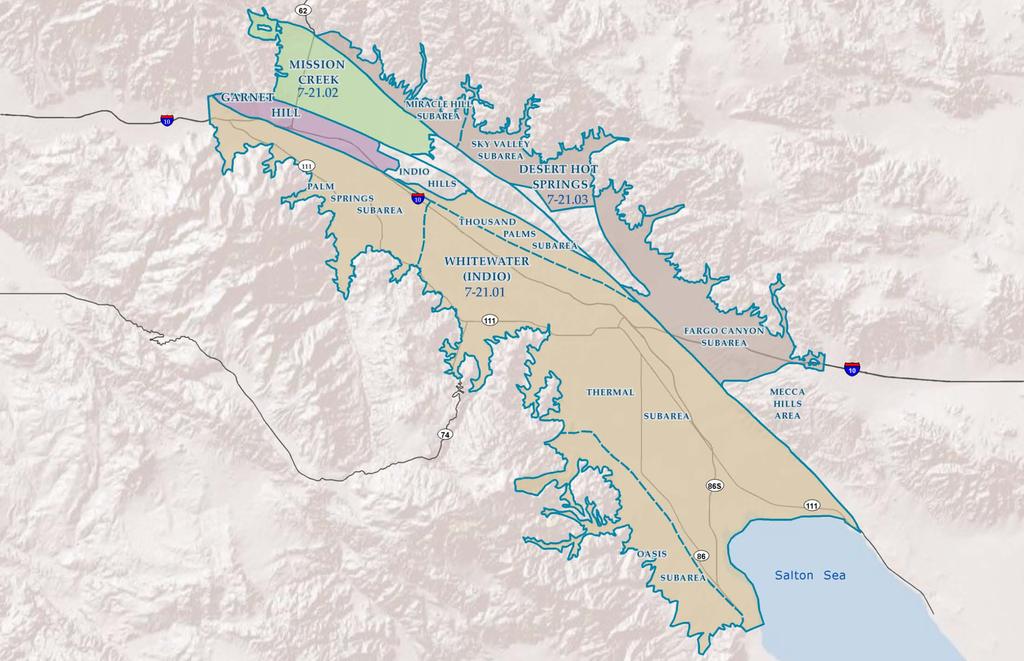
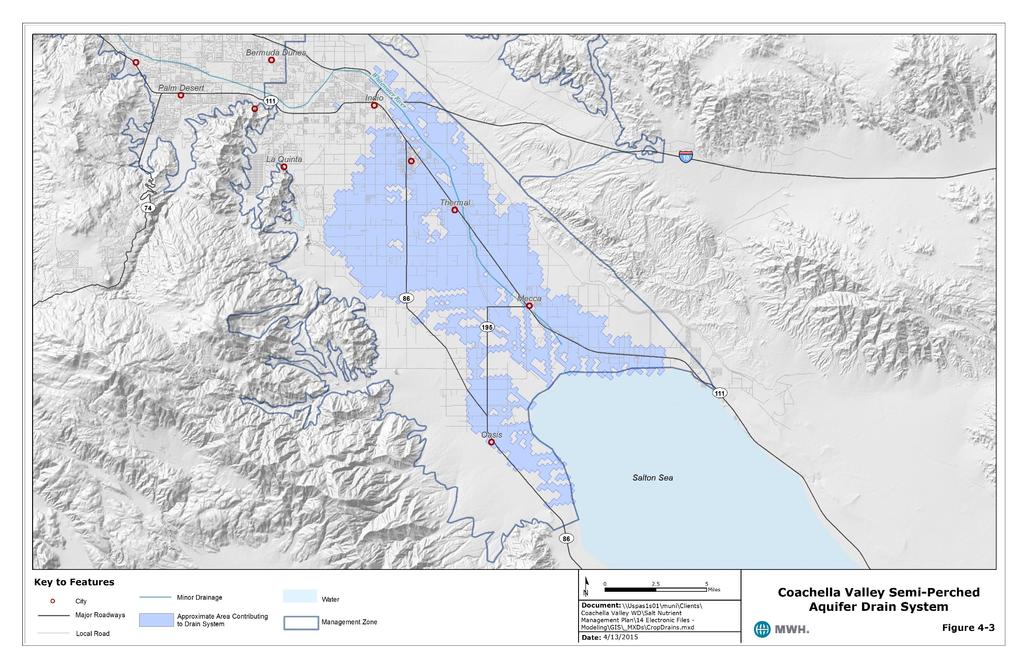
18 Significant faulting, often acts as a barrier to groundwater flow Valley fill is recent alluvial material Elevation and groundwater flow is from the San Gorgonio Pass to the Salton Sea

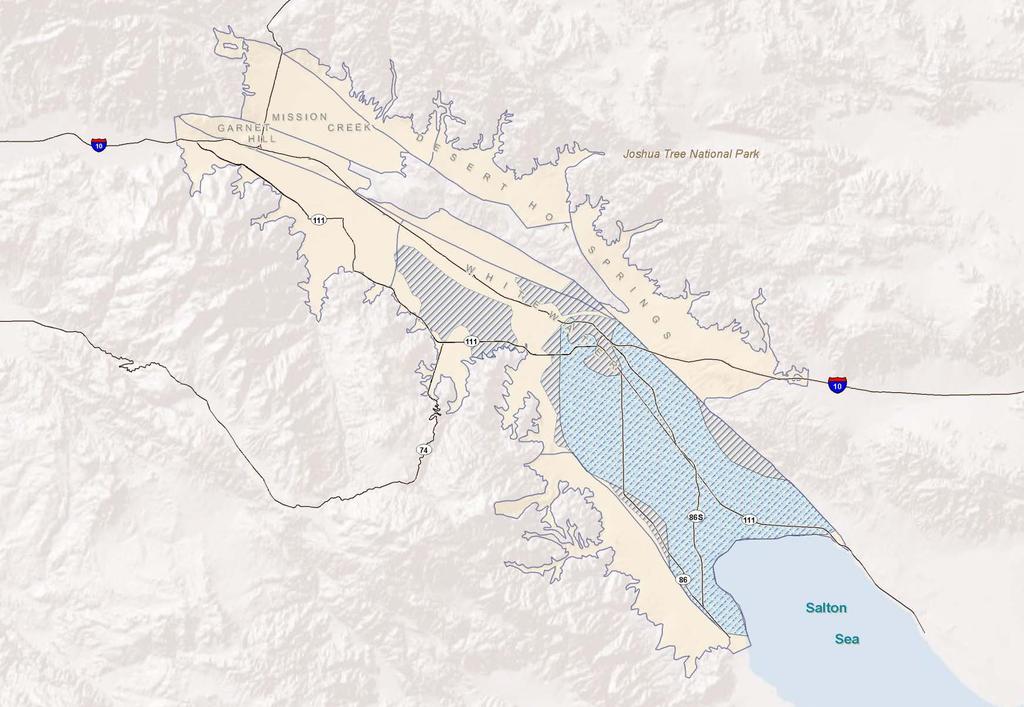
19 Western portion of Whitewater River Basin is unconfined, eastern portion is confined Outflow is to Salton Sea Planned increase in storage will increase outflow to Salton Sea

20 Natural Inflows and Outflows Surface Inflow Subsurface Inflow Outflow
21
22

23 Locations where vertical and temporal water quality trends were evaluated
24 TDS trends vary depending on area Desert Hot Springs, naturally occurring high concentration Few data points Little well construction information No vertical data to evaluate vertical trends Pumping zones tend to be mixed/lower Very deep (little known) typically higher concentration Concentration can increase with time in many cases Few data points in western portion of Mission Creek Subarea
25
26 SNMP
27 Salts Chloride Sulfate Total dissolved solids (TDS) Nutrients Ammonia and Organic Nitrogen (TKN) Nitrite (NO 2 ) Nitrate (NO 3 ) Other Arsenic Fluoride Chromium VI
28
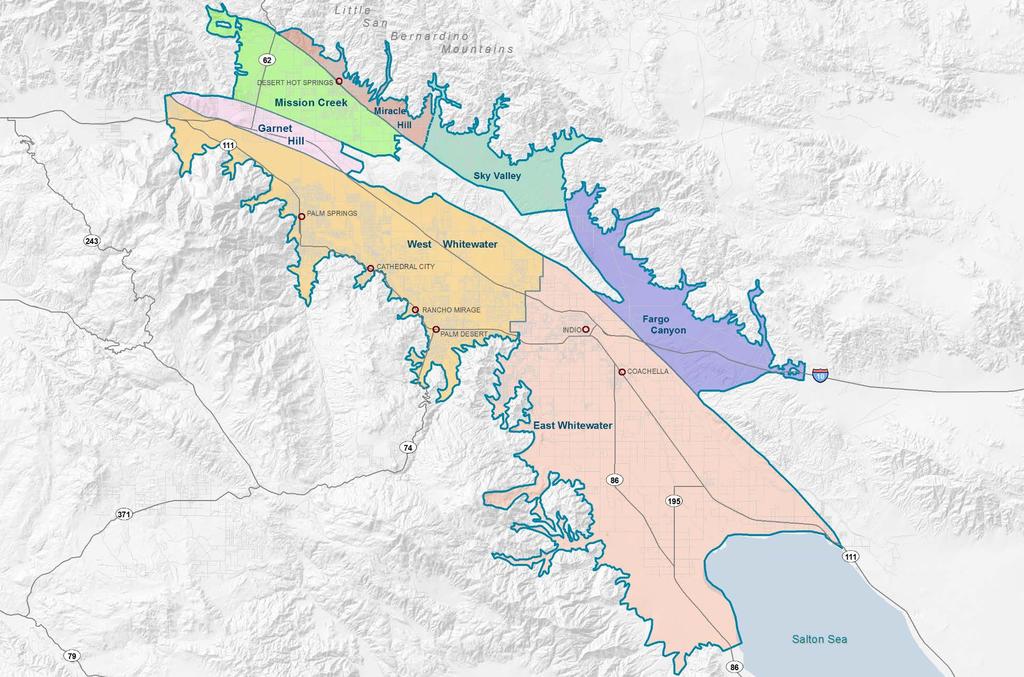
29 Statistical analyses completed for all management zones Period of 1999 to 2013 Within TM-2, descriptive statistics are provided for both unfiltered and filtered datasets AWQ is evaluated based on the filtered dataset
30 TM-2 provides detailed information Considers the amount of water in storage and its concentration Applied when an adequate amount of data exist for a management zone Uses most current data available Volumeweighted average based on aquifer Storage Filtering Contouring Inferred Cell concentrations Ambient water quality

31 Draft results and subject to change 1. TDS water quality objective is based on the Title 22 CCR Consumer Acceptance for municipal beneficial use. A protective water quality objective of 879 mg/l and 747 mg/l TDS is currently being used for this surface water at Imperial Dam and Lake Havasu, respectively. 2. Layer 1 of West Whitewater River has too few data points for the volume-weighted method, therefore the median is used for this layer. 3. Garnet Hill, Miracle Hill, and Sky Valley have less than 10 data points; Fargo Canyon has 13 AWQ is not calculated, the median is shown as a point for reference.

32 Draft results and subject to change 1. Nitrate water quality objective is based on the Title 22 MCL of 45 mg/l. 2. Layer 1 of West Whitewater River has too few data points for the volume-weighted method, therefore the median is used for this layer. 3. Garnet Hill, Miracle Hill, and Sky Valley have less than 10 data points; Fargo Canyon has 13 AWQ is not calculated, the median is shown as a point for reference.
33 SNMP

34 Water balance components act as either a salt/nutrient source or sink to the basin
35 Sources: Artificial Recharge Imported Natural Recharge Precipitation Surface Water Return flows Agricultural Golf Municipal Industrial Fish Farms/Duck Clubs Subsurface Inflow Wastewater Percolation Sinks: Groundwater pumping Drain Flows Subsurface Outflow Treatment Wastewater Surface Discharge
36 Identify Inflows and Outflows for each Management Zone Quantity and Quality (Sources and Sinks) Build Water Budget for the Future Based on Published Water Plans Peer Reviewed Groundwater Model Complete Mass Balance Limitations Assumes instantaneous mixing Single vertical layer Limited to management zones and not site specific Benefits Accomplishes goal of basin-wide management tool for salts and nutrients Can be used by multiple stakeholders Can be used to quickly evaluate projects Based on published material low effort to update
37 Evapotranspiration NO SALT Fertilizer SALT Natural Recharge SALT SALT Irrigation Groundwater
38 Salt Additions to GW - 164,902 Tons in 2014 Coachella Canal - Golf 4% Wastewater Percolation 5% Recycled Water - Golf 5% Groundwater - Municipal, Indoor 3% Other 3% Subsurface Outflow 14% Salt Subtractions from GW 87,019 Tons in 2014 Surface Water - Natural Recharge 7% SWP Exchange - Artificial Recharge 37% Groundwater - Municipal, Indoor 17% Groundwater - Municipal, Outdoor 46% Groundwater - Golf 12% Groundwater - Golf 23% Groundwater - Municipal, Outdoor 24% Draft Results Subject to Change
39 Salt Additions to GW - 467,873 Tons in 2014 Subsurface Inflow from Other MZs 3% Coachella Canal - Golf 3% Groundwater - Agricultural 5% Groundwater - Golf 2% Other 4% Groundwater - Groundwater Golf - Municipal, 5% Indoor 9% Salt Subtractions from GW - 205,865 Tons in 2014 Other 3% Coachella Canal - Artificial Recharge 6% Groundwater - Municipal, Outdoor 8% Subsurface Inflow from Salton Sea 18% Coachella Canal - Agricultural 51% Groundwater - Agricultural 11% Groundwater - Municipal, Outdoor 19% Outflow to Drains 53% Draft Results Subject to Change
40 1,000 West Whitewater River Management Zone TDS (mg/l) Year
41 50 West Whitewater River Management Zone Nitrate as Nitrate (mg/l) Year Draft Results Subject to Change
42 1,000 East Whitewater River Management Zone TDS (mg/l) Year Draft Results Subject to Change
43 50 East Whitewater River Management Zone Nitrate as Nitrate (mg/l) Year Draft Results Subject to Change
44 SNMP
45 Meet current and future demands with a 10 percent supply buffer; Eliminate long-term groundwater overdraft; Manage and protect water quality; Comply with state and federal laws and regulations; Manage future costs; and Minimize adverse environmental impacts.
46
47 Salt/Nutrient Management Goals focus on strategies to control salt and nutrient loading while staying consistent with other management efforts (WMPs, IRWM goals, etc.): Public Outreach/Awareness Managing Source Water Quality Demand Management and Conservation Wastewater/Source Control and Infrastructure Stormwater Management Planned Projects Data Collection and Improved Basin Understanding
48 Colorado River Salinity Control Program Reduction of salt load by human activity Direct State Water Project Delivery Desalination of Colorado River Water Desalination of Drain Flows Wellhead Treatment
49 Improved Irrigation Efficiency (Golf and Agricultural Users) Reduction in ET losses Desert Landscaping Incentives Reduction in ET losses Evapotranspiration NO SALT Fertilizer SALT Natural Recharge SALT Irrigation SALT Groundwater
50 Septic to Sewer Conversion Also enhanced septic systems Agricultural Drain System Recycled Water Use on Turf for Nitrogen Uptake Wastewater Treatment Upgrades Nitrification/de-nitrification Self-regeneration Water Softeners Fertilizer Application Management
51 SNMP
52 Design to determine water quality in the basin Focus on basin water quality near water supply wells and areas proximate to large water recycling projects, particularly recycled water groundwater recharge projects. Focus on existing wells Identify those stakeholders responsible for conducting, compiling, and reporting the monitoring data.


53 Focus on existing wells and areas where recycled water projects and or supply wells are located Leverage existing monitoring programs Fill data gaps
54 Management Zone West Whitewater River East Whitewater River Mission Creek Garnet Hill Desert Hot Springs Major Data Gaps Shallow data in northern portion of MZ, northern Cathedral City and northern Palm Springs, within I-10 corridor (limited by conservation and preservation areas) East of Grapefruit Blvd and north 66 th Ave., deeper areas east of Grapefruit Blvd, the Oasis subarea: west of Harrison St. and south of 74 th Ave. West of N. Indian Canyon Dr., evaluate existing non-monitored wells for construction information/vertical water quality profile Ensure data collection at or near supply wells (recycled water projects and pumping for supply are limited) Ensure data collection at or near supply wells (recycled water projects and pumping for supply are limited)
55 Evaluate existing (currently non-monitored) wells where data is needed Video if needed Incorporate into existing monitoring program, responsibility based upon location Compile and maintain a single database of well construction and quality records Annual compilation and reporting responsibility: All stakeholders Maintenance responsibility: CVWD, an extension of their Department of Water Resources Responsibilities Vertical water quality Seek opportunities to collect vertical profile data Complete a water quality report summary to the RWQCB every three years Ensure monitoring at recycled water application areas is completed Initiate a data sharing with stakeholders, e.g., golf and agriculture
56 SNMP
57 Draft Plan for Stakeholder review and comment Week of April 20 th Three week comment period Submit SNMP to RWQCB All meetings, meeting materials, comment letters, responses to comments, Tech. Memos and Contact information are posted at
58 April 13, 2015