WHPA AND DWSMA DELINEATIONS AND VULNERABILITY ASSESSMENTS
|
|
|
- Douglas Harper
- 5 years ago
- Views:
Transcription
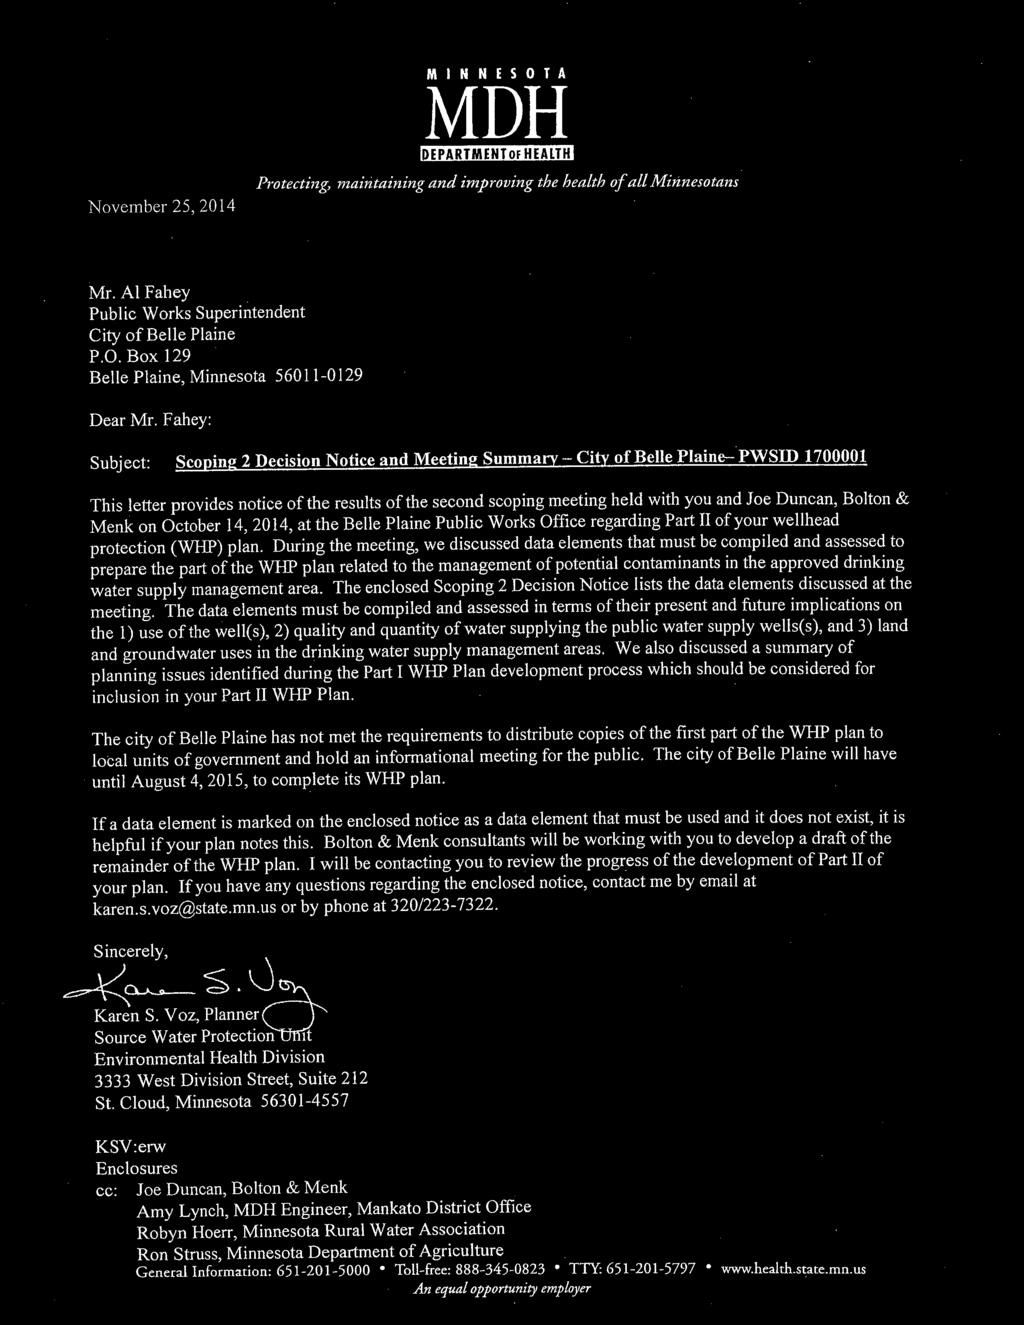
1 APPENDIX I WHPA AND DWSMA DELINEATIONS AND VULNERABILITY ASSESSMENTS WHPA and DWSMA Delineations and Vulnerability Assessments -Appendix I contains the first part of the plan, consisting of the delineation of the wellhead protection area (WHPA), the drinking water supply management area (DWSMA), and the vulnerability assessments for the public water supply wells and the DWSMA. This part of the plan is summarized in Chapter 3. Prepared by: Bolton & Menk, Inc. Updated Belle Plaine Wellhead Protection Plan 2015
2
3
4
5


6


7
8

9
10
11
12
13
14


15
16
17 Amendment to the Wellhead Protection Plan Part I Delineation of Wellhead Protection Area, Drinking Water Supply Management Area, and Drinking Water Supply Management Area Vulnerability Assessment June 2014 Prepared for The City of Belle Plaine by Leggette, Brashears & Graham, Inc.
18 i Table of Contents Page Glossary of Terms... iii 1. Introduction Assessment of the Data Elements General Descriptions Description of the Water Supply System Description of the Hydrogeologic Setting Delineation of the Wellhead Protection Area Delineation Criteria Method Used to Delineate the Wellhead Protection Area Porous Media Delineations Results of Model Calibration and Sensitivity Analysis Calibration Sensitivity Analysis Addressing Model Uncertainty Delineation of the Drinking Water Supply Management Area Vulnerability Assessments Assessment of Well Sensitivity Assessment of the Drinking Water Supply Management Area Vulnerability Recommendations References List of Tables Table 1: Water Supply Well Information... 1 Table 2: Assessment of Data Elements... 2 Table 3: Description of the Hydrogeologic Setting at Wells No. 3 and Table 4: Description of WHPA Delineation Criteria... 6 Table 5: Annual Volume of Water Discharged from Water Supply Wells... 7 Table 6: Other High Capacity Wells Included in Model... 7 Table 7: Hydraulic Conductivity Values Used in Sensitivity Analysis... 13
19 ii Table of Contents Continued List of Figures Figure 1: Figure 2: Figure 3: Figure 4: Figure 5: Figure 6: Figure 7: Figure 8: Figure 9: Figure 10: Figure 11: Figure 12: Figure 13: Site Location, High Capacity Wells, Groundwater Elevation Contours and Local Model Boundary Hydrogeologic Cross Section Locations and Bedrock Geology Hydrogeologic Cross Section A-A Hydrogeologic Cross Section B-B Local Model Domain and Modification Area Local Model Calibration Simulated Groundwater Equipotential Contours 1-, 5- and 10-Year Flowpaths for Calibrated Model Uncertainty Analysis - 10-Year Capture Zones and Flow Direction Uncertainty Area Combined Wellhead Protection Area Boundary and Drinking Water Supply Management Area Delineation Drinking Water Supply Management Area Geologic Sensitivity Assessment Drinking Water Supply Management Area Vulnerability Assessment Existing 2003 and 2014 Drinking Water Supply Management Areas
20 iii Glossary of Terms Data Element. A specific type of information required by the Minnesota Department of Health to prepare a Wellhead Protection Plan. Drinking Water Supply Management Area (DWSMA). The area delineated using identifiable land marks that reflects the scientifically calculated wellhead protection area boundaries as closely as possible (Minnesota Rules, part , subpart 13). Drinking Water Supply Management Area Vulnerability. An assessment of the likelihood that the aquifer within the DWSMA is subject to impact from land and water uses within the wellhead protection area. It is based upon criteria that are specified under Minnesota Rules, part , subpart 3. Emergency Response Area (ERA). The part of the wellhead protection area that is defined by a oneyear time of travel within the aquifer that is used by the public water supply well (Minnesota Rules, part , subpart 3). It is used to set priorities for managing potential contamination sources within the DWSMA. Inner Wellhead Management Zone (IWMZ). The land that is within 200 feet of a public water supply well (Minnesota Rules, part , subpart 19). The public water supplier must manage the IWMZ to help protect it from sources of pathogen or chemical contamination that may cause an acute health effect. Wellhead Protection (WHP). A method of preventing well contamination by effectively managing potential contamination sources in all or a portion of the well s recharge area. Wellhead Protection Area (WHPA). The surface and subsurface area surrounding a well or well field that supplies a public water system, through which contaminants are likely to move toward and reach the well or well field (Minnesota Statutes, part 103I.005, subdivision 24). Well Vulnerability. An assessment of the likelihood that a well is at risk to human-caused contamination, either due to its construction or indicated by criteria that are specified under Minnesota Rules, part , subpart 2.
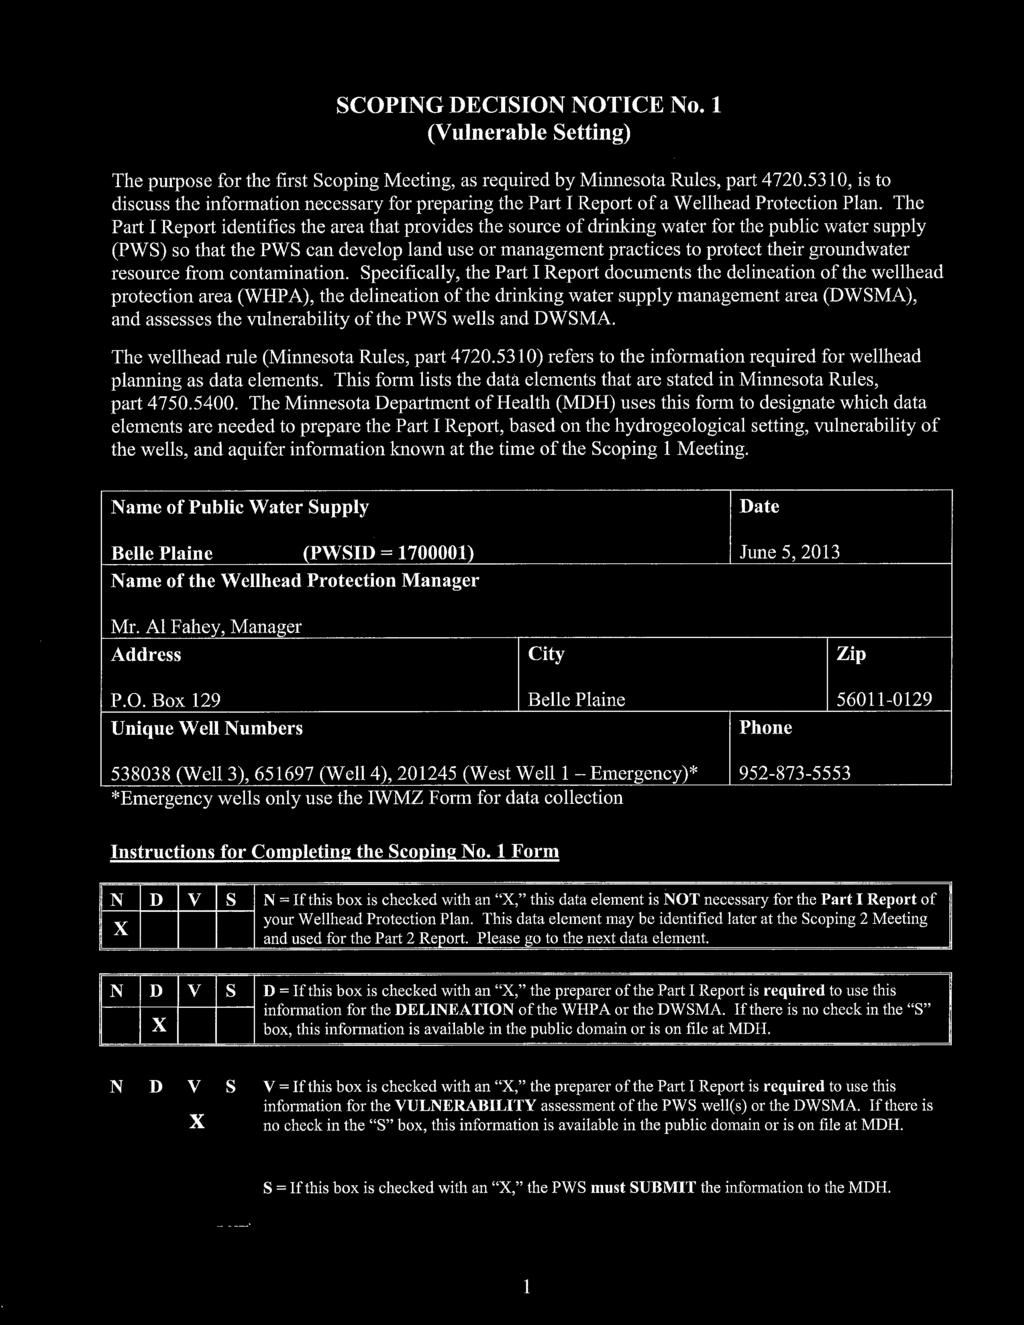
21 1 1. Introduction Leggette, Brashears and Graham, Inc. (LBG) has developed Part I of the Wellhead Protection (WHP) Plan for the City of Belle Plaine (City) (public water supply identification number ). The work was performed in accordance with the Minnesota Wellhead Protection Rule (MR), parts to The City s existing WHP Plan, approved November 2, 2005, is being amended now because it needs to be updated before its expiration date, which is ten years from when it was previously approved. Pumping rates have not significantly increased nor have any new wells been added. The results of the development of this amended WHP Plan are presented in the text below, on Tables 1 through 7, and Figures 1 through 12, which are listed in the Table of Contents. This report presents delineations of the wellhead protection area (WHPA) and drinking water supply management area (DWSMA), and the vulnerability assessments for the public water supply well and DWSMA. Figure 10 shows the boundaries of the WHPA and the DWSMA, respectively. These are based on a WHPA that is defined by a 10-year time of travel. Figure 10 also shows the emergency response areas (ERA), which are defined by a 1-year time of travel. This report also lists the technical information that was used to prepare this portion of the WHP Plan in accordance with the MR. Information pertaining to the Aquifer Test Plan (ATP) and the well vulnerability sheets can be obtained from the (Minnesota Department of Health) MDH. The City Wells included in the WHP Plan are listed in Table 1. Table 1 - Water Supply Well Information City of Belle Plaine Local Well Name Unique Number Type Casing Diameter (inches) Casing Depth (feet) Well Depth (feet) Date Constructed/ Reconstructed Well Vulnerability Aquifer West Well No. 1 Well No Emergency Vulnerable QBAA Primary 24x Vulnerable QBAA Well No Primary 24x Vulnerable QBAA QBAA- Quaternary age sand and gravel (Quaternary Buried Artesian Aquifer)
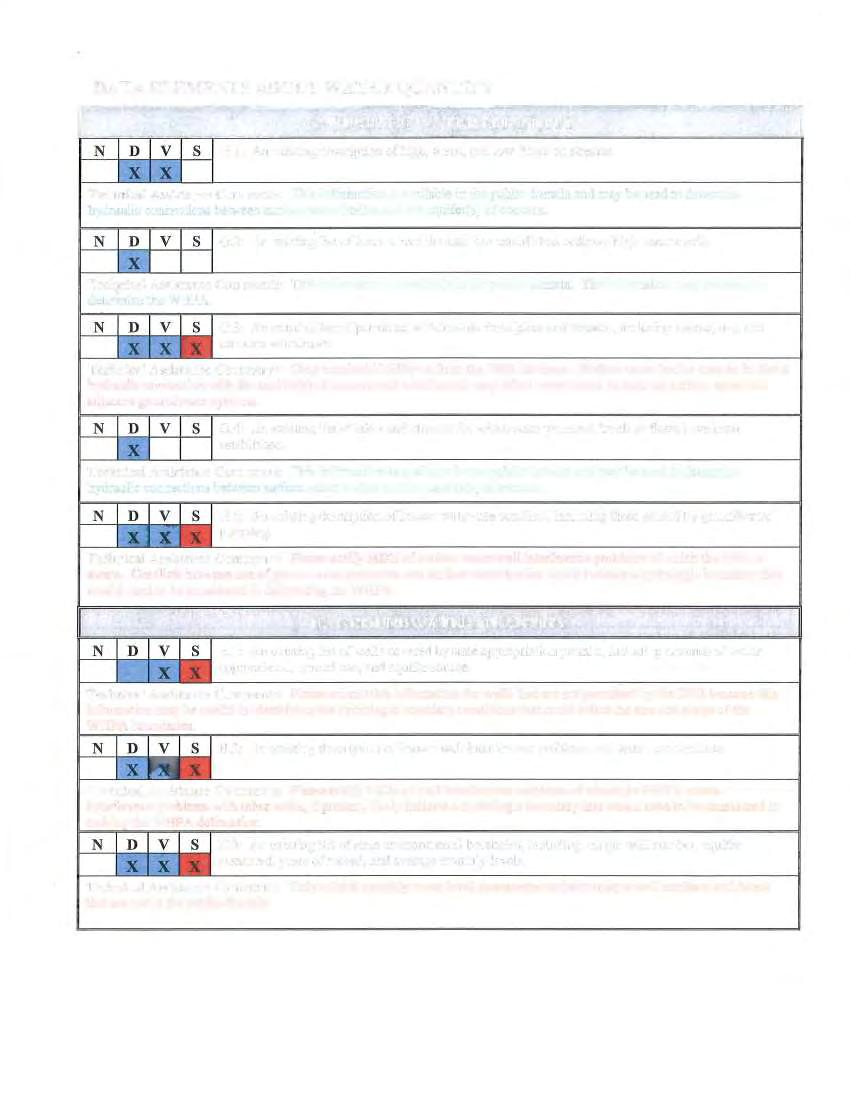
22 2 2. Assessment of the Data Elements Table 2 presents the assessment of the data elements as outlined in the MDH s scoping letter relative to the present and future implications of planning items that are specified in MR, part Data Element Table 2 - Assessment of Data Elements Present and Future Implications Use of the Well (s) Delineation Criteria Quality and Quantity of Well Water Land and Groundwater Use in DWSMA Data Source (See Selected References for Numbered Citations) Precipitation H H H H MN Climatology Working Group, City Geology Maps and geologic descriptions H H H H Mossler, 1998 and 2000 Subsurface data H H H H Mossler, 1998 and 2000 Borehole geophysics H H H H MGS Surface geophysics H H H H None Available Maps and soil descriptions M H H H NRCS Water Resources Watershed units L M L M National Hydrography Dataset (USGS) DNR, National Hydrography Dataset List of public waters L H L L (USGS) Land Use Parcel boundaries map L L L L Scott County GIS Data Political boundaries map L H L L ESRI Data PLS map L H L L ESRI Data Public Utility Services Transportation routes and corridors L M M M ESRI Storm/sanitary sewers and PWS system map M L L City, County Public drainage systems map or list L L ESRI Data Records of well construction, maintenance, and use H H H H City, CWI, MDH Files Surface Water Quantity Stream flow data M H M USGS, DNR, Metropolitan Council Ordinary high water mark data L L FEMA, DNR Permitted withdrawals L L DNR Protected levels/flows L L DNR Water use conflicts L L DNR Groundwater Quantity Permitted withdrawals H H H H DNR Groundwater use conflicts H H H H DNR Water levels H H H H DNR, MPCA, MDH, City
23 3 Data Element Use of the Well (s) Present and Future Implications Delineation Criteria Quality and Quantity of Well Water Land and Groundwater Use in DWSMA Data Source (See Selected References for Numbered Citations) Surface Water Quality Monitoring data summary L M MDH, MPCA, MDA, DNR, City Groundwater Quality Monitoring data H H H H MPCA, MDH, USGS Isotopic data H H H H MPCA, MDH. USGS, UMN Tracer studies H H H H None Available Contamination site data H H H M City, MPCA and MDA MPCA and MDA spills/release reports H H H MPCA and MDA Definitions Used for Assessing Data Elements: High (H) The element has a direct impact. Moderate (M) The element has an indirect or marginal impact. Low (L) The element has little if any impact. Shaded The element was not required by MDH for preparing the WHP Part 1 Plan. 3. General Descriptions 3.1 Description of the Water Supply System The City, shown on Figure 1, obtains its drinking water supply from two primary wells, City Wells No. 3 and 4. The wells are shown on Figure 2 and Table 1 summarizes information regarding them. 3.2 Description of the Hydrogeologic Setting The hydrologic settings for the Quaternary Buried Confined Aquifer (QBAA) are described in the City s original Part I WHP Plan (LBG, 2003) and a summary of the hydrologic conditions at the City Wells is presented in Table 3.
24 4 Quaternary Buried Artesian Aquifer (QBAA) Table 3 - Description of the Hydrogeologic Setting at Wells No. 3 and 4 Aquifer Attribute Descriptor Data Source Aquifer Material Sand and Gravel Well No. 3 well log (538038) Well No. 4 well log (651697) Primary Porosity 0.25 Value recommended by MDH. Aquifer Thickness 145 feet (Well 1) to 217 feet (Well 3) Well No. 3 well log (538038) Well No. 4 well log (651697) Stratigraphic Top Well No. 3 well log (538038) 735 feet-amsl Elevation Well No. 4 well log (651697) Stratigraphic Well No. 3 well log (538038) 530 feet-amsl Bottom Elevation Well No. 4 well log (651697) Hydraulic Well No. 3 well log (538038) Unconfined Confinement Well No. 4 well log (651697) Transmissivity (T) Hydraulic Conductivity (K) Groundwater Flow Field Reference Value/Range: 125,000 ft 2 /day (71, ,000 ft 2 /day) Reference Value/Range: 610 ft/day ( ft/day) Flow in QBAA is to the north northwest toward the Minnesota River. Hydraulic Gradient: variable The Aquifer Test Plan was approved on May 5th, 2013, and the reference value and range for the transmissivity were determined from a pumping test conducted at City of Belle Plaine Well No. 3 (538038) in November of The Aquifer Test Plan was approved on May 5th, 2013, and the reference value and range for the transmissivity were determined from a pumping test conducted at City of Belle Plaine Well No. 3 (538038) in November of 2001 and uses an aquifer thickness of 205 feet. Measured from model results.
25 5 4. Delineation of the Wellhead Protection Area 4.1 Delineation Criteria The boundaries of the WHPA for the City are shown in Figure 10. Table 4 provides descriptions of how the delineation criteria that are specified under MR, part were included in the model. Table 4 - Description of WHPA Delineation Criteria Criterion Descriptor How the Criterion was Addressed Flow Boundary Flow Boundary Daily Volume of Water Pumped Minnesota River and Sand Creek Other High-Capacity Wells (Appendix B Table 1) See Table 5 Groundwater Flow Field See Figures 9 & 10 The rivers provide boundary conditions to the local model that extends to these natural boundaries. They were included in the model and set the local groundwater flow. The pumping amounts were determined based on the averaged pumped volumes. The pumping amounts of these high-capacity wells were included in the methods used for the delineation. Pumping information was obtained from the Minnesota Department of Natural Resources Appropriations Permit The annual pumped volumes were converted to a daily volume pumped by a well. The model calibration process addressed the relationship between the calculated versus observed groundwater flow field. Transmissivity (T) Reference Value/Range: 125,000 ft 2 /day (71, ,000 ft 2 /day) The Aquifer Test Plan was approved on May 5th, 2013, and the reference value and range for the transmissivity were determined from a pumping test conducted at City of Belle Plaine Well No. 3 (538038) in November of Time of Travel 10 years The public water supplier selected a 10-year time of travel. Information provided by the City and from the Minnesota Department of Natural Resources (DNR) SWUDS database were used to identify the maximum volume of water pumped annually by each well over the previous five-year period. The City s projected volume is equal to the highest value over the years plus an additional 2%. The rates used in the delineation from the previous five years are summarized in Table 5. The total volume used in the current plan, illustrated in Table 5 (270.3 MGY), is approximately 10% greater than the highest single-year demand over the period of record (244.3 MGY in 2012), indicating a conservative delineation volume. The maximum daily volume of discharge used as an input parameter in the model was calculated by dividing the greatest annual pumping volume by 365 days. The average volume pumped from other permitted wells over the past 5 years, in the area of the City Wells, is summarized in Table 6.
26 6 Table 5 - Annual Volume of Water Discharged from Water Supply Wells Well Name Unique Number Total Annual Withdrawal (million gallons/year[mgy]) Maximum Withdrawal (MGY) Withdrawal used in Current WHP Plan* (MGY) West Well No n/a 0 Well No Well No Totals *Future pumping rate estimated by City is the maximum plus 2%. Source: The DNR State Water Use Database System (SWUDS) Permit Number Table 6 - Other Permitted High-Capacity Wells Included in Model Unique Number Well Name DNR Permit Number Aquifer Use Average Withdrawal ( ) MGY HENDERSON 1 CMTS Waterworks Philip A. Morris QBAA Non-Crop Irrigation KORNDER MTPL Major Crop Irrigation NEW PRAGUE 1 CFMS Waterworks NEW PRAGUE 2 CFIE Waterworks NEW PRAGUE 3 CFIE Waterworks NEW PRAGUE 4 CMTS Waterworks JORDAN 5 CFIG Waterworks Valley View Golf Club CSTL-CIGL Non-Crop Irrigation NEW PRAGUE 5 CFIE Waterworks JORDAN 7 CMTS Waterworks NEW PRAGUE 6 CMTS Waterworks Method Used to Delineate the Wellhead Protection Area Figure 10 shows the WHPA delineated for the City Wells using the results of the porous media modeling delineations. The WHPA is a composite of all the areas identified using methods described in this report that potentially contribute recharge to the aquifers used by the City Wells within a 10- year time of travel Porous Media Delineations The porous media delineations of the WHPA for the City Wells were completed using an existing regional MODFLOW model, Metromodel 2.0, which was provided by the Metropolitan Council (Met
27 Council, 2009). MODFLOW is a 3D, cell-centered, finite difference, saturated flow model developed by the USGS (Harbaugh et al., 2000). The regional Metromodel consists of nine layers that represent the major aquifers and aquitards within the seven-county metropolitan area. These layers represent, from top to bottom, the following units: (1) surficial aquifer of glacial deposits; (2) St. Peter Sandstone or Quaternary Buried Artesian Aquifer; (3) Prairie du Chien Group; (4) Jordan Sandstone; (5) St. Lawrence Formation (aquitard); (6) Franconia Formation; (7) Ironton-Galesville Aquifer, (8) Eau Claire Formation (aquitard); and (9) Mt. Simon Sandstone. The regional groundwater model was calibrated to steady-state water levels and river base flows. A local-scale model, limited to parts of Scott and Carver Counties, was extracted from the regional seven-county model and is shown on Figure 5. The local model and all of the modeling for this amendment was completed using GMS (Aquaveo, 2013), a pre- and post-processor for MODFLOW. The local model was created using the technique of local grid refinement where a smaller, more refined grid is used within the regional model. The heads computed from the regional model then provide some of the boundary conditions for the local model as specified heads. The size of the domain and the general flow-field characteristics of the model were based on the Metromodel and the results of the original delineation. The local model domain was divided into a three-dimensional, non-uniform grid. The model has 166 rows, 193 columns, and nine layers. The details of the Metromodel were then translated to the localscale model using GMS. Finer grid spacing was applied in the local model with telescopic mesh refinement used in the area of the site where the City wells are located. This grid spacing (~5 m in the area of the City s wells) provides better definition in the area of the flow field where simulating the influence of pumping from the wells was critical. The base of the model is variable at an elevation of approximately 100 meters (m) above mean sea level (amsl). There are nine layers in the local model to represent the bedrock units and unconsolidated materials. These layers correspond to the approximate vertical extent of the various stratigraphic units observed in the vicinity of the City. Layers 1 through 3 represent the unconsolidated materials, primarily clay till and sand units. Layer 4 represents overburden and the Jordan Sandstone, where present. Layers 5 and 6 represent the St. Lawrence and Franconia Formations, Layer 7 represents the Ironton-Galesville Sandstone and Layers 8 and 9 represent the Eau Claire Formation and the Mt. Simon Sandstone, respectively. In the area of the City s wells, the overburden is carried through to Layer 8 as the wells were constructed in a northsouth trending buried valley that extends all the way to the Mt. Simon aquifer. This valley is narrow and bedrock rises steeply immediately east of the wells. The size of the domain and the general flow-field characteristics of the model were based on the Metromodel and the results of the original delineation. Changes were made to the original Metromodel defined characteristics in the area of interest around the City s Wells as well as some other changes to increase the accuracy of the model to the east of the City s wells. The modification area is shown on Figure 5. Site specific information allowed for more accurate definition of aquifer characteristics. These changes were confined primarily to the unconsolidated aquifer in the area of the City. One of the changes was to increase the conductance of the QBAA aquifer in the vicinity of the City Wells in order to reflect the information from the ATP. Another significant change involved adding a zone of low conductivity material in layers 3 and 4 along a bedrock ridge east of the City. In the original Metromodel 2, there are extensive layers of high conductivity material overlying the bedrock in this area. As shown on the cross-section in Figure 3, there is a zone where low conductivity till directly overlies the Franconia and St. Lawrence formations. 7
28 It appears that this till, in conjunction with the low conductivity of the St. Lawrence aquitard leads to the significant difference in hydraulic head between the wellfield area and areas a short distance to the east. The till restricts the horizontal flow near the edge of the buried valley and the St. Lawrence aquitard restricts vertical flow causing the steep gradient found immediately east of the City. A corresponding reduction of recharge in the area was needed as it appears the original Metromodel calibration attempted to use higher recharge, rather than lower conductivity, to increase hydraulic heads in the area. These changes dramatically improved the calibration in the area east of the City Wells and in the model in general. In addition to the previously mentioned changes, the following modifications were incorporated in the refined model: 8 The pumping rates from Table 5 were assigned to the City Wells, and; The pumping rates from Table 6 were assigned to the permitted high-capacity wells located near the City Wells. A series of 20 particles were launched at each City Well. A porosity of 25 percent was used for the QBAA aquifer. As part of the sensitivity analysis, groundwater pathline analyses were performed to delineate the 1-, 5- and 10-year capture zones and ultimately the WHPA. The pathline analysis consisted of using MODPATH, a flowpath calculation program, to determine the capture zone for each of the City Wells. This was completed by tracing 20 flow paths from each well for a 10-year travel time. The resulting WHPA boundary (Figure 10) is a composite of the 10-year capture zones calculated using this model for the base-case parameters and the parameter values used in the sensitivity analysis that are discussed in the following section. The model input files are available upon request from the MDH. 4.3 Results of Model Calibration and Sensitivity Analysis The goal of numerical model calibration is to obtain a reasonable correlation between the simulated model results and observed field data. The calibration process is generally completed by running a series of steady-state simulations (simulations where the flow magnitude and direction are constant with time), comparing calculated heads to the measured heads at wells within the model domain while changing the model parameters until the best match between the two is achieved. After a model is reasonably calibrated a sensitivity analysis is used to determine the impact that changes to an input parameter have on the output of the model. In areas where there is a great deal of uncertainty in the physical parameters, either as a consequence of lack of data or based on the uncertainty associated with the interpretation of available data (i.e. pumping test analyses), a number of models are generally run to observe the effect on the model results over the range of potential values for each of the significant parameters. While none of the individual capture zones delineated as part of this analysis should be considered the correct one, it is assumed that the actual capture zone is encompassed by the resulting concatenation of analysis zones Calibration The calibration plot, showing measured versus simulated hydraulic head values, for Layers 1 through 9 of the local model is illustrated on Figure 6. The plot shows that the simulated values and measured
29 head values generally compare quite favorably and have a normalized root mean squared error of approximately 10 percent. More extensive observation data collected within the same general time period and more accurate, sitespecific transmissivity values throughout the model domain would improve calibration and model confidence. The groundwater flow field and hydraulic heads in the area of the City for the calibrated model are shown on Figure 7. The 1-, 5-, and 10-year capture zones, predicted using the calibrated model, are shown on Figure Sensitivity Analysis Sensitivity is the amount of change in model results caused by the variation of a particular input parameter. For example, changing the hydraulic conductivity of an area can change the calculated head values in and around the area of the modified model as compared to the heads in unmodified model. Because of the relative simplicity of the area of interest in this model, the size and orientation of the modeled capture zone may be sensitive to any of the input parameters: The pumping rate determines the volume of the aquifer that donates water to the well. Increasing the pumping rate will expand the capture zone, for a given thickness, and decreasing is will make the capture zone smaller. 9 Results The pumping rate for each well was defined by MR and therefore is not a variable for consideration in this analysis. The direction of groundwater flow and gradient can often be variable and change significantly with changing conditions such as fluctuations in local surface water elevations or the pumping rates in local wells Results The regional flow direction and gradient were determined through the modeling process and closely resemble the flow direction and gradient determined through mathematical analysis of the measured heads in the area. The models were calibrated to hydraulic heads, and the local refined model calibration improved upon the regional calibration. Based on the regional observation data, flow field characteristics and the use of the aquifer of interest, there is not likely to be a large change to the flow direction. However, the direction of groundwater flow does change significantly immediately to the east of the City s wells. Due to the uncertainty associated with significantly different flow directions in a limited area, alternate potential capture areas were defined as part of the uncertainty analysis described in Section 4.4. The horizontal hydraulic conductivity influences the size and shape of the capture zone. The pumping test at City of Belle Plaine Well No. 3, which is only open to the QBAA aquifer indicates the hydraulic conductivity of the QBAA aquifer is approximately 610 ft/d (185.9 m/d). Analysis of well data indicated the hydraulic conductivity of the QBAA aquifer could be as high as 673 (ft/d) (205.1 m/d) and as low 345 ft/d (105.1 m/d). All of the transmissivity data and the analysis can be found in the ATP documentation from the MDH. These values are higher than the general range of values used for the area in the Metromodel. Modifications were made in the local model to match the well data in the area of the locations shown on Figure 7, and to perform an uncertainty analysis. The ranges of conductivities used in the analysis
30 10 are described in Table 3. The modeled capture zones for this analysis were plotted together and the resulting outline forms the composite capture zone used in the DWSMA delineation. Results - A change in the hydraulic conductivity of the aquifer slightly shifts the location of the capture zones. Since the transmissivity values for the QBAA, obtained from the November, 2001 Well No. 3 test mentioned previously, showed some variability the values were attached with a low level of confidence. As a result the range of potential values of hydraulic conductivity was examined during the uncertainty analysis. The range of hydraulic conductivity considered in the sensitivity analysis runs is given in Table 3 and the values used for each of the runs in the uncertainty analysis are presented in Table 7. Table 7 Hydraulic Conductivity Values Used in Sensitivity Analysis Simulation Number Conductivity (ft/d) Conductivity (m/d) 1* * Base Case Model - Conductivities were determined through testing and analysis as summarized in the Aquifer Test Plan. The aquifer thickness and porosity influence the size and shape of the capture zone by limiting the water-bearing volume within a given area of aquifer. Decreasing or increasing either thickness or porosity forces a proportional decrease or increase in the areal extent of the capture zone. Results - The thickness of the aquifers around the wells in the model was adjusted to reflect the approximate thickness from the well logs. In the areas around Wells No. 3 and 4, the base and surface elevations of the aquifers were reasonably consistent, therefore, the base and surface of the layers in the model were defined to encompass the respective values from the well logs. The porosity values used in the model are conservative and consistent with the material. 4.4 Addressing Model Uncertainty Using computer models to simulate groundwater flow always requires that simplifying assumptions be made. Local geology can be highly variable and information from well logs and pumping tests indicates that this is likely the case near the City Wells. Unfortunately, existing information is not detailed enough to define this degree of variability and interpretation of log and test data is often inconsistent. For models of the scale used in this study, the information and computational ability does not exist to precisely delineate the WHPA. To account for this, a number of models are run to examine the various potential WHPAs for the wells, given the range of the input data mentioned previously. MODFLOW models were used to delineate the capture zones for the QBAA aquifer that supplies water to the City s Wells. As determined from the sensitivity analysis, the hydraulic conductivity was the single model variable identified that would cause the greatest change in the WHPAs for the City s Wells within the calibrated model. Capture areas were delineated for the assessed range of aquifer conductivities for a time-of-travel period of 10 years and are shown on Figure 9. In addition to the results of the sensitivity analysis of the calibrated model, the rapid change from a northerly to a west-northwesterly flow direction immediately east of the City is of particular concern.
31 The direction of groundwater flow is highly variable in the area of the City s Wells, as shown on Figure 9. A small shift in hydraulic head or slight change in model conditions could potentially change the flow direction at the wells significantly. To account for this uncertainty, after discussions with the MDH, the composite capture zone created in the sensitivity analysis was rotated through the potential directions of flow and an outline encompassing that entire area was created to represent the composite WHPA. As flow at the wells could be coming from any direction from almost directly south to nearly directly east, the capture zone needed to encompass nearly a 90 degree range, as seen on Figure The final WHPAs for the City s Wells consist of a composite of the porous media aquifer delineations for the different input parameters used in the sensitivity analysis and the rotation of these zones through the potential directions of flow. This provides a conservative approach to addressing model uncertainty and produces a WHPA that will likely be most protective of public health. 5. Delineation of the Drinking Water Supply Management Area The boundaries of the DWSMA were defined using the following features (Figure 10): City streets and other roads PLSS boundaries Due to significant clay or till above the aquifer that supplies the City Wells, surface water is not hydraulically connected to the aquifers, and therefore a conjunctive delineation was not necessary. 6. Vulnerability Assessments The Part I WHP Plan includes the vulnerability assessments for the public water supply well and DWSMA. These vulnerability assessments are used to help define potential contamination sources within the DWSMA and to select appropriate measures for reducing the risk that they present to the public water supply. 6.1 Assessment of Well Sensitivity Review of site-specific data from the CWI indicates that significant low permeability material overlies the QBAA (65 feet of sandy clay till). The well vulnerability assessment was conducted in accordance with the MDH guidance document, Assessing Well Vulnerability for Wellhead Protection (MDH, 1997). A well s vulnerability is scored based on the following six categories: DNR geologic sensitivity rating, casing integrity, casing depth, pumping rate, isolation distance from contaminant sources, and chemical and isotopic information. The assessment of geologic sensitivity is useful metric when estimating the relative vertical downward travel time of contaminants from grade level to the water table or source aquifer. A Level-3 DNR geologic sensitivity assessment was used for the City Wells. The Level-3 DNR geologic sensitivity rating is an empirical value determined by dividing the cumulative thickness of low permeability units above the aquifer by 10 (DNR, 1991). The resulting score is termed the L-score. A higher L-score indicates more low-permeability material above the aquifer, and therefore a lower vulnerability. A low L-score represents higher vulnerability. For example, a rating of L-1 has a higher vulnerability than L- 9, because there is less low-permeability material present above the aquifer. A Level-3 assessment was conducted since the aquifers are overlain by varying thicknesses of clay. As mentioned above, points
32 are also assigned to casing integrity and depth, pumping rate, isolation distance to contaminant sources, and chemical data, in addition to the geologic sensitivity. A Level-3 assessment was conducted for all CWI wells located in the vicinity of the DWSMA delineation. The geologic sensitivity L-scores were calculated by MDH using a Geographic Information System tool that utilizes lithology information from the MN CWI. Figure 11 illustrates the geologic sensitivity for the DWSMA as determined by mapping L-scores from the 8 well logs across the DWSMA and additional wells immediately outside the DWSMA. As a result, the geologic sensitivity in the vicinity of City Wells No. 3 and 4 is moderate (Figure 11). Sensitivity across the DWSMA ranges from very low to moderate. Vulnerability assessment rating sheets and vulnerability scores for Wells No. 3 and 4 were received from MDH and reviewed by LBG. 6.2 Assessment of the Drinking Water Supply Management Area Vulnerability In the proposed DWSMA, the groundwater that supplies the City wells is from the QBAA. This aquifer is overlain by significant glacial deposits consisting of till that provide protection from the vertical migration of contaminants from grade to the underlying QBAA. Once the geologic sensitivity was determined for wells in the DWSMA and for the area within the DWSMA, the vulnerability ratings could be determined. Since tritium has been detected above 1 Tritium Unit (TU) at Wells No. 3 and 4, the vulnerability rating in the vicinity of the City Wells and across the DWSMA has been increased by one level and ranges from low to high (Figure 12). 7. Recommendations Upon completion of this Part I WHP Plan amendment, the following recommendations are provided for the City to consider for better understanding the hydrogeologic conditions of the source aquifers and refinement of future WHPA delineations. 12 Obtain more area-specific hydraulic conductivity data in the area of the City Wells to reduce model uncertainty and potentially the size of the capture zones and DWSMA. This can be completed by conducting additional pumping tests on the City Wells or other existing high capacity wells. Collect samples of City Well water, surface water and precipitation and conduct stable isotope analyses of these to evaluate the mixture of surface water and groundwater. Continue collecting groundwater samples for analysis of regulated contaminants and provide the data to the MDH. Regularly measure groundwater levels east, southeast and south of the City wells to better understand flow directions. This could reduce model uncertainty and the size of the capture zones and potentially the DWSMA.
33 13 8. References Aquaveo, Groundwater Modeling System (GMS, version 9.0) [Computer Software], Provo, UT, Aquaveo, LLC. Geologic Sensitivity Project Workgroup (1991), Criteria and guidelines for assessing geologic sensitivity of ground water resources in Minnesota, Minnesota Department of Natural Resources, Division of Waters, St. Paul, Minn., 122 p. Harbaugh, A.W., 2005, MODFLOW-2005, the U.S. Geological Survey modular ground-water model - - the Ground-Water Flow Process: U.S. Geological Survey Techniques and Methods 6-A16, var. p. Minnesota Department of Health, Guidance for Delineating Wellhead Protection Areas in Fractured and Solution-Weather Bedrock in Minnesota, draft date August 29, Minnesota Department of Health (2010), Minnesota public land survey system quarter-quarter sections (derived from section corners), computer file, St. Paul, Minn. Metromodel 2.0, ( Minnesota Department of Health, Assessing Well and Aquifer Vulnerability for Wellhead Protection. Draft document, February 1997, pp. 23. Minnesota Department of Natural Resources, Criteria and Guidelines for Assessing Geologic Sensitivity of Ground Water Resources in Minnesota. Minnesota Department of Natural Resources. Minnesota Department of Natural Resources Appropriation Permit Program Website ( Minnesota Geologic Survey, Bedrock Geology and Structure of the Twin Cities Seven County Metropolitan Area, Map M-104. Pollock, D.W., 1994, User's Guide for MODPATH/MODPATH-PLOT, Version 3: A particle tracking post-processing package for MODFLOW, the U.S. Geological Survey finite-difference ground-water flow model: U.S. Geological Survey Open-File Report , 6 ch.
34 Figures
 > E Park St ST 93 750 ST 93 ST 112 760 > 740 ST 112 169 G ST 19 > > City Well > High Capacity Well ST 25 (201245) > BELLE")

35 212 ST ST 41 S Ash St BELLE PLAINE 4 (651697) BELLE PLAINE 3 (538038) > > 730 G:\GIS\Belle_Plaine_WHP\maps\g3belleplnwhp01a.mxd, 4/7/2014, 11:36:33 AM, NAD 1983 UTM Zone 15N BELLE PLAINE 1 (201245) > E Park St ST ST 93 ST > 740 ST G ST 19 > > City Well > High Capacity Well ST 25 (201245) > BELLE PLAINE 1 CWI Well Used in Groundwater Elevation Contours Local Model Domain Frontage Road 745 Groundwater Elevation Contour (ft amsl) GGroundwater Flow Direction Feet Source: Imagery from MnGeo WMS Server. MN County Well Index. >> >>> >>> ST 25 > > > Prepared By: LEGGETTE, BRASHEARS & GRAHAM, INC. Professional Groundwater and Environmental Engineering Services 8 Pine Tree Drive, Suite 250 St. Paul, Minnesota (651) G G (651697) > BELLE PLAINE 3 (538038) BELLE PLAINE 4 > > >>>> ST >> 740 >>>>> Miles ST >> >> ST 282 CITY OF BELLE PLAINE BELLE PLAINE, MINNESOTA County Metro Area Site SITE LOCATION, HIGH-CAPACITY WELLS, GROUNDWATER ELEVATION CONTOURS, AND LOCAL MODEL BOUNDARY FILE: g3belleplnwhp01a.mxd DATE: 4/7/2014 FIGURE: 1 ST 13
36 Mss Mss Ctc Ce Cm B > > A' Cj Cs A Ctc > Cw BELLE PLAINE 1 (201245) > > BELLE PLAINE 4 (651697) >> BELLE PLAINE 3 (538038) > Cw > Cm > Cs Ctc G:\GIS\Belle_Plaine_WHP\maps\g3belleplnwhp01b.mxd, 2/11/2014, 8:38:32 AM, NAD 1983 UTM Zone 15N Cw Mss > City Well > MN CWI Well Used in Cross Section Cj Cs Hydrogeologic Cross-Section Line Jordan Sandstone St. Lawrence Formation Source: Imagery from MnGeo WMS Server. MN County Well Index. Prepared By: LEGGETTE, BRASHEARS & GRAHAM, INC. Professional Groundwater and Environmental Engineering Services 8 Pine Tree Drive, Suite 250 St. Paul, Minnesota (651) > B' Tunnel City Group Ctc (Formerly Franconia Formation) Wonewoc Sandstone Cw (Formerly Ironton-Galesville Sandstone) Ce Eau Claire Formation Cm Mt. Simon Sandstone Mss Keweenawan Supergroup 0 2,000 Feet CITY OF BELLE PLAINE BELLE PLAINE, MINNESOTA 7-County Metro Area Site HYDROGEOLOGIC CROSS SECTION LOCATIONS AND BEDROCK GEOLOGY FILE: g3belleplnwhp01b.mxd DATE: 2/11/2014 FIGURE: 2
37 A Till Belle Plaine 1 (201245) Cross Section B-B' Belle Plaine 3 (538038) Belle Plaine 4 (651697) Till A' Outwash Outwash 780 Till Till 780 Elevation (ft amsl) 720 # 1987 Cj Cs D U Till? # # # 1987 Outwash Ctc # # 720 Elevation (ft amsl) G:\GIS\Belle_Plaine_WHP\maps\g3belleplnwhp01c - A-A.mxd, 5/29/2014, 1:25:10 PM, NAD 1983 StatePlane Minnesota South FIPS 2203 Feet ?? Ctc Cw Cm Outwash? Till Feet Screened Completed as 1 inch = 800 feet horizontal Interval Open Hole 1 inch = 60 feet vertical Note: Geologic contacts dashed where inferred. Cj Cs Ctc Till, Silt, Silty Clayey Sand Sand and Gravel Jordan Sandstone / St. Lawrence Formation Tunnel City Group (Formerly Franconia Formation) Cw Ce Cm Wonewoc Sandstone (Formerly Ironton-Galesville Sandstone) Eau Claire Formation Mt. Simon Sandstone Source: Geologic information from Minnesota County Well Index.? Till? Cm Prepared By: LEGGETTE, BRASHEARS & GRAHAM, INC. Professional Groundwater and Environmental Engineering Services 8 Pine Tree Drive, Suite 250 St. Paul, Minnesota (651) ?? Ce Cw HYDROGEOLOGIC CROSS-SECTION A-A' FILE: g3belleplnwhp01c - A-A.MXD DATE: 5/29/2014 FIGURE:? CITY OF BELLE PLAINE BELLE PLAINE, MINNESOTA
 720 # 1988 # 2000 2001 # # 1994 Till # 2001 # 1988 Till? 1999 # 720 Elevation (ft amsl) G:\GIS\Belle_Plaine_WHP\maps\g3belleplnwhp01d - B-B.")
38 B Cross Section A-A' Belle Plaine 4 (651697) Belle Plaine 3 (538038) B' ? Outwash Outwash? Till 780 Elevation (ft amsl) 720 # 1988 # # # 1994 Till # 2001 # 1988 Till? 1999 # 720 Elevation (ft amsl) G:\GIS\Belle_Plaine_WHP\maps\g3belleplnwhp01d - B-B.mxd, 5/29/2014, 1:25:20 PM, NAD 1983 StatePlane Minnesota South FIPS 2203 Feet ?? Till Cm? Outwash? Outwash? Cm Feet Screened Completed as 1 inch = 800 feet horizontal Interval Open Hole 1 inch = 60 feet vertical Note: Geologic contacts dashed where inferred. Till, Silt, Silty Clayey Sand Sand and Gravel Ce Cm Eau Claire Formation Mt. Simon Sandstone Source: Geologic information from Minnesota County Well Index.? Prepared By: LEGGETTE, BRASHEARS & GRAHAM, INC. Professional Groundwater and Environmental Engineering Services 8 Pine Tree Drive, Suite 250 St. Paul, Minnesota (651) Ce Outwash?? CITY OF BELLE PLAINE BELLE PLAINE, MINNESOTA HYDROGEOLOGIC CROSS-SECTION B-B' FILE: g3belleplnwhp01d - B-B.MXD DATE: 5/29/2014 FIGURE:
39 G:\GIS\Belle_Plaine_WHP\maps\g3belleplnwhp01e.mxd, 1/21/2014, 10:24:01 AM, NAD 1983 UTM Zone 15N > City Well Calibration Points Local Model Domain Modification Area. BELLE. PLAINE 1 (201245) BELLE PLAINE 3. (538038). BELLE PLAINE (651697). >>> Source: Imagery from MnGeo WMS Server. MN County Well Index. Prepared By: LEGGETTE, BRASHEARS & GRAHAM, INC. Professional Groundwater and Environmental Engineering Services 8 Pine Tree Drive, Suite 250 St. Paul, Minnesota (651) Miles CITY OF BELLE PLAINE BELLE PLAINE, MINNESOTA 7-County Metro Area Site LOCAL MODEL DOMAIN AND MODIFICATION AREA FILE: g3belleplnwhp01e.mxd DATE: 1/21/2014 FIGURE: 5
40 G:\GIS\Belle_Plaine_WHP\maps\g3belleplnwhp01f.mxd, 1/17/2014, 1:58:59 PM, NAD 1983 UTM Zone 15N Prepared By: LEGGETTE, BRASHEARS & GRAHAM, INC. Professional Groundwater and Environmental Engineering Services 8 Pine Tree Drive, Suite 250 St. Paul, Minnesota (651) CITY OF BELLE PLAINE BELLE PLAINE, MINNESOTA LOCAL MODEL CALIBRATION 7-County Metro Area Site FILE: g3belleplnwhp01f.mxd DATE: 1/17/2014 FIGURE: 6
41 > >> 725 >>>> > > 825 G > BELLE PLAINE 1 (201245) >>> > > >> > BELLE PLAINE 3 (538038) BELLE PLAINE 4 (651697) G 845 >>>>> > G >> >> 905 G:\GIS\Belle_Plaine_WHP\maps\g3belleplnwhp01g.mxd, 2/11/2014, 10:07:44 AM, NAD 1983 UTM Zone 15N 745 > > City Well > High Capacity Well G CWI Well Used in Groundwater Elevation Contours 745 Simulated Groundwater Equipotential Contour (ft amsl) GGroundwater Flow Direction Local Model Domain Source: Imagery from MnGeo WMS Server. MN County Well Index. Prepared By: LEGGETTE, BRASHEARS & GRAHAM, INC. Professional Groundwater and Environmental Engineering Services 8 Pine Tree Drive, Suite 250 St. Paul, Minnesota (651) Miles CITY OF BELLE PLAINE BELLE PLAINE, MINNESOTA 7-County Metro Area Site SIMULATED GROUNDWATER EQUIPOTENTIAL CONTOURS FILE: g3belleplnwhp01g.mxd DATE: 2/11/2014 FIGURE: 7
42 ST 25 S Meridian St E Main St BELLE PLAINE 1 (201245) > 169 BELLE PLAINE 4 (651697) >> BELLE PLAINE 3 (538038) G 7 G:\GIS\Belle_Plaine_WHP\maps\g3belleplnwhp01h.mxd, 4/7/2014, 11:39:29 AM, NAD 1983 UTM Zone 15N > City Well 1-Year Flowpaths - Quaternary Buried Confined Aquifer 5-Year Flowpaths - Quaternary Buried Confined Aquifer 10-Year Flowpaths - Quaternary Buried Confined Aquifer Source: Imagery from MnGeo WMS Server. MN County Well Index. Prepared By: LEGGETTE, BRASHEARS & GRAHAM, INC. Professional Groundwater and Environmental Engineering Services 8 Pine Tree Drive, Suite 250 St. Paul, Minnesota (651) ,000 Feet CITY OF BELLE PLAINE BELLE PLAINE, MINNESOTA 7-County Metro Area Site 1-, 5-, AND 10-YEAR FLOWPATHS FOR CALIBRATED MODEL FILE: g3belleplnwhp01h.mxd DATE: 4/7/2014 FIGURE: 8
 GGroundwater Flow Direction")
43 705 ST S Meridian St E Main St BELLE PLAINE 1 (201245) > 169 BELLE PLAINE 4 (651697) >> BELLE PLAINE 3 (538038) G G G:\GIS\Belle_Plaine_WHP\maps\g3belleplnwhp01i.mxd, 4/7/2014, 11:40:21 AM, NAD 1983 UTM Zone 15N G > City Well Uncertainty Analysis 10-Year Capture Zones 745 Simulated Groundwater Equipotential Contour (ft amsl) GGroundwater Flow Direction Uncertainty Analysis Flow Direction Uncertainty Area Source: Imagery from MnGeo WMS Server. MN County Well Index. Prepared By: LEGGETTE, BRASHEARS & GRAHAM, INC. Professional Groundwater and Environmental Engineering Services 8 Pine Tree Drive, Suite 250 St. Paul, Minnesota (651) G ,000 Feet CITY OF BELLE PLAINE BELLE PLAINE, MINNESOTA UNCERTAINTY ANALYSIS - 10-YEAR CAPTURE ZONES AND FLOW DIRECTION UNCERTAINTY AREA FILE: g3belleplnwhp01i.mxd DATE: 4/7/2014 FIGURE: County Metro Area Site
44 BELLE PLAINE 1 (201245) S. Ash St. > E. Main St 225th St. W. BELLE PLAINE 4 (651697) >> BELLE PLAINE 3 (538038) Lago Bvld 1/2 Section, Sec. 7 1/4 Section, Sec. 7 S. Ash St. Section 8/9 Boundary Section 4/5 Boundary 1/4 Section, Sec. 8 1/4 Section, Sec. 8 G:\GIS\Belle_Plaine_WHP\maps\g3belleplnwhp01j.mxd, 5/27/2014, 4:09:29 PM, NAD 1983 UTM Zone 15N > City Well 1/4 Section, Sec. 18 Combined Wellhead Protection Area Drinking Water Supply Management Area (Delineated Based Roads and Section Boundaries) ERA (Emergency Response Area) IWMZ (Inner Wellhead Management Zone) 1/4 Section, Sec. 18 1/4 Section, Sec. 17 Source: Imagery from MnGeo WMS Server. MN County Well Index. Prepared By: LEGGETTE, BRASHEARS & GRAHAM, INC. Professional Groundwater and Environmental Engineering Services 8 Pine Tree Drive, Suite 250 St. Paul, Minnesota (651) /2 Section, Sec. 17 Section 8/17 Boundary 0 2,000 Feet CITY OF BELLE PLAINE BELLE PLAINE, MINNESOTA 7-County Metro Area Site COMBINED WELLHEAD PROTECTION AREA BOUNDARY AND DRINKING WATER SUPPLY MANAGEMENT AREA DELINEATION FILE: g3belleplnwhp01j.mxd DATE: 5/27/2014 FIGURE: 10
45 ST 25 ( ( ( (? ( (? S Meridian St E Main St BELLE PLAINE 1 (201245) ( 169 > ( BELLE ( PLAINE 4 (651697) ( >> ( BELLE PLAINE 3 (538038) ( ( ( ( ( ( ( ( ( ( G 7 ( ( ( ( ( ( G:\GIS\Belle_Plaine_WHP\maps\g3belleplnwhp01k.mxd, 5/29/2014, 3:45:02 PM, NAD 1983 UTM Zone 15N ( ( ( ( ( ( ( ( ( ( ( ( ( ( ( ( ( ( > City Well ( Domestic Well Combined Wellhead Protection Area Drinking Water Supply Management Area ( ( (? ( ( ( ( ( Source: Imagery from MnGeo WMS Server. MN County Well Index. Prepared By: LEGGETTE, BRASHEARS & GRAHAM, INC. Professional Groundwater and Environmental Engineering Services 8 Pine Tree Drive, Suite 250 St. Paul, Minnesota (651) ( ( Geologic Sensitivity ( High Sensitivity ( Moderate Sensitivity ( Low Sensitivity (L-Score: 1-4) ( Very Low Sensitivity (L-Score: >4) ( ( ( ( 0 2,000 Feet CITY OF BELLE PLAINE BELLE PLAINE, MINNESOTA DRINKING WATER SUPPLY MANAGEMENT AREA GEOLOGIC SENSITIVITY ASSESSMENT FILE: g3belleplnwhp01k.mxd DATE: 5/29/2014 FIGURE: 11 ( 7-County Metro Area Site
46 ST 25 S Meridian St E Main St BELLE PLAINE 1 (201245) 169 > BELLE PLAINE 4 (651697) >> BELLE PLAINE 3 (538038) G 7 G:\GIS\Belle_Plaine_WHP\maps\g3belleplnwhp01l.mxd, 5/29/2014, 3:40:02 PM, NAD 1983 UTM Zone 15N > City Well Combined Wellhead Protection Area Drinking Water Supply Management Area DWSMA Vulnerability Very High High Moderate Low Source: Imagery from MnGeo WMS Server. MN County Well Index. Prepared By: LEGGETTE, BRASHEARS & GRAHAM, INC. Professional Groundwater and Environmental Engineering Services 8 Pine Tree Drive, Suite 250 St. Paul, Minnesota (651) ,000 Feet CITY OF BELLE PLAINE BELLE PLAINE, MINNESOTA DRINKING WATER SUPPLY MANAGEMENT AREA VULNERABILITY ASSESSMENT 7-County Metro Area Site FILE: g3belleplnwhp01l.mxd DATE: 5/29/2014 FIGURE: 12
47 ST 25 E Main St BELLE PLAINE 1 (201245) > BELLE PLAINE 4 (651697) >> BELLE PLAINE 3 (538038) 169 G 7 G:\GIS\Belle_Plaine_WHP\maps\g3belleplnwhp01m.mxd, 4/7/2014, 11:44:42 AM, NAD 1983 UTM Zone 15N > City Well 2003 Drinking Water Supply Management Area 2014 Drinking Water Supply Management Area Source: Imagery from MnGeo WMS Server. MN County Well Index. Prepared By: LEGGETTE, BRASHEARS & GRAHAM, INC. Professional Groundwater and Environmental Engineering Services 8 Pine Tree Drive, Suite 250 St. Paul, Minnesota (651) ,000 Feet CITY OF BELLE PLAINE BELLE PLAINE, MINNESOTA 7-County Metro Area Site EXISTING 2003 AND NEW 2014 DRINKING WATER SUPPLY MANAGEMENT AREAS FILE: g3belleplnwhp01m.mxd DATE: 4/7/2014 FIGURE: 13
48
49
50
51
52
53 APPENDIX II SCOPING 2 DECISION NOTICE AND DATA ELEMENTS Appendix II contains the Scoping 2 Decision Notice letter and the data elements that the letter requests. Prepared by: Bolton & Menk, Inc. Updated Belle Plaine Wellhead Protection Plan 2015
54
55
56
57
58
59
60
61
62
63
64
65
66
67
68
69
70
71
72
73
74
75
76
77
78 Precipitation Data Monthly precipitation data was gathered using the MNgage website ( There are 4 precipitation gages in the vicinity: one is a backyard sampling site (BYRG) and three are controlled by the Soil and Water Conservation District (SWCD). The BYRG gage is located in Township 113N, Range 24W, Section 7. The first SWCD gage is located in Township 113N, Range 24W, Section 5. The second SWCD gage is located in Township 113N, Range 25W, Section 13. The third SWCD gage is located in Township 112N, Range 26W, Section 12. Prepared by: Bolton & Menk, Inc. Updated Belle Plaine Wellhead Protection Plan 2015

79 HIgh DENsity radius retrieval Page 1 of 2 1/21/2015 Minnesota Climatology Working Group State Climatology Office - DNR Division of Ecological and Water Resources University of Minnesota home current conditions journal past data summaries agriculture other sites contact us search Nearest Station Precipitation Data Retrieval Minnesota's precipitation data archive is searched for data closest to a selected target location for each month. Values from the site closest to the target location are returned below after clicking the retrieve monthly data or retrieve daily data buttons. The precipitation data are made up of measured rainfall and the measured liquid content of snowfall. Temperature, snowfall, and snow depth data from National Weather Service reporting stations are no longer retrieved from this application. To obtain those data, see our newest data retrieval tool (May 2014). National Weather Service precipitation data continue to be available from this application. Obtaining data for legal purposes Guide for column headers in the data table target location: Scott-Belle plaine-belle Plaine 113N 24W S7 (latitude: longitude: ) click to select target location years: 2009 to 2015 number of missing days allowed per month: 3 retrieve monthly data retrieve daily data results: Target: T113 R24 S7 mon year cc tttn rrw ss nnnn oooooooo pre (inches) dis Jan N 24W 7 BYRG.61 0 mi. Feb N 24W 7 BYRG mi. Mar N 24W 7 BYRG mi. Apr N 24W 7 BYRG mi. May N 24W 7 BYRG mi. Jun N 24W 7 BYRG mi. Jul N 24W 7 BYRG.91 0 mi. Aug N 24W 7 BYRG mi. Sep N 24W 7 BYRG.53 0 mi. Oct N 24W 7 BYRG mi. Nov N 24W 7 BYRG.81 0 mi. Dec N 24W 7 BYRG mi. Jan N 24W 7 BYRG.73 0 mi. Feb N 24W 7 BYRG.87 0 mi. Mar N 24W 7 BYRG mi. Apr N 24W 7 BYRG mi. May N 24W 7 BYRG mi. Jun N 24W 7 BYRG mi. Jul N 24W 7 BYRG mi. Aug N 24W 7 BYRG mi. Sep N 24W 5 SWCD mi. Oct N 24W 7 BYRG mi. Nov N 24W 7 BYRG mi. Dec N 24W 7 BYRG mi. Jan N 24W 7 BYRG.67 0 mi. Feb N 24W 7 BYRG.99 0 mi. Mar N 24W 5 SWCD mi. Apr N 24W 5 SWCD mi. May N 24W 5 SWCD mi. Jun N 24W 5 SWCD mi. Jul N 25W 13 SWCD mi. Aug N 24W 5 SWCD mi. Sep N 24W 5 SWCD.37 0 mi. Oct N 25W 13 SWCD mi. Nov N 24W 5 SWCD Dec N 24W 5 SWCD mi. 0 mi.