DEMAND SIDE MANAGEMENT PROGRAM IN TANZANIA
|
|
|
- Quentin Jacobs
- 5 years ago
- Views:
Transcription

1 DEMAND SIDE MANAGEMENT PROGRAM IN TANZANIA Presentation to Workshop on Global Energy Efficiency Washington, DC 8 th March 2010 John Kabadi Tanzania Electric Supply Company Ltd. 1
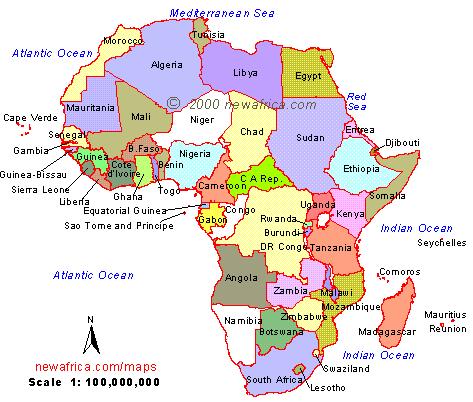

2 Introduction Location 2
3 Introduction cont. Tanzania is located between Longitude 29 o and 41 o East, and Latitude 1 o and 12 o South. It has Total Area of 945,000 km 2 Inland Water covers 59,050 km 2 of the total Area The capital city of the country is Dodoma ( Central Tanzania), while the Commercial capital is Dar es Salaam. The country is estimated to have 35 Million people (2002 census). Mainland 34 million, Zanzibar ~ 1 million. Population ratio, Male 16,829,861 and Female 17,613, 742. The total population consists of 136 Dialects United by Swahili Language.
4 Company Overview TANESCO is 100% state-owned and vertically integrated company TANESCO core business: to generate, transmit, distribute electricity in mainland and sell bulk power to Zanzibar Island Other businesses: to plan and implement various power investment projects government policy allowed private sector participation o o o Generation has attracted private sector participation 1997 TANESCO was specified for privatization after the 1992 policy and in under management contract Tanesco de-specified in 2005 to allow investments 4
5 Introduction Cont.. Bad hydrology for the last few years forced change in generation mix. TANESCO has faced time lags in the implementation of new capacity additions (Generation and Transmission). Shortage of Funds, mostly due to capacity and energy charges paid to Songas and IPTL. Dilapidated power infrastructures (Gen + Tras/Distr) Continued growth of demand for electricity than firmly available energy. Intermittent power shedding and rationing. N.B. MD 750MW Capacity Firm: 699 MW, Installed 1008 MW No Reserve Margin 5
6 Potential Resources S/ RESOURCE PROVEN TOTAL POTENTIAL DEVELOPED 1 Hydro Power 4,700MW, (firm Capacity (3,200) 12% (562 MW) 2 Natural gas Songosongo-30mill.m3, Mnazi Bay-15mill.m3 361 MW 3 Coal Million Tons (300 Million Tons at Kiwira Field). 0.04% /annum 4 Biomass wood 1.8 Billion, m3 2.2% /annum 5 Biomass residues - Crop residues= 15Million Tons/annum - Animal droppings=25million Tons/annum - Volatile solids of sisal waste= 0.2Million Tons/annum. - Forest residues=1.1 Million Tons/annum - About 1,000 biogas digester units of 50m MW electricity from steam and sisal plants MW from forest residues. 6 Wind Speed m/s 129 windmills (8.5kWp) (studies for electricity generation are being undertaken) 7 Solar Approximately 215 W/m2/day More than 2MWelect. 8 Geothermal There are indications of potential Studies are being undertaken. 9 Nuclear Uranium potential exists Exploration in progress 10 Tidal wave There are indications of potential Studies are being undertaken Identification footer with date 6
7 Salient Features The demand for electricity in Tanzania has been increasing rapidly due to the growing economic and due social conditions in the country. The projected growth of 10% per annum will bring this demand to approximately 1005MW in Drivers for the power demand growth include: TANESCO accelerated electrification program of connecting 100,000 new customers annually starting in the period of year 2007 to 2011; mining growth in the north-western part of Tanzania projected to be about 22% p.a. Regulatory & Legislative Environment Regulated by the Energy and Water Utilities Authority (EWURA) Reporting ministry: Ministry of Energy and Minerals 7

8 8
9 DSM Program 9
10 DSM Objectives Provide a cushion against hydrological risks Provide Industries/Factories with high Power Factor. Convince Industries/Factories use of efficient motors more reliable power supply systems Provide good timing and sequencing of new viable investments for the projects.
11 Background of DSM in Tanzania 1995 under ESMAP funds, TANESCO engaged a consultant to come up with the DSM program. 1995/1996, TANESCO carried out DSM program in major industries/factories. Activities looked at: 1. Power Factor correction 2. Efficient Motors 3. Use of CFL 1997 funds were depleted and the program paralyzed. N.B. 25MW were realized Identification footer with date 11
12 Future Demand Makadirio na Ukuaji wa Mahitaji ya Uwezo wa Kuzalisha Umeme Nchini : MW 7,000 6,000 Kagera-48MW, Lindi-11MW, Mtwara-18MW 2017 Uwezo (capacity) - Uniti za MW 5,000 4,000 3,000 2,000 1,000 - Pemba-6MW 2010 Kigoma-11MW 2016 Ruvuma-6MW Rukwa-16MW 2018 Mwaka MW
13 Short Term Generation Plan Year Plant Fuel Cogeneration Biogas 40 Capacity (MW) Cumulatve Capacity (MW) Demand (MW) 2011 Mwanza HFO 60 Ubungo Gas Kisasida Wind Kinyerezi Gas 240 Mnazi Bay Gas Kiwira Coal
14 Way forward It is noted that in there will be a power capacity gap if all projects are delayed as planned. This gap can only be removed/reduced if DSM program is revived. TANESCO has secured funds from IFC to engage a consultant who will advise TANESCO on DSM power station units that will be made up of DSM technologies rolled out as technology matures and enough verification methods developed. Initially will be made up of CFL s, Commercial Lighting (retrofits), Solar Water Heating are aimed at hardwiring the energy savings into the grid. Switching from traditional light bulbs to CFLs is an effective, accessible change that TANESCO can make to reduce energy use at home and prevent greenhouse gas emissions that contribute to global climate change. Advise CFL standards to be used as the one with relative ease of implementation, Use of renewable energy in street lighting Disposal of replaced incandescent lamps.

15

16 Questions 16


17 Thank You - Ahsante Identification footer with date 17