The State of the Aquifer Report
|
|
|
- Bennett Flynn
- 5 years ago
- Views:
Transcription
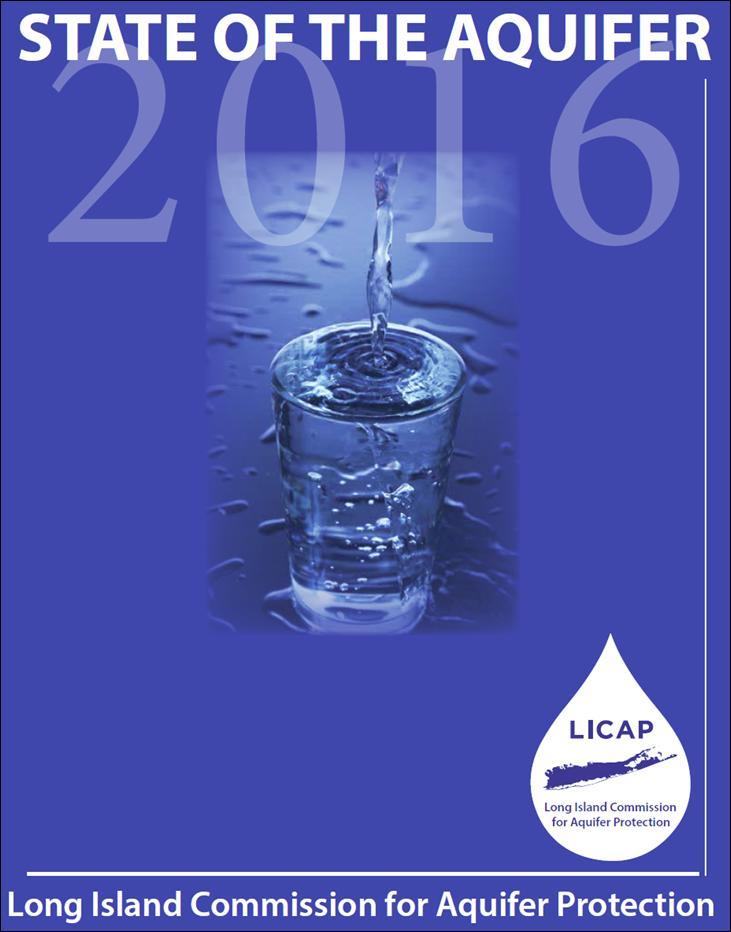
1 The State of the Aquifer Report presented by the Long Island Commission for Aquifer Protection (LICAP) October, 2016 Steven Colabufo, C.P.G. Water Resources Manager Suffolk County Water Authority
2 What is LICAP? The Long Island Commission for Aquifer Protection (LICAP) is a bi-county entity LICAP was formed to address both quality and quantity issues facing Long Island s aquifer system LICAP s two major goals are to produce an annual State of the Aquifer Report and develop a Groundwater Resources Management Plan LICAP was created through legislation passed by both the Nassau and Suffolk legislatures in 2013
3 LICAP encompasses: What is LICAP? Every water provider in Nassau and Suffolk, both public and private, serving over a combined 3 million Long Island residents Nassau and Suffolk County Executive Nassau and Suffolk County Legislatures Nassau and Suffolk County Health Departments New York State Department of Environmental Conservation United States Geological Survey


4 Participating agencies within LICAP


5 LICAP Voting Members Frank Koch, Chairman, Long Island Water Conference Stan Carey Vice-Chairman, Nassau-Suffolk Water Commissioners Association Jeffrey Szabo Suffolk County Water Authority Walter Dawydiak Suffolk County Commissioner of Health Dorian Dale Suffolk County Executive Brian Schneider Nassau County Executive Don Irwin Nassau County Commissioner of Health Michael White Suffolk County Legislature Presiding Officer Chris Ostuni Nassau County Legislature Presiding Officer
6 LICAP Members Legislative Sponsors Dr. William Spencer, Suffolk County Legislator, 18th District Norma Gonsalves, Nassau County Legislature Presiding Officer Ex-Officio Members (non-voting) Kevin J. McCaffrey Suffolk County Legislature Minority Leader Sarah Meyland Nassau County Legislature Minority Leader Jared Hershkowitz Suffolk County Legislature Presiding Officer Gilbert Anderson, P.E. Suffolk County Commissioner of Public Works Nick Gibbons Suffolk County Commissioner of Parks, Recreation and Conservation Michael Comerford Nassau County Commissioner of Parks Satish Sood Nassau County Planning Commission Carrie Meek Gallagher New York State Department of Environmental Conservation Stephen Terracciano U.S. Geological Survey Long Island Program Office Henry Bokuniewicz LIGRI (Long Island Groundwater Research Institute) SUNY Stony Brook: School of Marine and Atmospheric Sciences
7 LICAP Subcommittees 1) 2040 Water Resources & Infrastructure Develops plan to identify long-term risks to the water supply industry 2) Water Resources Opportunities Looks at potential short-term risks facing water suppliers, treatment and distribution of potable water from our sole source aquifer
8 Groundwater Resources Management Plan Includes qualitative and quantitative groundwater data and threats to groundwater. Assesses existing groundwater management regulations. Includes management opportunities and provides recommendations with strategies to implement them. Recommends regulatory amendments, Includes an implementation program with stakeholders roles and responsibilities. Propose recommendations for action
9
10 State of the Aquifer Report This report includes aquifer use history, groundwater principles and current environmental, quality and quantity conditions The report will be updated annually A draft of the 2016 report is available now by going to liaquifercommission.com The 2016 draft report is currently accessible for public input The final version of the 2016 State of the Aquifer report is expected to be published later this year

11 State of the Aquifer Report Potable water provided and regulated by the following: -50+ public water suppliers -Nassau and Suffolk County Health Departments -New York State Department of Environmental Conservation -United States Environmental Protection Agency
12 State of the Aquifer Report Topics covered include: Groundwater Basics Groundwater occurrence The Water Cycle Water quantity, water use and conservation Land Use Impacts, Source Water Protection Testing and Regulation Water Quality Issues Regional Sewering vs. On-site Septic

13 Where does our water come from? North shore South Shore Upper Glacial aquifer Magothy aquifer Bedrock 3 principal aquifers: unconsolidated sand and gravel Estimated 65 trillion gallons stored within Long Island s aquifers (only 10% can be extracted) All groundwater derived from precipitation no other sources Designated a Sole source aquifer EPA

14 Recharge 1 mgd per sq. mile The Water Cycle

15 Water use on Long Island Public Supply Well fields on Long Island
16 Gallons per Minute Seasonal Water Use - SCWA 500, ,000 gpm The Irrigation Situation Summer 400,000 weekend 300,000 Rainy summer day 200,000 weekday 100,000 Winter 25,000 gpm 0 0:00 1:00 2:00 3:00 4:00 5:00 6:00 7:00 8:00 9:0010:0011:0012:0013:0014:0015:0016:0017:0018:0019:0020:0021:0022:0023:000:00 Time Winter Spring Summer Weekend Summer Weekday Summer Rain Autumn

17 Land Use Impacts on Groundwater Quality Contaminant Signatures Agriculture, Parks, and Golf Courses- Nitrate, pesticides, herbicides Industrial - VOCs Landfills Residential - sewered STP disch., Nitrate Residential - unsewered Nitrate, pesticides, VOCs DENSITY IS IMPORTANT Commercial VOCs Road runoff Chlorides, MTBE, BTEX Service Sta. BTEX, MTBE
18 milligrams per liter Land Use and Water Quality Nitrogen Impacts Comparative Nitrogen Impacts 14 Average Nitrogen Impacts for Selected Land Uses Agriculture (row crops) Vineyards 1/2 2 acre DU/ac lots 11 acre DU/ac lots Golf 12 DU/2 acre lots ac Open Courses Spaces Residential Unsewered

19 Real world Scenario Contributing Areas Shallow v. Deep Wells: Water Table Upper Glacial Aquifer Magothy Aquifer Raritan Clay Confining Unit Lloyd Aquifer


20 Land Use and Water Quality Source Water Assessment and Protection (SWAP) Cont. area to 1 specific SCWA well under long term average conditions for different time intervals: 5 to 100 years well field location
 GIS coverage showing Public Supply well fields Medford, Suffolk")
21 Land Use and Water Quality Source Water Assessment and Protection (SWAP) GIS coverage showing Public Supply well fields Medford, Suffolk County

22 Land Use and Water Quality Source Water Assessment and Protection (SWAP) Public Supply well fields With 100 yr. travel time Capture zones for ALL area well fields Cap. zones often detached from well field
")
23 Testing and Regulation Public Water Suppliers are required to test for at least 140 compounds some suppliers test for much more (i.e. SCWA: over 300)
24 General Water Quality Issues in SOTA Chloride contamination: Lateral salt water intrusion (western Nassau) Upconing (eastern Suffolk) Road salting Volatile Organic Compounds (VOCs) PCPPs Nitrogen Groundwater, Surface Water Impacts, Human Health Pesticides Emerging Contaminants


25 Chloride Contamination: Lateral Salt Water Intrusion Nassau County slow landward movement of sea water due to over pumping Great Neck Manhasset Neck Areas where salt water intrusion has occurred


26 Chloride Contamination: Salt Water Upconing Eastern Suffolk County rapid response to individual well pumping Actual Chloride vs. Pumping data for SCWA well in Montauk conceptual diagram of upconing beneath an individual pumping well.

27 Chloride Contamination: Road Salting - Elevated chloride levels in non-coastal locations - Road salt has a different chemical signature than seawater
28 USGS Real Time Road Salt Impact Monitoring Station - Peconic Specific Conductance Spec. conductance of seawater = 50,000
")
 Adsorption GAC vessels")
29 Treatment for Volatile Organic Compounds (VOCs) Granular Activated Carbon (GAC) Adsorption GAC vessels Carbon media


30 Treatment for Volatile Organic Compounds VOCs Packed Tower Aeration or Air Stripping Stripping Tower Packing material inside tower

31 Water Quality Mapping: WaterTraq example: Nitrate Public Supply wells with Nitrate levels Greater than 10 mg/l

32 Water Quality vs. Quantity: Regional Sewering vs. On-Site Septic Systems Sewered areas in Nassau and Suffolk Counties
33 Nitrate and Surface Water Impacts Effects of Regional Sewering south shore Nassau Discharge (quantity) decreasing w/ time Nitrate levels (quality) improving w/ time
34 Nitrate and Surface Water Impacts Effects in an unsewered area central Suffolk Discharge (quantity) stable w/ time Nitrate levels (quality) Increasing w/ time

35 Grumman - Navy Groundwater Plume Direction of g.w. flow Public Supply well fields

36 Pesticides - Mainly in Eastern Suffolk Suffolk County - historically number one county for agriculture in New York State. Over 20,000 acres of agricultural land Currently, 27 of 56 SCWA wells on the North Fork are on treatment for pesticide contamination
37 Concluding Thoughts... The quality of drinking water supplied to Long Islanders is excellent, meeting or exceeding all state and federal standards However, the aquifer does face challenges Past and present industrial, commercial and residential land use activities have impacted groundwater and surface water Some of these activities can threaten drinking water sources Others threaten environmental resources wetlands, bay, streams
38 Concluding Thoughts... Specific contaminants present potential health risks to drinking water ex: Saltwater, VOCs, PPCPs, Nitrates and new emerging contaminants Public water suppliers are required by law to meet standards for all contaminants - LICAP is addressing these concerns by continuing to research and develop new treatment methods for contaminants, and by implementing Water Quality Mapping


39 liaquifercommission.com ny.water.usgs.gov/projects/sota Written correspondence may be addressed to: LICAP 4060 Sunrise Hwy Oakdale, NY and phone: (631) (631)