Water Operations Report. Namoi-Peel Valleys June 2018
|
|
|
- Olivia West
- 5 years ago
- Views:
Transcription


1 Water Operations Report Namoi-Peel Valleys June 2018
2 Dam storages 110% 100% Keepit Dam storage 2013/ / / / /18 90% 80% 70% 60% 50% 40% 30% 20% 10% 0% Jul Aug Sep Oct Nov Dec Jan Feb Mar Apr May Jun 2
3 Dam storages 100% Split Rock Dam storage 2013/ / / / /18 90% 80% 70% 60% 50% 40% 30% 20% 10% 0% Jul Aug Sep Oct Nov Dec Jan Feb Mar Apr May Jun 3
4 Dam storages 110% 100% Chaffey Dam storage 2013/ / / / /18 90% 80% 70% 60% 50% 40% 30% 20% 10% 0% Jul Aug Sep Oct Nov Dec Jan Feb Mar Apr May Jun 4
5 Supplementary access No access to date in 2017/18. 5
6 2017/18 water availability for Lower Namoi Valley Share AWD Carryover Allocation Allocation assignments Licence category component Balance volume in assignments in out Usage DOMESTIC AND STOCK 1, , DOMESTIC AND STOCK [DOMESTIC] DOMESTIC AND STOCK [STOCK] LOCAL WATER UTILITY 2,271 2,271 2, REGULATED RIVER (GENERAL SECURITY) 245, , , , , , ,260.7 REGULATED RIVER (HIGH SECURITY) 3, , ,335 REGULATED RIVER (HIGH SECURITY) [RESEARCH] SUPPLEMENTARY WATER 115, , , GRAND TOTAL 369, , , , , , ,090 General security available water determination Date AWD ML/Share Total % 7-Aug % 5,255 ML transferred from Upper to Lower this water year. 6
7 2017/18 water availability for Upper Namoi Valley Share AWD Carryover Allocation Allocation assignments Licence category component Balance volume in assignments In out Usage DOMESTIC AND STOCK DOMESTIC AND STOCK [DOMESTIC] DOMESTIC AND STOCK [STOCK] LOCAL WATER UTILITY REGULATED RIVER (GENERAL SECURITY) , , ,889.1 REGULATED RIVER (HIGH SECURITY) GRAND TOTAL 11, , , , ,122.1 General security available water determination Date AWD ML/Share Total % 1-Jul % 7
8 2017/18 water availability for Peel Valley Share AWD Carryover Allocation Allocation assignments Licence category component Balance volume in assignments In out Usage DOMESTIC AND STOCK DOMESTIC AND STOCK [DOMESTIC] DOMESTIC AND STOCK [STOCK] LOCAL WATER UTILITY 16,400 9, , REGULATED RIVER (GENERAL SECURITY) 29,590 19, , ,899 2, ,878.4 REGULATED RIVER (HIGH SECURITY) REGULATED RIVER (HIGH SECURITY) [RESEARCH] GRAND TOTAL 46,957 29, , ,899 2, ,162 General security available water determination Date AWD ML/Share Total % 1-Jul % ML transferred from the Peel to the Lower Namoi 8
9 2017/18 water availability for Namoi Valley Namoi Valley - storage breakdown (GL) April Keepit GL 13.0% Split Rock GL 15.2% Storage Losses Storage Losses shortfall Essential Supplies Essential Supplies shortfall Upper Namoi / Manilla River Delivery Losses Delivery Losses shortfall General Security Irrigation Total shortfall GL 9
10 Resource assessment Namoi Valley resource assessment - Keepit / Split Rock Dams 30-Apr Mar Feb Jan Dec Nov Oct Sep Aug Jul Jun-17 STORAGE VOLUME LESS DEAD STORAGE LESS STORAGE LOSS LESS ESSENTIAL SUPPLIES LESS DELIVERY LOSS LESS GENERAL SECURITY ALLOCATION %

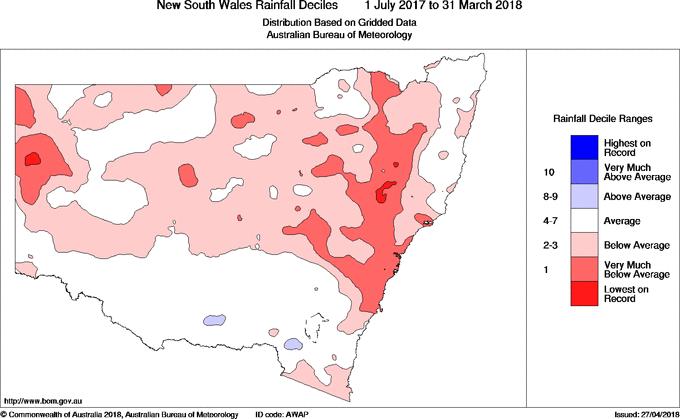
11 9 month rainfall 11
12 Keepit Dam inflows GL Keepit past 6 months inflows/statistical inflows Actual inflow 20%ile 50%ile 80%ile Minimum Inflow for the 6 months is approximately 56 GL although this includes gauging error and BWT. Inflow excluding BWT and gauging error was roughly 3 GL which is less than half of 95 th percentile inflows of 6.6 GL (minimum is 0.3 GL) 0 Nov-17 Dec-17 Jan-18 Feb-18 Mar-18 Apr-18 Adjusted inflow for the 24 months is 479 GL just below 50 th percentile(520 GL); while the minimum is 61 GL. GL Keepit past 24 months inflows/statistical inflows May-16 Jul-16 Actual inflow 20%ile 50%ile 80%ile Minimum Sep-16 Nov-16 Jan-17 Mar-17 May-17 Jul-17 Sep-17 Nov-17 Jan-18 Mar-18 12
13 Split Rock Dam inflows GL Split Rock past 6 months inflows/statistical inflows Actual inflow 20%ile 50%ile 80%ile Minimum Inflows are consistent with rainfall over the past 6 month period. Actual inflow for the 6 months is 1.3 GL in line with 95 th percentile inflows (2.1 GL); while the minimum is 0.4 GL. 0 Nov-17 Dec-17 Jan-18 Feb-18 Mar-18 Apr-18 Inflows are consistent with rainfall over the past 24 month period. Actual inflow for the 24 months is 126 GL in line with 50 th percentile(101 GL); while the minimum is 11 GL. GL Split Rock past 24 months inflows/statistical inflows Actual inflow 20%ile 50%ile 80%ile Minimum May-16 Jul-16 Sep-16 Nov-16 Jan-17 Mar-17 May-17 Jul-17 Sep-17 Nov-17 Jan-18 Mar-18 13
14 Chaffey Dam inflows GL Chaffey past 6 months inflows/statistical inflows Actual inflow 20%ile 50%ile 80%ile Minimum Inflows are consistent with rainfall over the past 6 month period. Actual inflow for the 6 months is 2 GL just above minimum (1.2 GL) 0 Nov Dec Jan Feb Mar Apr Inflows are consistent with rainfall over the past 24 month period. Actual inflow for the 24 months is 108 GL just above 50 th percentile (93 GL); while the minimum is 16 GL. GL Chaffey past 24 months inflows/statistical inflows Actual inflow 20%ile 50%ile 80%ile Minimum 14
15 Operational loss Operational surplus is water above that which could reasonably be expected (flow about 20 ML/day) to pass the last extraction point on each given river/creek being supplied with regulated flow (dam releases and controlled tributary inflows not supplementary flows). 6% 5% 4% 3% 2% 1% 0% Operational Surplus / Sales (%) Namoi River - water delivery operational surplus vs sales cumulative % (regulated licenced is included in sales) Target below 5% Namoi cumulative totals Sales + environmental Operational delivery surplus Actual Target July % 5% July-Aug 1, % 5% July-Sep 5, % 5% July-Oct 23, % 5% July-Nov 37, % 5% July-Dec 75, % 5% July-Jan 138, % 5% July-Feb 166,774 1,265 1% 5% July-Mar 168,190 1,265 1% 5% July-Apr 176,640 1,265 0% 5% July-May 0% 5% July-Jun 0% 5% 15
16 Storage forecast Keepit forecast storage volume Actual Minimum 99% COE DRY 80% COE Median 50% COE WET 20% COE Gigalitres (GL) May-17 Jul-17 Aug-17 Sep-17 Oct-17 Nov-17 Dec-17 Jan-18 Feb-18 Mar-18 Apr-18 May-18 Jun-18 Jul-18 Aug-18 Sep-18 Oct-18 Nov-18 Dec-18 Jan-19 Feb-19 Mar-19 Apr-19 May-19 Jun-19 Jul-19 Aug-19 Sep-19 Oct-19 Nov-19 Dec-19 Jan-20 Feb-20 Mar-20 Apr-20 Expected deliveries of 172 GL throughout 2017/18 under minimum and dry conditions. Start of water year forecast was 198 GL. 16
17 Storage forecast Split Rock - forecast storage volume Actual Minimum 99% COE DRY 80% COE Median 50% COE WET 20% COE Gigalitres (GL) May-17 Jul-17 Aug-17 Sep-17 Oct-17 Nov-17 Dec-17 Jan-18 Feb-18 Mar-18 Apr-18 May-18 Jun-18 Jul-18 Aug-18 Sep-18 Oct-18 Nov-18 Dec-18 Jan-19 Feb-19 Mar-19 Apr-19 May-19 Jun-19 Jul-19 Aug-19 Sep-19 Oct-19 Nov-19 Dec-19 Jan-20 Feb-20 Mar-20 Apr-20 Expected deliveries of 6 GL (Upper Namoi) and a BWT of approximately 46 GL throughout 2017/18 under minimum conditions, this is a reduction from 60 GL. 17
18 Bulk water transfer Split Rock planned and actual releases Actual Planned 60GL ML/day
19 Storage Forecast Chaffey Dam - forecast storage volume actual Minimum 99% COE DRY 80% COE Median 50% COE WET 20% COE May-17 Jul-17 Aug-17 Sep-17 Oct-17 Nov-17 Dec-17 Jan-18 Feb-18 Mar-18 Apr-18 May-18 Jun-18 Jul-18 Aug-18 Sep-18 Oct-18 Nov-18 Dec-18 Jan-19 Feb-19 Mar-19 Apr-19 May-19 Jun-19 Jul-19 Aug-19 Sep-19 Oct-19 Nov-19 Dec-19 Jan-20 Feb-20 Mar-20 Apr-20 Expected deliveries of 20GL (10GL TW/ 9 to 10GL GS) throughout 2017/18 under minimum and dry conditions. Additional usage of up to 5GL Environmental Contingency Allowance. 19
20 System operations plan Intermittent 4-6 weekly deliveries for mining enterprises will continue. Peel environmental deliveries of combined general security and ECA of about 4 GL is expected to commence late May/early June. Keepit releases will be made to assist in pushing Peel water to Walgett on the Namoi. Additional Keepit water may also be utilised to supply a riparian/stock and domestic flow to the Pian creek. Complete block releases strategy for 2018/19 deliveries downstream of mining enterprises. Supply on demand for the Upper Namoi and Peel Valleys. 20

21 Prognosis Extremely dry Dry Average Wet Minimum inflows 80th percentile inflows 50th percentile inflows 20th percentile inflows 3 month forecast to 31-Jul-18 6 month forecast to 31-Oct % 0.0% 0.0% 21.8% 0.0% 0.0% 18.9% 76.1% 21