MANUFACTURING SECTOR S GROWTH SLOWS
|
|
|
- Nelson Bradford
- 5 years ago
- Views:
Transcription


1 A. Gary Anderson Center for Economic Research For Release: Contact: Raymond Sfeir Professor of Economics and Research Fellow (714) MANUFACTURING SECTOR S GROWTH SLOWS ORANGE, CA According to a survey of purchasing managers, the California manufacturing economy is expected to expand further in the first quarter of 2018 albeit at a lower rate. The California Composite Index, measuring overall manufacturing activity, decreased from 64.9 in the fourth quarter of 2017 to 61.8 in the first quarter of 2018, indicating slower growth. Production, inventories of purchased materials, new orders and employment are expected to grow at a lower rate. Supplier deliveries will not slow as much as in the fourth quarter of 2017 and commodity prices are expected to reach the highest level since the third quarter of 2011.
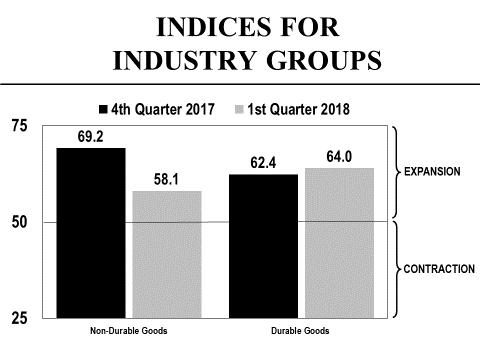
2 California Manufacturing at a Glance Composite Index 61.8 Growing at a slower rate Production 66.2 Growing at a slower rate Inventories of 58.0 Growing at a slower rate purchased materials Commodity prices 76.2 Rising at a higher rate Supplier deliveries 55.6 Slowing at a slower rate New orders 65.4 Growing at a slower rate Employment 57.6 Growing at a slower rate Performance by Industry Group The index for the non-durable goods industries dropped from 69.2 in the fourth quarter of 2017 to 58.1 in the first quarter of 2018, indicating a lower rate of growth in the first quarter of this year. Production, inventories of purchased materials, new orders and employment are expected to increase at a lower rate in the first quarter of this year. Commodity prices are not expected to increase. After reaching the highest level since 2002, the index has retreated substantially. The index for the durable goods industries increased from 62.4 in the fourth quarter of 2017 to 64.0 in the first quarter of 2018, indicating a higher rate of growth in the first quarter of this year. Production, inventories of purchased materials, commodity prices, and new orders increased at a higher rate in the first quarter of this year. The new orders index has reached the highest level since we started computing the index in the second quarter of Comments by the Purchasing Managers Q4 is our 'season' and we anticipate a moderate Q1. (Food) Continued cost increases in raw materials, labor and overhead. We will also be raising our prices. (Textile Mill Products) Due to continuous increase in costs across the board for raw materials, health insurance, min wage increases, etc., we are closing down our manufacturing plant in California after 30 years of operation. We will now be subcontracting to another local manufacture to reduce costs and liability associated with running a plant. We predict our distribution facilities that will remain operational will be more profitable come 2018, since the profit margin will not be drained by the supplementing of a failing manufacturing facility. (Wood Products) Coming into our busy season. Expect employment to rise because of number of openings and challenges to fill them. Net headcount will be as budgeted. Business is ok, not overly robust. Margins weak as competition is scrambling to build their backlogs. (Paper) Experiencing continued weak demand in all areas as clients continue to downsize and consolidate marketing operations. As a result we're tightening inventories and considering downsizing [again] in Q to bring production capabilities in line with current demand. Q4 turned out to be far below our expectations earlier in the year. In the meantime raw materials [paper, ink] continue to experience price increases. (Printing & Related Support Activities) 2
3 Biotech is starting to pick-up but customers are very cautious committing to repeat business. (Chemicals) Q1 tends to be our busiest every year. (Plastics & Rubber Products) Construction boom in greater Bay Area continues, with demand for housing, commercial and infrastructure leading the way. Delivery service should improve with increase in production staff and addition of new equipment. Raw material supply continues to be a challenge as reliance on 3rd party trucking impacts control, but acquisition of an aggregate source looks to improve supply chain. Pushing for price increases while demand remains strong. (Nonmetallic Mineral Products) We are still suffering from a shortage of labor due to the lower unemployment rate in our region. (Primary Metals) Higher energy costs should drive up some commodity prices. We are making a business decision right now to increase inventories as we about to switch to a new ERP software system. As we expect issues to develop, we are building inventory as a buffer against those expected problems. (Fabricated Metal Products) The Chapman Economic Forecast gave some great insight. While we prefer more optimism, facts are facts, slow steady growth is better than none. We have stabilized. We expect turnover to be very small in the next quarter and because of the holidays we anticipate slower deliveries going into 1Q18. We already have received multiple January price increase notices and even a couple for February. (Machinery) Even with existing open purchase orders, local and state government not using it to order. (Computer & Electronic Products) Our biggest problem is low pricing from China, but we were able to have 12% growth this year, so the electronics business is holding up. (Electrical Equipment, Appliance & Components) Will expect material prices to increase on common aluminum sheet & stainless steel sheet & 4 quarters have gone up about 15% and will go up more. Government crack on China material dumping. (Transportation Equipment) We're cautiously optimistic but there are many challenges in California that continue to drag us down. Our state leadership do everything they can to destroy business so we can only be so successful... High taxes, gas prices and insurance costs that go along with all the regulations that we have make us want to move to a more business friendly state. (Miscellaneous) We are seeing an increase on government orders that's why our production is increasing, commercial orders are steady (in the + side). (Aerospace Products & Parts) 3
4 4
5 Background and methodology The Institute for Supply Management (ISM) conducts a monthly national survey of purchasing managers and publishes the survey results in its Report on Business. Such a survey is not available for the state of California. Given the size of our state, and the major role its manufacturing sector plays in the national economy, the A. Gary Anderson Center for Economic Research at Chapman University launched a quarterly survey of California purchasing managers starting in the third quarter of Similar to the ISM survey, our survey tracks changes in production, employment, new orders, inventories of purchased materials, commodity prices and supplier deliveries. Except for commodity prices and inventories of purchased materials, a seasonally adjusted index is computed for each variable. In order to have one single indicator for the performance of the state manufacturing sector, the Anderson Center has developed a Composite Index that is a weighted average of the underlying indices. A value of 50 for the Composite Index shows a general expansion of the manufacturing economy of the state and a value below 50 shows a decline. The industries are classified according to the North American Industry Classification System (NAICS). 5
6 Detailed Results of the Survey of California Purchasing Managers Expectations for the First Quarter of 2018 In its attempt to present you with a better delivery of the survey results, the A. Gary Anderson Center for Economic Research has calculated an index for every variable in the survey. The "% Better," is added to half of the "% Same," after which a seasonal factor is used to get a seasonally adjusted index for each variable (except commodity prices). A value over 50 for an index indicates growth and a value below 50 indicates a decline. If for example the index increases from 55 to 59, we say that the growth rate is higher than the previous quarter because 59 is bigger than 55. If the index remains at 55, we say that the growth rate remains the same as the previous quarter. If the index decreases from 55 to 52, we say that we still have growth but that the growth rate is lower than the previous quarter because 52 is smaller than 55. Each industry in the manufacturing sector is represented in the survey based on its employment share of total manufacturing employment in the state. Production: The seasonally adjusted index for production is expected to decrease from 69.5 in the fourth quarter of 2017 to 66.2 in the first quarter of 2018, indicating that production is expected to increase at a lower rate in the first quarter of this year. This is the thirty fifth consecutive quarter that the production index has been above 50. Production is expected to increase most rapidly in the following industries: Textile Mill Products; Paper; Printing & Related Support Activities; Chemicals; Plastics & Rubber Products; Nonmetallic Mineral Products; Primary Metals; Fabricated Metal Products; Machinery; Computer & Electronic Products; Electrical Equipment, Appliance & Components; Transportation Equipment; Furniture & Related Products; and Miscellaneous. Production % Higher % Same % Lower Net Seasonally Adjusted Index 1 st Quarter of th Quarter of rd Quarter of nd Quarter of Inventories of Purchased Materials: The seasonally adjusted index for inventories of purchased materials is expected to decrease from 62.4 in the fourth quarter of 2017 to 58.0 in the first quarter of 2018, indicating that inventories are expected to increase at a lower rate in the first quarter of this year. Inventories of purchased materials are expected to increase most rapidly in the following industries: Apparel; Paper; Chemicals; Nonmetallic Mineral Products; Fabricated Metal Products; Machinery; Computer & Electronic Products; Furniture & Related Products; and Miscellaneous. The Food industry has reported an expected decrease in inventories of purchased materials. Inventories of Purchased Materials % Higher % Same % Lower Net Seasonally Adjusted Index 1 st Quarter of th Quarter of rd Quarter of nd Quarter of
7 Commodity Prices: The seasonally unadjusted index for commodity prices is expected to increase from 72.7 in the fourth quarter of 2017 to 76.2 in the first quarter of 2018, indicating that commodity prices are expected to rise at a higher rate in the first quarter of this year. This the highest value for the index since the third quarter of Commodity prices are expected to increase most rapidly in the following industries: Food; Textile Mill Products; Apparel; Paper; Printing & Related Support Activities; Chemicals; Plastics & Rubber Products; Wood Products; Nonmetallic Mineral Products; Primary Metals; Fabricated Metal Products; Machinery; Computer & Electronic Products; Electrical Equipment, Appliance & Components; Transportation Equipment; Furniture & Related Products; and Miscellaneous. No industry reported an expected decrease in commodity prices. Commodity Prices % Higher % Same % Lower Net Index 1 st Quarter of th Quarter of rd Quarter of nd Quarter of Supplier Deliveries: For this variable, an index value over 50 indicates slower deliveries, and an index value under 50 indicates faster deliveries. The seasonally adjusted index for supplier deliveries is expected to decrease from 56.7 in the fourth quarter of 2017 to 55.6 in the first quarter of 2018, indicating that supplier deliveries are expected to be slower but a lower rate in the first quarter of this year. Supplier deliveries are expected to be slowest in the following industries: Food; Textile Mill Products; Chemicals; Wood Products; Fabricated Metal Products; Machinery; Computer & Electronic Products; Transportation Equipment; and Furniture & Related Products. The Nonmetallic Mineral Products industry reported an expectation of faster supplier deliveries. Supplier Deliveries % Slower % Same % Faster Net Seasonally Adjusted Index 1 st Quarter of th Quarter of rd Quarter of nd Quarter of New Orders: The seasonally adjusted index for new orders is expected to decrease from 69.1 in the fourth quarter of 2017 to 65.4 in the first quarter of 2018, indicating that new orders are expected to increase at a lower rate in the first quarter of this year. New orders are expected to increase most rapidly in the following industries: Paper; Chemicals; Plastics & Rubber Products; Nonmetallic Mineral Products; Primary Metals; Fabricated Metal Products; Machinery; Computer & Electronic Products; Electrical Equipment, Appliance & Components; Transportation Equipment; Furniture & Related Products; and Miscellaneous. No industry reported an expected decrease in new orders. New Orders % Higher % Same % Lower Net Seasonally Adjusted Index 1 st Quarter of th Quarter of rd Quarter of nd Quarter of
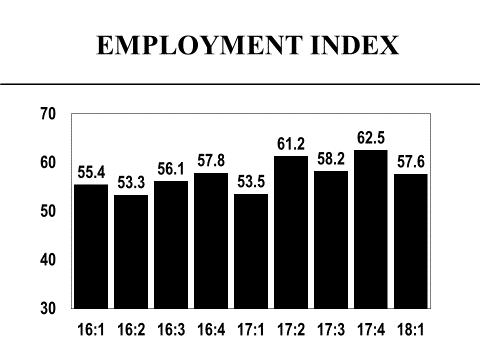
8 Employment: The seasonally adjusted index for employment is expected to decrease from 62.5 in the fourth quarter of 2017 to 57.6 in the first quarter of 2018, indicating that employment in manufacturing is expected to, nevertheless, show some improvement in the first quarter of this year. Employment is expected to increase most rapidly in the following industries: Food; Textile Mill Products; Apparel; Paper; Chemicals; Plastics & Rubber Products; Nonmetallic Mineral Products; Primary Metals; Fabricated Metal Products; Machinery; Computer & Electronic Products; Electrical Equipment, Appliance & Components; Transportation Equipment and Miscellaneous. Employment is expected to decrease most rapidly in the following industries: Food; Apparel; and Paper. Employment % Higher % Same % Lower Net Seasonally Adjusted Index 1 st Quarter of th Quarter of rd Quarter of nd Quarter of High-Tech Industries: The high-tech industries include the following: Computer & Electronic Products, and Aerospace Products & Parts. The high-tech industries currently employ about 352,100 employees, amounting to 27.2% of total manufacturing employment in the state. The percent of purchasing managers in the Computer & Electronic Products industry reporting higher expected production increased from 34% in the fourth quarter of 2017 to 50.3% in the first quarter of Additionally, the percent of purchasing managers reporting higher expected employment in these industries also increased from 25.3% in the fourth quarter of 2017 to 29.8% in the first quarter of

9 Orange County s Manufacturing Survey The Orange County manufacturing sector s Composite Index decreased from 66.3 in the fourth quarter of 2017 to 60.5 in the first quarter of 2018, indicating that the county s manufacturing economy is expected to grow at a lower rate in the first quarter of this year. The Orange County index is now below California s index. The seasonally adjusted index for production decreased substantially from 71.1 in the fourth quarter of 2017 to 62.6 in the first quarter of 2018, indicating that production is expected to grow at a lower rate in the first quarter of this year. This is the thirty fifth consecutive quarter that the production index has been above 50. The seasonally adjusted index for new orders decreased substantially from 70.9 in the fourth quarter of 2017 to 61.4 in the first quarter of 2018, indicating that new orders are expected to grow at a lower rate in the first quarter of this year. The index for the non-durable goods industries dropped precipitously from 74.1 in the fourth quarter of 2017 to 62.7 in the first quarter of 2018, indicating that the growth rate in these industries is expected to be much lower in the first quarter of this year. The index for new orders also dropped precipitously from 86.3 in the fourth quarter of 2017 to 62.9 in the first quarter of 2018 indicating a markedly lower rate of growth. The index for the durable goods industries decreased from 63.5 in the fourth quarter of 2017 to 59.8 in the first quarter of 2018, indicating that the durable goods industries are expected to grow at a lower rate in the first quarter of this year. Production and new orders are also expected to grow at a lower rate. 9
10 ABOUT THE ANDERSON CENTER FOR ECONOMIC RESEARCH The A. Gary Anderson Center for Economic Research (ACER) was established in 1979 to provide data, facilities and support in order to encourage the faculty and students at Chapman University to engage in economic and business research of high quality, and to disseminate the results of this research to the community. ANNUAL SCHEDULE OF CONFERENCES AND PRESS RELEASES JANUARY MARCH APRIL JUNE Economic Forecast Conferences for the Inland Empire California Purchasing Managers Survey California Consumer Sentiment Survey California Purchasing Managers Survey California Consumer Sentiment Survey Economic Forecast Update Conference for the U.S., California and Orange County JULY SEPTEMBER OCTOBER DECEMBER California Purchasing Managers Survey California Consumer Sentiment Survey California Purchasing Managers Survey Economic Forecast Conference for the U.S., California and Orange County California Consumer Sentiment Survey 10