Coolwater Fry Culture in Ponds. Chris Hartleb Department of Biology Northern Aquaculture Demonstration Facility Aquaponics Innovation Center
|
|
|
- Dina Joseph
- 5 years ago
- Views:
Transcription
1 Coolwater Fry Culture in Ponds Chris Hartleb Department of Biology Northern Aquaculture Demonstration Facility Aquaponics Innovation Center


")
2 Pond Dynamics Source water quality Meteorology Hydrology Pond Location & shape Size & depth Infrastructure Biological processes Plankton dynamics Photosynthesis Respiration Excretion Decomposition Nutrient cycling Benthos dynamics Pond water quality Operation decisions Fish Species, size, density Inputs Fertilizers & feed Energy (aerators) Water management Timing of operations A. Milstein 2012, Aquaculture Pond Fertilization

3 Food Chain

4 Natural and Artificial Spawn
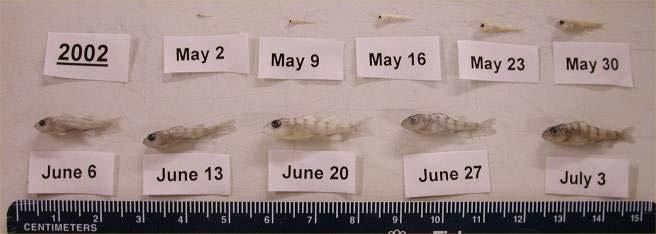
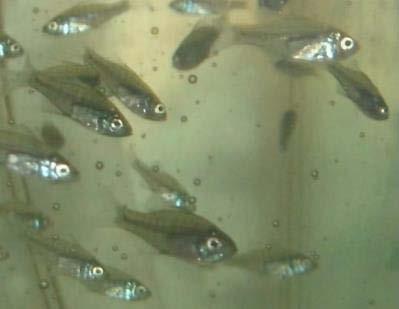
5 Fry Development


6 Culture Practices Pond / Tank / Pond Step 1: Spawn Adults Ponds Habituation Growout


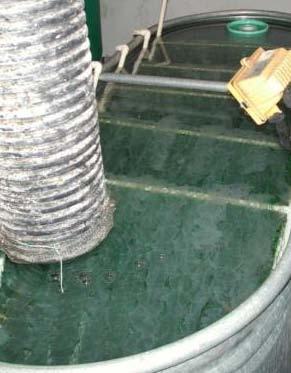
7 Culture Practices Step 2: Place fry in outdoor culture pond


8 Culture Practices Step 3: Larval fish feed on natural foods

9 Culture Practices Step 4: Fertilizers added weekly to enhance aquatic food web


10 Culture Practices Step 5: Harvest and feed-train: habituate to formulated feed


11 Best Fertilizer Reduce costs Increase efficiency Increase survival rate Decrease the cost of fingerlings
12 Inorganic Fertilizer Percentage Fertilizer N P 2 O 5 K 2 O Urea Primary components: Nitrogen (N) Phosphorus (P) Carbon (C) Enhance autotrophic food webs Calcium nitrate Sodium nitrate Ammonium nitrate Ammonium sulfate Superphosphate Triple superphosphate Monoammonium phosphate Diammonium phosphate Calcium metaphosphate Potassium nitrate Potassium sulfate
13 Average Composition (%) Organic Fertilizer Various types: Animal manures (poultry, cattle, etc) Plant material (hay, alfalfa, cottonseed, soybean meal, etc) Directly & indirectly enhance algae & zooplankton Direct: Input of N, P, C stimulate autotrophic food web Indirect: Stimulate heterotrophic food webs Material Moisture N P 2 O 5 K 2 O Dairy cattle manure Beef cattle manure Poultry manure Swine manure Sheep manure Mixed grass, dry Fresh cut grass Oat straw Peanut hulls Rice straw Potato peelings Sugar cane leaves Cottonseed meal Soybean meal


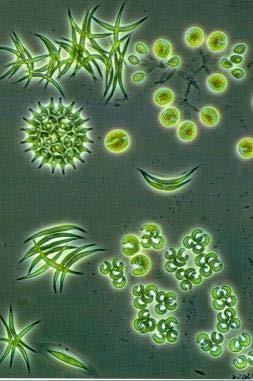
![(N:P) [600 ug N/L and 30 ug P/L] Small green](/docs-images/90/103890265/images/14-3.jpg "algae and diatoms = good Large filamentous and")
14 Nutrient Ratio Manipulation Nutrient composition of phytoplankton biomass 45-50% C, 8-10% N, 1% P Low N:P ratios = cyanobacteria High N:P ratios = non-cyanobacteria algae 20:1 (N:P) [600 ug N/L and 30 ug P/L] Small green algae and diatoms = good Large filamentous and cyanobacteria = bad

15 Green Water Method (Visibility) Implies green water is nutrient rich water Uses visibility/secchi disk to determine greenness Inexpensive, subjective, minimal accuracy Does not consider composition of algae, plankton, or impact of fertilizer on oxygen Difficult to establish consistent food web

16 Fixed Fertilization Rate Strategy Fertilizer is applied weekly at a selected quantity Requires prior knowledge of pond dynamics & fish production Simple; annual production of fish predictable Can lead to over-fertilization and is specific for each pond

17 Water Chemistry Measurement Regularly collected water samples are measured for: Total phosphorus & soluble reactive phosphorus Ammonia-N, Nitrate-N, & Nitrite-N Inorganic carbon Pond-specific & can precisely measure nutrient deficiencies Significant cost, technical, time consuming, & does not take into account daily fluctuations
18 Algal Bioassay Fertilization Strategy Based on algal nutrition limitation of N, P, & C Is pond & time-specific; utilizes ponds own algal community Uses a simple visual indicator Inexpensive, simple, & ecologically-based Water is collected weekly in clear sample bottles Each bottle is spiked with either N, P, C, or nothing (control), or a combination. Bottles are placed in sunlight for 2-3 days Water is filtered and compared visually and ranked as 100%, 50%, or 0% rate-limiting


19 Algal Bioassay Pond Samples Water samples showing nutrient spikes Filtered water showing limiting nutrient
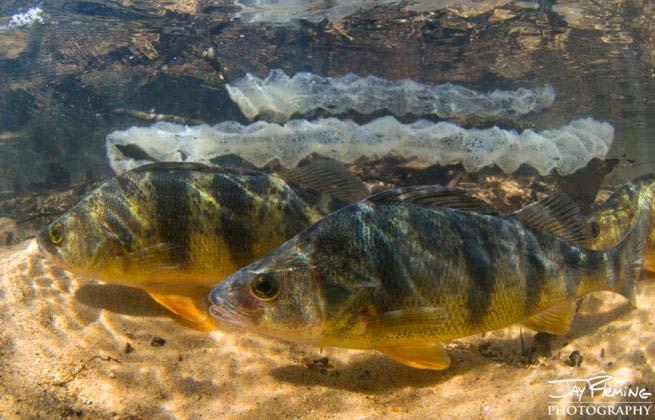
20 Yellow Perch Fry Example Methods Year 1: Examine pond fertilization practices Late April add organic fertilizer Late April to mid-june weekly inorganic fertilizer Urea-N and phosphoric acid (Desired Secchi depth 1.5 m) Monitor water chemistry of culture ponds Monitor phyto- and zooplankton Monitor growth of yellow perch fingerlings Stocked yellow perch fry (late April; 850,000 per ¼ acre) Evaluate diet
21 Water Chemistry and Visibility ph Alkalinity ppm Hardness ppm 0.9 Organic 3.5 Inorganic Secchie Depth (m) /11 4/25 5/9 5/23 6/6 6/20 7/4 4/11 4/25 5/9 5/23 6/6 6/20
22 Growth Organic Length Inorganic Length 25 Length (mm) Mean Length week 7 Inorganic: mm ± 3.05 Organic: mm ± 2.79 T-test: p < Weeks in Culture Pond
23 Growth Organic weight Inorganic weight 0.3 Weight (g) Mean Weight week 7 Inorganic: g ± 0.08 Organic: g ± 0.08 T-test: p < Weeks in Culture Pond


24 Results: Diet Diet of yellow perch fry in the organic fertilized ponds


25 Results: Diet Diet of yellow perch fry in the inorganic fertilized ponds

26 Results: Diet Comparison of diets in inorganic and organic treatments Inorganic More food types in inorganic Mean # individual diet items Organic Bosmina spp. vs. nauplii Inorganic treated ponds, fish eat more Weeks
27 Year 2: Four Fertilizer Treatments LM 2: Lake Mills Pond 2 received fixed-input organic fertilizer LM 3: Lake Mills Pond 3 received variable inorganic fertilizer LM 4: Lake Mills Pond 4 received fixed-input inorganic fertilizer LM 10: Lake Mills Pond 10 received fixed-input organic plus variable inorganic fertilizer
28 Zooplankton Attack Chlorophyll concentration Highest but declines Fixed input inorganic Fixed input organic + variable inorganic Lowest but steady Variable inorganic Fixed input organic Why decline? Zooplankton predation LM 2: Lake Mills Pond 2 received fixed-input organic fertilizer LM 3: Lake Mills Pond 3 received variable inorganic fertilizer LM 4: Lake Mills Pond 4 received fixed-input inorganic fertilizer LM 10: Lake Mills Pond 10 received fixed-input organic plus variable inorganic fertilizer
29 Temperature Effect Both inorganic fertilizer treated ponds showed highest yellow perch specific growth rate Both organic fertilized ponds showed lowest yellow perch specific growth rate LM 2: Lake Mills Pond 2 received fixed-input organic fertilizer LM 3: Lake Mills Pond 3 received variable inorganic fertilizer LM 4: Lake Mills Pond 4 received fixed-input inorganic fertilizer LM 10: Lake Mills Pond 10 received fixed-input organic plus variable inorganic fertilizer

30 Conclusions Application of fertilizer based on transparency to establish green water not a good indicator of pond fertilization or trophic cascade. Early fry growth was strongly temperature dependent as was fertilizer effectiveness. Implications of diet selection based on fertilization: Growth: Larger fish produced by inorganic treatment Larger amount of prey and more varied diet Bosmina spike in 5 th and 6 th weeks helpful for growth? Zooplankton bloom effect Possibility of gape limitation relaxation Poor survival related to low density of preferred prey.