2018 STATISTICAL GUIDE
|
|
|
- Sibyl Chambers
- 5 years ago
- Views:
Transcription
1 2018 STATISTICAL GUIDE
2 NORTHEAST GAS MARKET AT-A-GLANCE NEW ENGLAND NEW YORK NEW JERSEY PENNSYL- VANIA Gas Customers Annual Consumption (2017) Interstate Pipelines Miles of transmission pipeline Underground Storage LNG operating import facilities Gas production in-state, annual (2017) 2.7 million 5 million 3 million 3 million 866 Bcf 1,230 Bcf 703 Bcf 1,025 Bcf ,703 4,562 1,578 10, Bcf Bcf Bcf - 5,363 Bcf Gas Efficiency Program Budgets (2017) $297.3 million $140.5 million $79.4 million $5.2 million Primary energy consumption, leading fuels, % (2016) Gas as a share of residential home heating fuels (2017) Total population Gross state domestic product (GDP, 2017; % of U.S) Natural Gas, 29% Oil, 43% Nuclear, 11% Coal, 1% Renewables, 12% Natural Gas, 36% Oil, 36% Nuclear, 12% Coal, 1% Renewables, 12% Natural Gas, 36% Oil, 44% Nuclear, 14% Coal, 1% Renewables, 4% Natural Gas, 31% Oil, 27% Nuclear, 20% Coal, 17% Renewables, 5% 39.5% 59% 75% 52% 14.8 million 19.8 million 9 million 12.8 million $1,022 billion 5.3% $1,547 billion 8% $592 billion 3.1% $752 billion 3.9% Sources: NGA, NYSERDA, American Council for an Energy Efficient Economy, U.S. EIA, PHMSA, U.S. Census Bureau, U.S. BEA. Updated by NGA, November 2018
3 STATISTICAL GUIDE TO THE NORTHEAST U.S. NATURAL GAS INDUSTRY 2018 An annual review of statistics and trends relating to the region s natural gas industry November 2018

4 The NGA Statistical Guide is intended as an introduction to the natural gas market in the Northeast U.S. region of New England, New Jersey, New York and Pennsylvania. Included are basic statistics on end-use markets, infrastructure, and natural gas issues and trends - from technology applications to environmental topics. Regional information is updated through calendar year 2017, where available. As much as possible the most recent data from other sources are presented. NGA is grateful to its member companies for their cooperation and support in providing data and information for presentation in a regional tabulation. Other particularly helpful sources of information are the U.S. Department of Energy/Energy Information Administration, the Federal Energy Regulatory Commission, and Canada s National Energy Board. The Guide is prepared by Stephen Leahy of NGA. Please feel free to forward any suggestions, comments and revisions to: leahy@northeastgas.org.
5 SECTIONS I. II. III. IV. V. VI. VII. The Year in Review Regional Energy Overview Supplies & Infrastructure Natural Gas Trends in the Northeast U.S. Technology & Environmental Issues Distribution & Transmission Company Members About NGA Page

.")
6 The NGA Year in in Review Review The Northeast Gas Association (NGA) is pleased to present this annual overview of market characteristics and recent developments in the Northeast region of the United States. This overview summarizes the key features of the natural gas system in New England, New Jersey, New York, and Pennsylvania, and then discusses several current market issues (including new infrastructure, new technology R&D, supply and price trends, and regional and national environmental topics). MARKET BACKGROUND Population and Economy The Northeast region comprises the nine states of Connecticut, Maine, Massachusetts, New Hampshire, New Jersey, New York, Pennsylvania, Rhode Island, and Vermont. The composite population is 56 million (17.3% of the U.S.). Total state domestic product for the region is $4 trillion (20% of the U.S. total). Regional Natural Gas Market The nine-state region has 13.7 million natural gas customers (18.4% of the U.S. total of 74 million). Total annual gas sendout on the regional gas system is 4.1 trillion cubic feet (Tcf), or 15% of U.S. total consumption (measured in volumes delivered to consumers). Primary Energy Natural gas represents 29% of the primary energy consumption of the six New England states, 36% of New Jersey, 36% of New York, and 31% of Pennsylvania, compared to the national average of 29% (based on U.S. EIA data, 2016). Gas Customers New England has 2.7 million natural gas customers. Residential customers total 2.4 million; commercial and industrial customers number over 260,000. New Jersey has 3 million natural gas customers. Residential customers total 2.7 million; commercial and industrial customers number about 250,000. New York has 5 million natural gas customers. Residential customers total 4.5 million; commercial and industrial customers number about 400,000. 1

7 NGA Year in Review 2018 Pennsylvania has 3 million natural gas customers. Residential customers number 2.7 million; commercial and industrial customers number about 250,000. Natural gas is the leading home heating fuel in all four subregions. In New England, natural gas is the leading home heating fuel (39.5%), followed by fuel oil (36%); in New Jersey, 75%, followed by electricity (13%); in New York, 59%, followed by fuel oil (20%); and in Pennsylvania, 52%, followed by electricity (23%) and fuel oil (16%). Consumption/Sendout by Sector Total annual sendout in New England is 866 billion cubic feet (Bcf), in New Jersey about 703 Bcf, in New York about 1,230 Bcf, and in Pennsylvania about 1,025 Bcf (2017 EIA annual data). In New England, gas consumption by end-use sector is 23% residential, 23% commercial, 13% industrial, and 41% power generation. In New Jersey, it is 31% residential, 21% commercial, 8% industrial, and 40% power generation. In New York, it is 35% residential, 25% commercial, 6% industrial, and 33% power generation. In Pennsylvania, it is 21% residential, 14% commercial, 21% industrial, and 43% power generation. In New England, the gas distribution company, or LDC, design day demand is 4.6 Bcf per day, in New Jersey over 4 Bcf/d, and in Pennsylvania 5 Bcf/d. In New York State, gas utility system demand is 7.5 Bcf/d. Winter is the peak season for Northeast demand. The increasing use of gas for power generation, however, has led to higher use in the summer months, although summer demand is well below winter. Electric Generation Sector Based on annual fuel mix and generator applications in the queues at ISO-NE, NYISO and PJM, natural gas remains one of the leading current and projected fuel sources for electricity generation. In New England, natural gas represents 48% of current regional electric capacity, in New Jersey, about 63% (in-state generation), in New York, 57%, and in Pennsylvania, 30%. The U.S. interstate natural gas pipeline system includes 300,000 miles of transmission pipeline, according to the U.S. PHMSA. The EIA map on the left illustrates the extensive system. 2
.")
8 The 9 Northeast states have close to 14 million gas customers, about 18% of the U.S. total. NGA Year in Review 2018 Regional Market: Gas Supply Sources Domestic production accounts for about 96% of the natural gas consumed in the U.S. The balance is imported from Canada, and a small share is imported in the form of liquefied natural gas (LNG). Net imports as a percentage of total natural gas consumption in the U.S. totaled 8% in 2011, but dropped to about 2.5% in The U.S. became a net natural gas exporter on an annual basis in 2017 for the first time in almost 60 years, reports EIA. Historically, the Northeast region has relied on three main supply areas: Gulf Coast U.S., Canada, and LNG. In the last 20 years, supply areas expanded to include Rockies/Midcontinent gas and eastern Canada. For the Northeast, the most significant supply change has been the development in the last decade of the Marcellus and Utica Shale gas basins in Appalachia and Ohio. Total Appalachian production reached 29 Bcf/d in fall As a result, the Northeast region s imports from other U.S. supply basins, Canada, and LNG have declined as the new regional production has emerged. Marcellus/Utica production is resulting in new delivery points and new pipeline infrastructure to bring this shale gas to market, as well as reducing prices for consumers. Canada remains valuable to the region, but with new Marcellus supplies so near, the level of exports from Canada to the Northeast U.S. has fallen by twothirds since 2007, from 2.8 Bcf/d to 0.71 Bcf/d in LNG imports into the U.S. were 74 Bcf in 2017, substantially lower than the high point of 771 Bcf ten years earlier. LNG imports still play a critical role in helping local gas utilities in the Northeast region meet winter peak day requirements; for example, LNG provides about 27% of New England utilities peak day requirements. The Everett LNG facility outside Boston imported 64 Bcf in 2017, which represented 87% of total U.S. imports. LNG inputs into the region are further enhanced via supplies from Canaport LNG in New Brunswick, Canada, which delivered another 14 Bcf in Pipeline and LNG Deliverability into the Region New England New England has 2,703 miles of gas transmission pipeline, according to the U.S. Department of Transportation/ Pipeline and Hazardous Materials Safety Administration (PHMSA). 3

9 NGA Year in Review 2018 As illustrated in the chart, natural gas in the Northeast (shown in blue) has had a price advantage over heating oil for the last several years. Natural gas remains the heating fuel of choice: 86% of new single-family homes built in the Northeast in 2017 ran on natural gas, according to the U.S. Census. Chart source: U.S. Energy Information Administration, Oct The pipeline companies serving New England, interstate and intrastate, are: Algonquin Gas Transmission, Granite State Gas Transmission, Iroquois Gas Transmission System, Maritimes & Northeast Pipeline, Portland Natural Gas Transmission System, and Tennessee Gas Pipeline Co. New England is the site of three import terminals for LNG, two of which are operational. The onshore terminal in Everett, outside of Boston, is owned by Exelon (Constellation). LNG is delivered by tanker to the terminal where there is storage capacity of 3.4 Bcf. The terminal has pipeline interconnections as well as connections with a major gas utility and a major power plant. LNG is also transported to multiple LDCs satellite storage tanks from trucks that fuel at the Everett facility. The terminal s vaporization capability is 715 MMcf/d; it also has daily sendout by truck of another 100 MMcf/d. The offshore Northeast Gateway facility (near Cape Ann, MA) can receive LNG cargoes and inject the revaporized gas into the HubLine pipeline system of Enbridge. This offshore facility owned by Excelerate Energy became fully operational in early It had several shipments in its early years but none from 2011 to After several years of inactivity it has brought some offshore gas into the market (2.6 Bcf in 2015 and 2.3 Bcf in 2016), but none in 2017 or in 2018 [as of August 2018]. The offshore Neptune LNG facility owned by Exelon (also near Cape Ann, MA) was completed in It has been inactive since its start-up, and is presently offline. A fourth facility, Canaport LNG, is located just over the Maine border in Saint John, New Brunswick, Canada. Owned and operated by Repsol and Irving Oil, it became operational in June It can deliver up to 1 Bcf/d into the Brunswick Pipeline, which connects with the Maritimes & Northeast Pipeline, which then can transport the volumes into New England. Since its inception, it has delivered over 350 Bcf into the regional market. Canada s National Energy Board noted in March 2017 that Canaport is a peak demand serving facility with deliveries increasing during the winter months in response to cold temperatures. 4

10 Photo: Enbridge NGA Year in Review 2018 New Jersey New Jersey has 1,578 miles of gas transmission pipeline. The interstate pipeline companies serving New Jersey are: Algonquin Gas Transmission, Columbia Gas Transmission, Tennessee Gas Pipeline Co., Texas Eastern Pipeline Co., and Transcontinental Gas Pipe Line Corp. The LDCs utilize local LNG storage for peak day support. New York New York has 4,561 miles of gas transmission pipeline. The pipeline companies serving New York State are: Algonquin Gas Transmission, Columbia Gas Transmission, Dominion Energy Transmission, Empire State Pipeline Co., Iroquois Gas Transmission System, Millennium Pipeline Company, National Fuel Gas Supply Co., North Country Pipeline, Stagecoach Gas Services, Tennessee Gas Pipeline Co., Texas Eastern Pipeline Co., and Transcontinental Gas Pipe Line Corp. New York also has gathering systems such as Laser Pipeline. LNG is utilized by two local utilities in the New York City and Long Island areas. The LNG is received from the pipeline in vapor form and then liquefied. New York has no LNG import facility. Pennsylvania Pennsylvania has 10,168 miles of gas transmission pipeline. The pipeline companies serving Pennsylvania include: Columbia Gas Transmission, Dominion Energy Transmission, National Fuel Gas Supply Co., Tennessee Gas Pipeline Co., Texas Eastern Pipeline Co., and Transcontinental Gas Pipe Line Corp. LNG is utilized by two LDCs, and produced by the affiliate of another utility for sale into the regional energy market. Regional Production The Northeast region, a major consumer of natural gas and a high-priced energy market, is now a center of U.S. natural gas production. Historically, the region had only limited natural gas production, in New York and Pennsylvania. (There is no gas resource production base in New Jersey or New England.) With the advancement of hydraulic fracturing and the development of the Marcellus resource base, the Northeast has developed into a significant natural gas production area. Appalachian production, centered in Pennsylvania, Ohio, and West Virginia, reached 29 Bcf/d in Pennsylvania s annual production exceeded 5 Tcf in 2017; it has become the second-largest state producer of natural gas in the nation. Pennsylvania s recent rate of growth is actually leading the nation, notes 5

11 NGA Year in Review 2018 Christina Simeone of the Kleinman Center for Energy Policy at the University of Pennsylvania. In an October 2017 paper entitled Pennsylvania s Gas Decade, Ms. Simeone observed: Between 2007 and 2016, Pennsylvania s annual natural gas production levels grew by almost 2,800%. The increase was larger than in any other major gas producing state, and made Pennsylvania the biggest driver of America s 32% increase in annual natural gas production. In 2007, Pennsylvania produced less than one percent of the nation s annual gas supply; by 2016 the state contributed over 16% of national annual production. Interstate pipeline companies serving the Appalachian region continue to add interconnects from area producers. Several projects have been completed and others are in development to bring this gas to market. While there is a shale gas resource in New York, use of the hydraulic fracturing process is not permitted per state regulation announced in late New York State does allow conventional drilling production. Total annual state output was 11.4 Bcf in The state s conventional production has steadily declined since 2007, when annual production totaled 55 Bcf. There is some conventional production in eastern Canada. Gas from offshore Nova Scotia continues to be produced as part of the Sable Offshore Energy Project, but output is decreasing. Supply inputs into the Maritimes & Northeast Pipeline have dropped by 30% in the last three years, reflecting lower offshore production from the Sable and Deep Panuke fields, as well as fewer LNG cargoes at Canaport. The end of current offshore Nova Scotia production is projected to occur in December In its Canada s Energy Future 2018 forecast, the National Energy Board projects that production ceases for both Sable and Deep Panuke, whose declining production renders them uneconomic by that time. A gas production field in New Brunswick, the McCully field of Corridor Resources, which began production in 2007, provides small amounts of gas (about 8 MMcf/d) for delivery into the Maritimes & Northeast Pipeline. Regional Storage Photo: PA PUC Storage is a critical part of the natural gas supply and delivery chain. The Northeast region has considerable underground storage, notably in Pennsylvania (8.2% of the U.S. total). Underground storage in New York represents 2.7% of the U.S. total. The geology of New Jersey and New England is not suitable for underground gas storage. 6

12 NGA Year in Review 2018 Another key supply point for the region is liquefied natural gas (LNG). The region has three operating import facilities, two in MA and one in New Brunswick, Canada. Nationally and regionally, LNG imports are down, as U.S. domestic production is on the increase. LNG remains especially important to New England for peak days. This photo is of an LNG tanker delivery to Everett during a snowstorm in early January Photo source: Everett LNG LNG is another important part of the Northeast storage portfolio. Total LNG storage capacity in New York is 3.2 Bcf, in New Jersey about 4 Bcf, in Pennsylvania 6.7 Bcf, and in New England 16 Bcf on the LDC system and another 3.4 Bcf at the Everett import terminal. The Canaport LNG facility has 9.9 Bcf of storage. LNG is also produced and supplied into the market from companies in Québec and Pennsylvania. Recent System Enhancements 2018 witnessed the advancement of several interstate pipeline projects: Enbridge & DTE Energy: NEXUS Project Enbridge: Atlantic Bridge Project [partial] Energy Transfer: Rover Pipeline Millennium: Valley Lateral Project PNGTS: Portland XPress [phase 1] Transco: Atlantic Sunrise Transco: Garden State Expansion Project [phase 2]. Millennium s Eastern System Upgrade is expected to be completed by the end of The largest transmission projects involved transporting Appalachian supplies away from the Northeast region to the Midwest, Canada, and the U.S. South. RBN Energy in October 2018 noted that With the addition of new largediameter, long-haul natural gas pipelines like Rover and NEXUS as well as Williams/Transco s Atlantic Sunrise expansion capacity in recent months, production is at record highs and more gas is leaving the region than ever before. Another project of note is the LNG export capability at Dominion s Cove Point facility in Maryland; the facility exported its first cargoes this year. 7

13 NGA Year in Review 2018 Planned Infrastructure Enhancements The Northeast region s natural gas industry plans several infrastructure projects to meet growing market demand within the timeframe. The region remains constrained at several points on its natural gas system, especially into New England and southern New York/Long Island. Two gas utilities in Massachusetts continue to have moratoria in place on adding new customers in certain parts of their systems due to limitations on capacity. New supplies and infrastructure would help to ease constraints, ameliorate regional price disadvantages, and increase regional natural gas capacity, deliverability, flexibility and reliability, thus providing economic and environmental benefits to the Northeast region. NGA posts updates on proposed projects at: Challenges for new projects include siting, environmental concerns, and securing market position. Securing contract commitments in New England remains a vexing market issue, as the largest consuming sector, power generation, is constrained by the complex economic structure of its wholesale electricity market. Natural gas utilities however have committed to investing in incremental pipeline projects to meet system expansion and reliability needs. LNG is another supply option, for the market in general and for gas LDCs. UGI Corp. in Pennsylvania through its subsidiary, UGI LNG, has LNG storage, associated peak shaving services, and an LNG tanker truck-loading terminal. Gaz Métro LNG (Energir) in Québec increased its liquefaction capability in South Jersey Gas added liquefaction capability in National Grid received federal regulatory approval in fall 2018 to add liquefaction at its Providence, Rhode Island facility. In fall 2018, Philadelphia Gas Works (PGW) announced details of its proposed LNG project with Passyunk Energy Center, LLC (PEC) to facilitate the marketing and sale of LNG to regional customers. A further project is The interstate pipeline system in the Northeast accesses supplies from multiple sources. The pipelines also can access storage at different points along their systems, including local storage in Pennsylvania and New York. With prolific production underway in Appalachia, these pipeline operators are undertaking numerous projects to add facilities to bring these new supplies to local markets in the Northeast and elsewhere, changing traditional flow patterns. 8
14 NGA Year in Review 2018 the Northeast Energy Center (NEC), proposed as a FERC regulated LNG liquefaction, storage and vaporization project to be located in central MA and connected to Tennessee Gas Pipeline. The project sponsor is Liberty Energy Trust of Pennsylvania. Portable or mobile compressed natural gas (CNG) is another supply/delivery development. This process is designed to bring natural gas to communities and businesses not located near a pipeline or distribution system. Some large commercial and industrial facilities, such as medical centers and colleges, have opted for portable or mobile natural gas delivered by truck. In this approach, large tube trailers are filled at large compression facilities and the CNG is delivered to the customer's facility, where it is then de-pressurized, off-loaded, and flowed into the customer s gas (or dual-fuel) equipment. MARKET ISSUES Supply Outlook New supply developments have transformed the traditional paths of supply sourcing into the region, creating a more flexible supply mix and a more robust delivery network. In terms of U.S. natural gas supply, the outlook remains positive. In July 2017, the Potential Gas Committee (PGC) at the Colorado School of Mines released its year-end 2016 biennial report, Potential Supply of Natural Gas in the United States. The assessment reports that the U.S. possesses a technically recoverable natural gas resource potential of 2,817 Tcf, which is the highest resource evaluation in the PGC s 52-year history. The future supply of domestic natural gas continues to increase due to the emergence and advancement of key technologies that unlock gas production from reservoirs such as shale formations. Canada, which has considerable natural gas reserves, remains an important energy partner, although its share of the U.S. natural gas market is expected to decline over the long-term. The NEB s recent report, Canada s Energy Future 2018, projects its natural gas production and demand to increase over the next decades, with the power generation market and LNG exports as the key market drivers. Increased domestic production in the U.S. is also affecting LNG imports. LNG imports into the U.S. are substantially lower than a decade ago, and the focus for the U.S. gas market has shifted from imports to exports. Several LNG import facilities on both coasts and especially in the Gulf - are adding liquefaction facilities so that they can export LNG to the world market. In 2017, the U.S. exported far more LNG (890 Bcf) than it imported (74 Bcf), a trend that will continue. One example of the new dynamic is Dominion s Cove Point facility in Maryland; long an import facility, it recorded its first export shipment in the first half of

15 NGA Year in Review 2018 Natural gas and renewable energy are the leading growth fuels in the region, for sectors from power generation to alternate fuel transportation. Natural gas can help balance power system demand for variable sources like solar and wind. Nevertheless, with the Northeast delivery system still constrained at certain points, regionally based LNG facilities are expected to continue to ease bottlenecks and increase supply and delivery options. Efficiency Initiatives The Northeast region is a recognized national leader in per capita energy efficiency. A 2018 report by the American Council for an Energy Efficient Economy (ACEEE) noted that $1.3 billion was invested in natural gas efficiency programs nationwide in 2017 (latest data). Nearly 40% ($522 million) of the national total was invested in the nine Northeast states. ACEEE notes that efficiency opportunities exist in multiple sectors: While the roots of natural gas efficiency programs lie within residential markets, there are now programs serving multiple types of natural gas customers - from homeowners to large industries Programs may target specific technologies that use natural gas, such as furnaces, water heaters, boilers, and cooking equipment, or they may target the systems and facilities that are served by natural gas technologies. Improving the thermal envelope of buildings is one example of programs that address whole buildings. Price Trends The key variables in natural gas price formation are: demand growth, the state of the national economy, production levels, storage levels, weather, and alternative fuel prices. The natural gas price trend in this new era of domestic production continues to be positive for both consumers and the entire U.S. economy. In July 2008 natural gas commodity prices reached $13.50/MMBtu (and oil hovered close to $150 a barrel), whereas in late-2018 the average natural gas commodity price was around $3.00/MMBtu. Given the size of the domestic supply resource base, it is projected that the natural gas price bandwidth will stay relatively moderate. However, short-term volatility reflecting delivery constraints and weather will continue to exist, especially in regional markets. EIA is projecting an average commodity spot price of around $3.00 per 10

16 NGA Year in Review 2018 MMBtu in both 2018 and A lower commodity price offers economic opportunities for the Northeast region. For Pennsylvania, for example, the rise in in-state production and drop in commodity prices has resulted in what Christina Simeone of the Kleinman Center for Energy Policy at UPenn terms the Pennsylvania gas discount. She wrote in October 2017: Between 2007 and 2016, gas commodity costs have decreased significantly for all Pennsylvania consumers. Since 2013, Pennsylvania consumers have generally enjoyed a discount in natural gas commodity costs compared to national commodity prices, benchmarked at the Henry Hub it is clear that Pennsylvania consumers enjoyed more significant cost reductions than national averages. The robust production situation in the Northeast along with lingering limitations on existing takeaway pipeline capacity has meant that, at certain points in the region, Marcellus gas has been priced substantially lower at times than the traditional national average at Henry Hub. That differential is narrowing however as pipeline takeaway capacity increases. Winter Challenges The Northeast states continue to be leaders in per capita energy efficiency. The back-to-back winters of and brought colder than normal weather to the Northeast and set new records for both pipeline and gas utility sendout. The consistent cold weather tested regional energy delivery systems and resulted in significant energy price volatility. FERC s winter assessment noted that during each of these cold events, customers who had firm transportation capacity on natural gas pipelines generally managed to secure natural gas deliveries. After two mild winters, an historic cold snap tested the system once again, in $ per barrel Natural Gas $ per Mcf Oil The wide price differential between natural gas and oil has narrowed in the last several years. Natural gas however retains a price advantage - and the projection by U.S. EIA in its 2018 Annual Energy Outlook is that average natural gas prices for consumers will fall well below oil prices in coming decades in the U.S. Chart: MacroTrends,
17 NGA Year in Review 2018 late 2017/early From December 26 to January 7, the region experienced an extended and intense cold period (Boston experienced 15 consecutive days with minimum temperatures below normal.) The natural gas system performed extremely well throughout. The New England gas utilities set three new collective peak records in the first week of January 2018, with an all-time peak at close to 4.4 Bcf on January 6. In New York State and New Jersey, most gas utilities hit new record sendouts. The growth in new customers and the extreme cold weather contributed to the very high demand, and the utility performance met the challenge. LNG inputs into the system from both the Everett and Canaport terminals were critically important. Interstate pipeline operators performed extremely well. System restrictions, such as operational flow orders, were in place to keep the system in balance throughout the period. The high demand, record cold and system constraints affected spot price volatility: spot prices hit extremely high levels, including a record on the Transco system in New york. While the Midwest price rose as high as $6.50/MMBtu on January 5, the spot price in Boston was $83 and $140 in the New York City area. Since most gas generators in New England do not have firm transportation capacity arrangements, many are unable to obtain gas during high demand periods. ISO-New England s winter reliability program utilized oil through special contracts to offset the unavailability of the generators interruptible gas arrangements. ISO-NE s program was extended through last winter ( ) in recognition of the projected constraints on the regional natural gas delivery system and the resultant impact on non-firm transportation customers such as many power generators. The New England power grid at this time of high gas demand and high gas spot price volatility did indeed turn to oil. ISO noted that as gas became uneconomic, the entire season s oil supply [was] rapidly depleted. About two million barrels of oil was burned, more than double the amount burned in all of 2016, according to ISO, with implications for fuel replenishment and air emissions. Natural gas utility customers in the region are shielded in large part from spot market price volatility because of gas utilities firm contract arrangements for pipeline capacity and their storage arrangements. Other market participants however, such as many power generators, do rely on non-firm capacity and are subject to spot market prices and interruptions in capacity delivery according to their contract terms. In March 2017, the EIA noted that both the Boston and New York natural 12
18 NGA Year in Review 2018 gas markets have experienced winter price spikes because of pipeline constraints during periods of peak demand. Natural gas pipeline expansion projects that were completed in recent years may have reduced, but did not eliminate, sharp price increases with anticipated cold weather. In October 2018, looking ahead to the winter of , the FERC observed: Should similar cold weather materialize this winter, pipeline constraints on Algonquin Gas Transmission, Transcontinental Pipeline, and Tennessee Gas Pipeline could result in high gas prices at Transco Zone 6 near New York City, Algonquin Citygates in ISO New England Inc. (ISO-NE), and Transco Zone 5 South in PJM Interconnection LLC (PJM). The situation in the summer months is far less challenging (although maintenance work can have local area impacts). Gas and Electric Power Generation The regional power generation fleet, already highly reliant on natural gas, is positioned to remain so in the years ahead. Combined-cycle technology (CCT) has made the natural gas power plant the energy system of choice for the last two decades. CCT s advantages over other conventional fuel types include higher efficiency, lower heat rates, shorter construction lead times, and reduced air emissions. Gas plants are the leading fuel types for new proposed power generation capacity in the generator queues in New Jersey (where gas represents 98% of proposed new generation), Pennsylvania (97%), and New York (56%), and is second in New England, where gas represents 23% of proposed generation, solar 11%, and wind 59%. As more variable renewable resources enter the grid, natural gas will continue to serve an important and essential balancing role to provide baseload support. Natural gas and renewables should be considered as partners in helping create a more sustainable power system. (Another market factor to watch is energy storage, which has the potential to further transform the electric system. The Northeast states, notably Massachusetts, are key supporters of energy storage technology research and development.) In March 2017, PJM s study on system reliability concluded that even with the addition of more natural gas and renewables, its system would remain reliable. The analysis identified no limit to the amount of natural gas-fired generation that could be added to the system before it affected reliability. Meanwhile, regional retirements of non-gas units continue. In New Jersey in 2016 PSEG announced the retirement of its last two coal units, noting the competitive market pressure presented by low natural gas prices. In Vermont in 2014, Entergy retired its nuclear plant; in Massachusetts in 2019, it will retire its Pilgrim nuclear facility; and in New York State in 2021, it will retire its Indian Point nu- 13
19 NGA Year in Review 2018 Air emissions from power generation in the region have declined substantially in the past decade thanks in great part to the use of cleaner-burning fuels such as natural gas. Photo: Joseph Murphy clear facility. In Massachusetts in 2017, Dynegy closed the large Brayton Point coal plant. The New York Independent System Operator (NYISO) noted in its May 2018 report "Power Trends 2018" that "the portion of New York's generating capability from natural gas and dual-fuel facilities grew from 47% in 2000 to 58% in 2018 Reflecting economic and public policy investment signals, recent generation additions have primarily been natural gas-fueled in downstate New York and windpowered in upstate." In 2018, new gas combined-cycle plants opened in Connecticut (805 MW, CPV Towantic plant), Massachusetts (674 MW, Salem Harbor unit), and New York (680 MW, CPV Valley Energy Center). Other plants are under construction with start dates anticipated for At the same time, public policy and legislative initiatives in several states in the region are clearly prioritizing non-fossil fuel units for future generation. Several Northeast states are actively seeking procurements for substantial amounts of offshore wind, as well as electric imports from Canada. Solar continues to make inroads behind-the-meter as its technology costs decline. Nevertheless natural gas will continue to serve as the backbone of the power system even as the Northeast region moves toward a system more reliant on clean energy. Its centrality was underscored in fall 2017 when ISO-NE released its biennial Regional System Plan. The Plan states that Natural-gas-fired generation's proportion of the system capacity mix is expected to grow from 44.5% in 2017 to approximately 50.9% by 2020 and 56.0% by Further retirements of coal and oil generators are expected after 2020 due to generally low natural gas prices, renewable energy additions, and pending environmental regulations. Fuel choices and power system reliability remain highly topical issues at national and regional/state energy forums. Issues such as fuel security and grid resilience are under review at the FERC and the RTOs. The future of coal and nuclear, the adequacy of pipeline infrastructure in areas like the Northeast, the balancing of intermittent renewable resources on the system, the valuing of capacity in power markets, and the role of carbon emissions and carbon pricing are some of the 14
20 A new natural gas power plant north of Boston that went into operation in mid-2018; 674 MWs. remains unresolved. NGA Year in Review 2018 complex and interconnected issues under discussion and debate. This debate will continue into 2019 and beyond as power markets evolve to reflect a changing policy and regulatory environment. As the region continues to rely on natural gas for baseload generation, the lack of adequate infrastructure to meet winter power sector needs remains an unresolved issue - most notably in New England. Almost fifteen years after the January 2004 cold snap first exposed the regional power system s reliance on interruptible natural gas deliveries, the New England gas-electric reliability challenge Natural Gas Vehicles Natural gas vehicles (NGVs) are a competitive alternative fuel option, especially for fleets, buses, and heavy-duty vehicles, including refuse trucks. On the environmental front, NGVs have other comparative advantages. The U.S. Department of Energy noted that Commercially available medium - and heavy-duty natural gas engines have demonstrated over 90% reductions of carbon monoxide (CO) and particulate matter, and more than 50% reduction in nitrogen oxides (NOx) relative to commercial diesel engines. The market for heavy-duty vehicles remains strong, especially for both the bus and refuse truck sectors. CNG accommodates the widest range of vehicle types, from fleet vehicles to buses and garbage trucks. Even though CNG fueling stations are being added each year, availability remains relatively limited in the region. UGI opened a new CNG station this year in Pennsylvania; and in New York City, the first CNG station in the Bronx is expected to be completed later in New York State also has seen an investment in CNG virtual pipeline facilities at several locations. In fall 2018, Con Edison announced plans for the construction of two to five compressed natural gas (CNG) and liquefied natural gas (LNG) storage sites in Westchester County. The supply would reduce the need for conventional natural gas pipeline supplies by 40,000 dekatherms on peak winter days. New England has a few LNG fueling sites (in CT and MA), and some initiatives are underway in the U.S. and Canada for LNG highways to establish fueling stations to facilitate truck travel. There is also some interest in using LNG as a fuel for heavy-duty trucks that travel defined routes and even for marine trans- 15
21 NGA Year in Review 2018 portation (such as ferries). Utility System Expansions, Fuel Conversions, and Expanding the Dimensions of a Supply Portfolio Since 2010, the number of homes heating with natural gas in the Northeast region has increased by over one million (to over twelve million heating customers total). U.S. Census data for 2017 indicates that natural gas is the predominant heating choice for new home construction in the Northeast over 85% gas (compared to 59% in the U.S. as a whole). Gas demand has been rising as a reflection of its advantageous price, reliability and efficiency. In New York City, the Clean Heat initiative has led to the conversion of significant building load from oil to gas as city regulations seek to eliminate the use of #6 oil by 2020 and #4 oil by (Con Edison reports that it converted 6,500 large buildings in New York City from oil to natural gas between 2011 and 2016.) Gas utilities in the region have been implementing projects to upgrade system resiliency and expand the distribution network to meet market demand. These projects range from the Addison Natural Gas Project of Vermont Gas to the Southern Reliability Link project of New Jersey Natural Gas. Two projects announced in late 2017 from utilities in very different geographic areas highlight some of the innovative approaches being considered to meet rising demand. In October 2017, Con Edison announced a multi-faceted approach to address gas system growth needs. Since 2011, natural gas usage on the coldest winter days in Con Edison s service territory has grown by more than 30 percent, and is expected to grow an additional 20 percent in the next 20 years. In July 2018, the NY State Public Service Commission (PSC) approved Con Edison s enhanced gas efficiency program. The PSC stated: Today s decision represents the first step in a more holistic view of a gas utility s obligation to meet the need of its customers by exploring alternatives to its traditional utility business model. In October 2018, Con Edison announced it is proposing to invest in renewable natural gas, in CNG and LNG storage, and offer new incentives for customers who upgrade their heating equipment or install heat pumps to reduce natural gas usage. Con Edison stated: This program will help us maintain reliable service so that our customers can keep their homes and businesses warm and comfortable, while helping to support state and local energy goals. However, these measures do not eliminate the need for a new natural gas pipeline to keep up with our region s energy needs. In December 2017, Liberty Utilities NH announced its Granite Bridge Project which proposes to bring natural gas from existing infrastructure located in the Seacoast region to the central part of the state through an underground pipe- 16
22 NGA Year in Review 2018 line, linking the PNGTS and Tennessee systems in the state. It also includes a proposed LNG storage facility capable of storing up to two billion cubic feet of natural gas. The project is designed to meet growing customer demand from homes and businesses in New Hampshire. Assessing the Future Role of Natural Gas in the Regional Energy Market, as Interest in Electrification Grows The benefits of natural gas lower price, lower emissions, domestic supply contribute to continued levels of customer conversions and new customer development. Efforts are underway at the state level to advance clean energy, with a particular focus on renewables. The REV process in New York State, and Rhode Island s Power Sector Transformation report, released in fall 2017, articulate visions of reconfiguring the energy system, premised on a clean energy foundation. The Connecticut energy strategy released in early 2018 concentrated almost entirely on electricity and clean energy options while also recognizing that at this time, natural gas provides a cost-effective, relatively cleaner energy supply that Connecticut will need to continue to count on as we increase the capacity and reliability of renewable options. Several national and regional advocacy groups and consultants are promoting strategic electrification or beneficial electrification as the new overarching energy system paradigm, under which all systems heating, power generation, and transportation would operate via electricity, and that fossil fuels would be substantially reduced and eventually eliminated. The costs and practicality of electrification are under debate. In mid-2018, the American Gas Association (AGA) released a study called Implications of Policy- Driven Residential Electrification. The analysis was prepared by a crossdiscipline team of experts at ICF, who assisted in the evaluation of AGA's residential electrification policy scenarios focused on space and water heating. The report found that policy-driven electrification could be burdensome to consumers and to the economy ; have profound impacts and costs on the electric sector ; and be a very costly approach for a relatively small reduction in emissions. At the same time, ACEEE has released various studies that see value in converting homes heated with heating oil and propane to electricity, but find less value in converting natural gas homes, especially in colder climate regions. In a September 2018 blog post, Steven Nadel of ACEEE wrote: For the residential sector, recent ACEEE research has found that some applications (oil- and propane-heated homes and homes in the South) can meet the criteria for beneficial electrification discussed above. For these applications it can make sense to electrify the next 17

23 NGA Year in Review 2018 time a heating or cooling system or water heater needs to be replaced. But for many homes, electrification may not currently make sense and as a result, natural gas use will likely continue for decades, particularly in the North. This growing interest in electrification, and a relative ambivalence about the future role of natural gas in some policy circles, was addressed in a May 2017 paper by the Natural Regulatory Research Institute (NRRI) ( Questioning the Future of Natural Gas ). Ken Costello, the report s author, noted: A reasonable argument is that U.S. and state energy policy should encourage the use of natural gas for different uses rather than its suppression. A proper balancing of economic and The Northeast states have added over 1 million new natural gas customers since environmental considerations would likely reach that conclusion. Those who advocate less natural-gas usage generally skew their finding by giving little if any weight to the economic effects Climate change concerns should certainly be a factor in developing energy policy, but not the sole or even overriding factor. Accessing natural gas as an affordable and reliable energy market choice for consumers remains then a viable part of the nation s and region s diverse energy portfolio. Natural gas, along with renewables and other fuels, and empowered by anticipated new technological breakthroughs, should help fuel the nation in an increasingly more sustainable manner. Infrastructure Siting Challenges and Regulatory Delays Energy infrastructure has always encountered siting issues. Examples include wind turbines on mountain ridges, offshore wind farms, nuclear power units, wood plants, electric transmission, and natural gas pipelines and compressor stations. Some natural gas pipelines in service today in the region experienced delays in development due to siting challenges before ultimately beginning operation. In recent years, siting challenges for fossil fuel projects have reached a new level in the U.S. and Canada. Some in the environmental community argue that fossil fuels should be kept in the ground and that any new infrastructure must be prevented, lest, once built, it remains in service for decades and restrains the use of renewables. Natural gas as a bridge fuel was for several years the fossil fuel preferred by many environmentalists, since gas exhibits lower environmental impacts than coal and oil. Now, the rising use of natural gas is garnering increased 18

24 NGA Year in Review 2018 attention from many groups which view gas as an obstacle to the full implementation of clean energy. Delays at the state level are increasing, particularly regarding the issuance of state water quality certificates, adding to project costs and uncertainty. To secure federal approval, natural gas pipeline projects must demonstrate market need and financial viability, and their routes must meet environmental requirements. Contract commitments by proposed customers or shippers are essential to the process. Stakeholder and community outreach are also a required and important part of the process. Local residents have legitimate questions about the impacts of new developments in a range of sectors, not just energy, and social media is empowering community organization. Public policy requires a balanced weighing of costs and benefits. In April 2018, the FERC issued a Notice of Inquiry seeking public comment on its approach to the certification of new interstate natural gas pipelines. The Commission received numerous comments on its criteria and the weighing of factors ranging from market need to environmental issues. NGA filed comments in July stating that the current Commission Policy Statement, issued in 1999, Photo: Enbridge remains relevant, practical, flexible and appropriate, even as the nation s natural gas market has been transformed in many ways over the last two decades. NGA also noted that the balancing of federal and state interests remains a critical issue. An example of this tension between federal and state oversight authority was evidenced in the summer of 2018 when the FERC overruled the NY State Department of Environmental Conservation (DEC) which had denied a water quality permit to National Fuel Gas Supply and Empire Pipeline for its proposed Northern Access Project. The FERC in a 4-1 vote found that the DEC had waived its authority by delaying action for over a year. The Northeast region, as a highly congested area, poses challenges for any energy development. There is demonstrated market demand for natural gas by customers in the region. Increasing stakeholder outreach and advocating project benefits will only become more relevant in this new public environment. Environmental Considerations and Accomplishments Environmental issues remain central to energy system use. Highlights of some environmental topics and the role and performance of natural gas follows. Reductions in air emissions from power generation 19
25 NGA Year in Review 2018 Because natural gas compares favorably to other fossil fuels regarding air emissions, it will remain a favored fuel for new power generation. MIT s June 2011 study on gas concluded that using very efficient natural gas-powered plants to replace coal-fired plants was the most cost-effective way of reducing CO 2 emissions in the power sector over the next 25 to 30 years. Natural gas will also play a central role in integrating more intermittent renewable sources - wind and solar - into the electricity system because they can easily be brought in and out of service as needed. In fall 2018, EIA reported that energy-related CO2 emissions in the U.S. declined slightly in 2017, and were 14% below the 2005 levels, mostly because of changes in the electric power sector. Carbon emissions from the power sector dropped by 28% since 2005 in the U.S. EIA Chart: PJM, May 2018 stated that the power sector has become less carbon intensive as natural gas-fired generation displaced coalfired and petroleum-fired generation and as the non-carbon sources of electricity generation - especially renewables such as wind and solar - have grown. The substitution of natural gas for other fossil fuels has largely been market driven, as ample supplies of lower-priced natural gas and the relative ease of adding natural gas -fired capacity have allowed it to pick up share in electric power generation in many markets. In 2016, natural gas generation surpassed coal as the largest source of electricity generation. At the regional level, air emission trends remain favorable. NY ISO reported that from 2000 to 2016 emission rates from the power sector declined by 43% for CO2, 87% for NOx, and 98% for SO2. ISO-NE reported that from 2001 to 2016, total emissions from power plants in New England declined by 98% for SO2, 73% for NOx, and 29% for CO2. In February 2018 ISO-NE stated: This ongoing trend to meet electricity needs with higher-efficiency, lower-emitting gas-fired generators instead of oiland coal-fired generators has been the biggest contributor to the long-term decline in regional emissions. PJM reports substantial declines in NOx, SO2 and CO2 over the period from 2005 to 2017 (see chart above). Reductions of methane emissions in natural gas system operations The natural gas industry is cognizant of its responsibility to reduce emissions throughout its system operations. Many of NGA s distribution and transmission company members participate in the EPA s Natural Gas STAR Program and pro- 20
. Natural gas systems in total account for about a quarter of all U.S.")
26 NGA Year in Review gress continues on this front. In 2016, Natural Gas STAR partners reported methane emissions reduction of 51.4 Bcf in the U.S., providing cross-cutting benefits according to EPA. Reducing pipeline leaks is of paramount interest (see section on infrastructure replacement below). Natural gas systems in total account for about a quarter of all U.S. methane emissions, or nearly 3% of all U.S. greenhouse gas (GHG) emissions. The local distribution segment is responsible for 2% of total U.S. methane emissions (source: U.S. Department of Energy report, January 2017). Since 1990 methane emissions related to the U.S. natural gas system have declined by 16.2%, according to the EPA s April 2018 national GHG inventory report. The report, reflecting 2016 data, noted that The decrease in CH 4 emissions is largely due to a decrease in emissions from transmission, storage and distribution... The decrease in distribution emissions is largely attributed to increased use of plastic piping, which has lower emissions than other pipe materials, and station upgrades at metering and regulating (M&R) stations. In the distribution sector, the main emphasis is to accelerate the replacement of older, potentially more leak-prone pipe. In 2015 a national study led by Washington State University reported that direct measurement analysis showed decreasing methane emissions from natural gas local distribution systems in the United States. Replacement of older pipe systems and improved leak surveys were among the reasons cited for the industry performance. The latest GHG data from New York State indicates that methane emissions related to natural gas leakage have declined by 52% in the last 25 years, and in Massachusetts, methane emissions from natural gas systems declined by 67% over the same time period. Shale gas development Development of shale gas in the U.S. continues to merit analysis and technological improvements. MIT s June 2011 study on natural gas noted that the environmental impacts of shale development are challenging but manageable. An October 2011 paper by the National Regulatory Research Institute (NRRI) noted that Based on more than one million wells drilled with fracking, however, there is little evidence that fracking directly causes groundwater contamination...[r] eports show that these incidents resulted from surface spills, poor cementing jobs in wellbores, and other operational failures. The Pennsylvania Governor s Marcellus Shale Advisory Commission reported that The primary concerns regarding hydraulic fracturing relate to surface spills of fluids, well control and lost containment of production and flowback water on the surface. Proper procedures and oversight are necessary at all stages of the process. Pennsylvania, the second-largest state producer of natural gas, released some relevant studies in 2018 as- 21
27 NGA Year in Review 2018 sessing various environmental issues related to natural gas. In July, the Pennsylvania Department of Environmental Protection (DEP) released a study on natural gas drilling and air emissions. The key findings of the study are that pollutants did not exceed regulatory standards. For example, The primary criteria pollutant monitoring site, Meddings Road, did not report NAAQS-related values for any of the monitored criteria pollutants (e.g., Ozone, NO2, PM2.5, CO) which exceeded the applicable NAAQS or indicated a probable future exceedance based on the data pattern. In addition, the pattern of recorded pollutant concentration measurements did not indicate a localized source impact which would cause an exceedance of any of the NAAQS evaluated. The DEP also noted that as unconventional natural gas extraction, gathering, and processing infrastructure develops to maturity, monitoring of criteria pollutants in the project area should continue. In April 2018, PA DEP released the first four years of data on well structural soundness submitted by thousands of Pennsylvania oil and gas well operators. A comprehensive analysis of the first year, 2014, showed that the majority of wells in the state are being operated in a manner that greatly reduces the risk for groundwater impacts. DEP stated: A comprehensive analysis (including file audits and independent site verification) of data submitted in 2014 showed that less than 1 percent of operator observations indicated the types of integrity problems, such as gas outside surface casing, that could allow gas to move beyond the well footprint. The movement of gas or other fluids beyond a well footprint has the greatest potential to result in environmental concerns. The DEP s 2017 Oil and Gas Annual Report, released in August 2018, notes that: Although there is no evidence that hydraulic fracturing has resulted in a direct impact to a water supply in Pennsylvania, there are cases where related oil and gas activities have adversely affected private water supplies. DEP investigates all stray gas-related complaints and if it is determined that a water supply is adversely affected by oil and gas activities, DEP works with the responsible operator to ensure the water supply is restored or replaced. Other issues, such as reducing the use of diesel fuel in the production process, enhancing green completion in the entire production cycle to reduce emissions, and mitigating community impacts, continue to receive industry attention, in Pennsylvania and elsewhere. The industry must be responsible for best practices at all times. Pipeline Safety and Public Awareness Pipeline safety is always a priority for the industry. Federal and state regulatory requirements are rigorous, and several recent regulations have been announced to enhance operations safety, from transmission and distribution integrity management to control room operations. While the rate of incidents is declining nationwide at gas transmission and distribution levels, high profile, high conse- 22


28 NGA Year in Review 2018 quence incidents, as termed by PHMSA, have occurred in California, Pennsylvania and New York in recent years. A significant distribution system incident occurred in Massachusetts in September 2018 and that is discussed separately below. Both industry and government regulators continue to prioritize worker and contractor training, including addressing the prevalence of third party damage (the leading cause of incidents); the importance of call before you dig programs; increasing public awareness of natural gas; encouraging individuals to call utility or emergency personnel if they smell gas in the home or street; and maintaining and enhancing the physical components of the delivery system using methods like accelerated infrastructure replacement to replace older pipe materials. NGA and its member companies continue to work on important initiatives in the areas of public awareness and new technologies, among others. Last year, NGA was pleased to introduce a First Responder utility online safety training program based on an award-winning program developed by National Grid. Accelerated Pipeline Replacement Related to safe operations and environmental performance is the accelerated replacement and repair of older pipeline system components (pipes constructed of bare steel or castiron) that are considered more leak-prone. As the U.S. Department of Energy (DOE) observed in a January 2017 report: Safety remains the primary policy driver for LDC pipeline and infrastructure repair programs. However, the significance of methane emissions is becoming more recognized and companies, regulators, and other stakeholders are seeking ways to incorporate emission reductions into utility programs while limiting the cost to consumers. PHMSA continues to urge action on repairing older, potentially more leak-prone systems. In general, due to its older systems, the Northeast states have higher levels of such distribution pipe components than the national average; but those percentages are declining as system replacement continues. 23

29 NGA Year in Review 2018 Merrimack Valley Incident On September 13, 2018 there was a significant natural gas incident on the distribution system operated by Columbia Gas of MA in three Merrimack Valley towns in Massachusetts. The incident resulted from the over-pressurization of the utility s low-pressure natural gas distribution system. A utility work project was in process in the area when the incident occurred. In its preliminary report, the National Transportation Safety Board (NTSB) summarized the incident as follows: The contracted crew was working on a tiein project of a new plastic distribution main and the abandonment of a cast-iron distribution main. The distribution main that was abandoned still had the regulator sensing lines that were used to detect pressure in the distribution system and provide input to the regulators to control the system pressure. Once the contractor crews disconnected the distribution main that was going to be abandoned, the section containing the sensing lines began losing pressure. As the pressure in the abandoned distribution main dropped about 0.25 inches of water column (about 0.01 psig), the regulators responded by opening further, increasing pressure in the distribution system. Since the regulators no longer sensed system pressure they fully opened allowing the full flow of high-pressure gas to be released into the distribution system supplying the neighborhood, exceeding the maximum allowable pressure. The damage was considerable. As recounted by the NTSB: The system over-pressure damaged 131 structures, including at least 5 homes that were destroyed in the city of Lawrence and the towns of Andover and North Andover. Most of the damage was a result of structure fires ignited by gas-fueled appliances. Several structures were destroyed by natural gas explosions. One person was killed and at least 21 individuals, including 2 firefighters, were transported to the hospital. Seven other firefighters received minor injuries. Gas service to about 8,500 meters was interrupted, leading to a massive system restoration. A new distribution main of over 40 miles was installed and over 5,000 service lines were replaced. Appliances, from boilers to water heaters and gas dryers, are being replaced. The restoration involved thousands of workers over several months and a disruption to the lives and businesses of thousands of residents. The NTSB investigation is continuing and will address such further issues as the coordination between the emergency responders and the utility; an analysis of the engineering work package preparation and execution, including the design documentation; and a review of construction packages for constructability and safety. The Merrimack Valley incident is a significant event for the industry 24

30 NGA Year in Review 2018 statewide and beyond. The NTSB s final report when released will provide further guidance; and the Commonwealth of Massachusetts is undertaking an independent analysis of the entire state gas system to assess system operations and safety in a macro view. These reviews are important. The gas utilities are committed to enhancing the safety and integrity of their systems. NGA wants to note the strong industry cooperation shown in the wake of the Merrimack Valley incident. NGA has a mutual aid program that facilitates the participation of other gas utility personnel in responding to a utility request for assistance. Hundreds of personnel from the Northeast and from around the U.S., from as far as California, came to Massachusetts to assist in restoring the impacted distribution system in South Lawrence, Andover and North Andover. NGA acknowledges the support of the American Gas Association (AGA), the Southern Gas Association (SGA), and the Canadian Gas Association in coordinating personnel response. Renewable Natural Gas Renewable Natural Gas (RNG), also known as bio-methane or biogas, is pipeline-quality gas derived from biomass that is fully interchangeable with natural gas. The future natural gas network could also carry renewable gas from dairy farms, waste water treatment plants, landfills, and wood waste and food waste facilities. In a position paper a few years ago, National Grid observed that the biggest driver of renewable gas is GHG reduction, but what makes renewable gas more compelling is that it also enhances diversity of supply while providing a solution for using local waste resources to produce renewable energy. The Gas Technology Institute (GTI) noted that Bio-methane and liquid biofuels provide an opportunity to supply affordable, clean, domestically-sourced energy to U.S. and global energy customers. These renewable energy sources can help companies comply with renewable portfolio standard (RPS) requirements, low carbon fuel standards, and other policy-driven efforts intended to promote the use of renewable and sustainable energy resources for power generation, transportation, and other end use market applications. Finally, RNG as a fuel input has a key potential role in the transportation sector. U.S. DOE notes that like conventional natural gas, RNG can be used as a transportation fuel in the form of compressed natural gas (CNG) or liquefied natural gas (LNG). RNG qualifies as an advanced biofuel under the Renewable Fuel Standard. In the Northeast, there is growing interest in implementing RNG. Vermont 25
31 NGA Year in Review 2018 Gas is the first utility in the nation with a retail RNG offering. National Grid has been an active proponent for several years of incorporating biogas into the natural gas system. In fall 2018, Con Edison announced it is planning the construction of up to three renewable gas facilities that would turn food waste, sludge, yard and other waste into natural gas. These projects would reduce the need for conventional natural gas by up to 7,100 dekatherms on a peak winter day. Also in fall 2018 Liberty Utilities in New Hampshire announced an RNG project to capture the gas currently being produced by decomposing organic matter at the Bethlehem, NH landfill and process it, so that it will match the chemical composition of conventional natural gas. This project is expected to provide approximately 475,000 dekatherms of Renewable Natural Gas annually in the first 10 years of operation, all of which will be used to serve customers in New Hampshire. The utility notes: The supply of RNG from the Bethlehem landfill represents approximately 6% of Liberty Utilities total annual sales in New Hampshire. Capturing, cleaning and using this gas not only combats climate change, it also reduces emissions at the landfill. Finally, NGA is working on an (RNG) Interconnect Guidance Document intended to enhance understanding of both technical and policy issues to ensure RNG project interconnect success. New Technology R&D NGA has a significant R&D program operated by NYSEARCH. NYSEARCH has been involved with innovative projects such as pipeline sensing and guided wave technology, and continues to utilize its own testbed facility in Johnson City, NY for advanced demonstrations. Recent success stories include the development, testing and commercialization of the Remote Methane Leak Detector (RMLD), the EXPLORER II robotics program, and tests of drones for gas company facility inspection flights. NYSEARCH is also conducting an evaluation and test program for methane emissions technology, and evaluating residential methane detector technology. NGA also has collaborated with the Gas Technology Institute (GTI) to help facilitate knowledge transfers regarding new technologies that can enhance operations, safety, efficiency, and analysis. 26
32 NGA Year in Review 2018 NGA and its member companies continue to support innovative advances in natural gas technology. Company Transactions Two significant industry transactions were completed this year in the region. In July, South Jersey Industries (SJI) announced the completion of its acquisition of New Jersey-based Elizabethtown Gas and Maryland-based Elkton Gas from a subsidiary of Southern Company Gas. The transaction adds 3,315 miles of natural gas pipeline to SJI s portfolio of regulated assets. In October, Exelon Generation announced it has completed its acquisition from ENGIE of the Everett LNG Facility in Everett, MA, assuming both facility ownership and management of operations. In its press release, the company said: While Exelon Generation is managing the operation of the LNG facility, Exelon s Constellation subsidiary will be responsible for purchasing and selling LNG to gas utilities, marketers, and other market participants throughout New England. In March 2018, Exelon Generation announced an agreement to purchase the facility from ENGIE to ensure the continued reliable supply of fuel to Mystic Units 8 and 9 while they remain operating. At that time, Exelon Generation also announced that it had filed with ISO New England to retire Mystic Generating Station in June 2022, absent regulatory reforms to properly value reliability and regional fuel security. Those regulatory reforms are pending. The Year Ahead NGA posts regular updates throughout the year on its website regarding industry developments. We hope you will continue to monitor developments along with us at: 27
33 II. REGIONAL ENERGY OVERVIEW This section provides an introduction to the energy scene in the Northeast region. Among the areas addressed are: economic profile primary energy mix electric generation mix state energy consumption. 28
34 NORTHEAST ECONOMIC PROFILE STATE POPULATION (2017) HOUSEHOLDS (2017) [occupied housing units] LABOR FORCE (Aug. 2018) [thousands] GROSS DO- MESTIC PRODUCT (GDP) (2018, 1 st qtr) [$ billions] GDP as % OF U.S. TOTAL (2017) PER CAPITA PERSONAL INCOME (2017) Connec cut 3,588,184 1,356,762 1, $71,823 Maine 1,335, , $46,455 Massachuse s 6,859,819 2,604,954 3, $67,630 New Hampshire 1,342, , $59,668 New Jersey 9,005,644 3,218,798 4, $64,537 New York 19,849,399 7,304,332 9,691 1, $64,540 Pennsylvania 12,805,537 5,008,751 6, $53,300 Rhode Island 1,059, , $52,786 Vermont 623, , $52,225 U.S. 325,719, ,062, ,776 19, $50,392 Sources: U.S. Bureau of the Census, U.S. Bureau of Economic Analysis, U.S. Bureau of Labor Statistics. GDP = current dollar.
35 TOTAL PRIMARY ENERGY CONSUMPTION A comparison of primary energy consumption in the Northeast states indicates a strong role for petroleum, reflecting the inclusion of the transportation sector, a very small role for coal compared to the national average, a varying role for nuclear, a growing share for renewables, and a solid and growing share for natural gas. Percentage by State per Fuel Type Natural Gas Oil Nuclear Renewables Coal CT ME MA NH NJ NY PA RI VT US Electric Flows Sources: U.S. Energy Information Administration (EIA), State Energy Data Report 2016, released Electric flows shown for states where numbers make material difference. 30


36 ELECTRIC GENERATION FUEL SOURCE (% of total) NEW ENGLAND NEW YORK PJM Sources: ISO New England, 2017 sources of total electric energy production; NY ISO, 2018 Power Trends ; PJM, 2017 Regional Transmission Expansion Plan, State Reports, released
37 ENERGY CONSUMPTION BY MAJOR SOURCE The Northeast states consume less energy per capita than the U.S. on average. Source: U.S. Energy Information Administration, State Energy Data Report 2016, released Sum of fuel totals is not equal to total consumption due to other energy components not shown. Rank signifies level of state consumption compared to 50 U.S. states and District of Columbia. Electricity is that sold to end users. The data for fuels in TBtu is EIA's estimates for the year Per Capita, 2016, Consumption Natural Gas Petroleum Coal Electricity MMBtu Rank TBtu Rank TBtu Rank TBtu Rank TBtu Rank CT ME MA NH NJ , NY , , PA , , RI VT Northeast 4, , ,659.3 U.S , , , ,
38 PROJECTED ENERGY CONSUMPTION GROWTH, NEW ENGLAND U.S. EIA projects natural gas to grow at an annual rate of 0.7% in New England through EIA projects growth trends for other leading energy sources as follows: Renewables, 0.6% Coal, -9.3% Nuclear, -1.8% Oil, -0.6%. Source: U.S. Energy Information Administration, 2018 Annual Energy Outlook 33
39 PROJECTED ENERGY CONSUMPTION GROWTH, MID-ATLANTIC U.S. EIA projects natural gas to grow at an annual rate of 0.8% in the Mid-Atlantic region through EIA projects growth trends for other leading energy sources as follows: Renewables, 0.5% Coal, -0.1% Nuclear, -1.4% Oil, -0.4%. Source: U.S. Energy Information Administration, 2018 Annual Energy Outlook 34
40 III. SUPPLIES & INFRASTRUCTURE This section provides an introduction to the natural gas delivery network in the Northeast. Among the areas addressed are: Description of pipeline systems Liquefied natural gas (LNG) Sources of regional gas supply Proposed infrastructure enhancements. 35
41 Description of Pipelines/LNG Import Facilities Serving the Northeast Market Algonquin Gas Transmission Company is a business unit of Spectra Energy Partners, an Enbridge company. Its system incorporates approximately 1,129 miles of pipe. Its system commences in NJ, connecting with Texas Eastern, and extends through NY, CT, northern RI, and eastern and southeastern MA. Its capacity is 3.08 Bcf/d. Columbia Gas Transmission, Inc. is a subsidiary of TransCanada and is headquartered in Charleston, WV. The company serves customers along its 12,000-mile pipeline system in 10 Northeastern, Midwestern, and Mid-Atlantic states. It transports an average of 3 Bcf/day. It enters New York State through Pennsylvania and runs along the southern counties of New York bordering Pennsylvania; it also serves New Jersey. It has storage of more than 650 Bcf. Con Ed Transmission (CET) invests in electric and gas transmission projects. The company was established in January 2016 after parent company Consolidated Edison, Inc. identified electric and gas transmission as two key areas of expertise and focus for the business. CET falls under the oversight of the Federal Energy Regulatory Commission. CET operates Con Edison Gas Pipeline and Storage, LLC, which invests in gas pipeline and storage businesses. In January of 2016, Con Edison Transmission announced its first investment in natural gas infrastructure with the Mountain Valley Pipeline. CET also formed a joint venture with Crestwood Equity Partners, known as Stagecoach Gas Services. Stagecoach Gas Services operates 41 billion cubic feet of storage capacity and approximately 185 miles of pipeline. Con Edison Transmission owns a 71.2% stake in Honeoye Gas Storage. Honeoye Gas Storage is a 6.7 Bcf natural gas storage field located in Ontario County, NY. Dominion Energy Transmission, Inc., headquartered in Richmond, VA, is the interstate gas transmission subsidiary of Dominion Resources. Primarily a provider of gas transportation and storage services, Dominion Transmission, Inc. operates the world s largest underground natural gas storage system. Dominion Energy Transmission, Inc. maintains 3,900 miles of pipeline in six states Ohio, West Virginia, Pennsylvania, New York, Maryland and Virginia. The system enters New York State through Pennsylvania, and continues to points in western, central, and eastern New York, extending to the Albany area. Everett LNG, a subsidiary of Exelon Generation (Constellation), operates an LNG import terminal in Everett, Massachusetts. It interconnects with both the Tennessee and Algonquin systems. It began operation in Its vaporization sendout is approx. 715 MMcf/d, with another 100 MMcf/d by truck. Its storage is 3.4 Bcf. The facility, also known as Distrigas, has received over 1,200 cargoes, and served more than 350,000 truck loads. 36
42 Granite State Gas Transmission, Inc. is a unit of Unitil. Granite State operates 86-miles of underground interstate pipeline extending from the MA-NH border through the New Hampshire coastal area to Portland, Maine, transporting gas from other pipeline companies. The NH portion began operation in 1956; in 1966 the line was extended to Maine. Iroquois Gas Transmission System is a 416-mile interstate pipeline owned by a partnership of 4 U.S. and Canadian energy companies. It began operation in It transports natural gas from TransCanada PipeLine at the Ontario/NY border as well as Marcellus receipts, and travels through NY and CT to Long Island and into the New York City area. It has a physical receipt capability of 1.7 Bcf/d. It interconnects with TransCanada, Dominion, Tennessee and Algonquin. Maritimes & Northeast Pipeline (M&NE) is a partnership of Enbridge, Emera and ExxonMobil. It transports gas from the Maritimes to markets in Atlantic Canada and New England. The total pipeline is 684 miles. U.S. capacity is 833 MMcf/d; its capacity in Canada is 555 MMcf/d. Millennium Pipeline traverses New York s lower Hudson Valley and Southern Tier. It is comprised of 220 miles of 30 inch diameter steel pipeline and is capable of transporting up to 850,000 dekatherms per day of natural gas. It is owned by subsidiaries of TransCanada/ Columbia Pipeline Group, National Grid and DTE Energy. It began commercial operations in December It interconnects with eight systems. National Fuel Gas Supply Corporation provides interstate natural gas transmission and storage for affiliated and nonaffiliated companies through an integrated gas pipeline system of 2,300 miles that extends from southwestern Pennsylvania to the New York-Canadian border at the Niagara River. It also owns and operates 31 underground natural gas storage areas. North Country Pipeline is an intrastate pipeline of approximately 22 miles that runs from the Canadian border in northeastern New York near Champlain to the Plattsburgh area, with natural gas imported from the TransCanada system. It has a capacity of about 100 DTH/day. Portland Natural Gas Transmission (PNGTS) is sponsored by an international consortium of energy companies - TC Pipelines LP and Energir. It transports western Canadian gas and Marcellus gas to New England markets at Dracut, MA and to Maine/Atlantic Canada markets at Westbrook, ME. On the U.S. side, it involves approximately 300 miles of pipeline including 50 miles of variously sized laterals, extending through northern NH to southern Maine and interconnecting with Maritimes & Northeast through the Joint Facilities. Its current capacity is 210 Dth/d. It interconnects with the Maritimes & Northeast Pipeline at Westbrook, Maine; from there, the Joint Facilities line extends to Dracut, MA. Repsol operates the Canaport LNG facility located in Saint John, New Brunswick, Canada; its project partner is Irving Oil. The facility received its first shipment in June The physical infrastructure consists of three storage tanks with total capacity of 9.9 Bcf. The terminal has a maximum sendout capacity of 1.2 Bcf/day. Regasified LNG from the terminal flows through the Brunswick Pipeline, a 90 mile pipeline connecting the terminal to the Maritimes & Northeast Pipeline at the Maine border. Since its start-up, it has delivered about 350 Bcf to the market. 37


43 Tennessee Gas Pipeline Company is a business unit of Kinder Morgan. The Tennessee Gas Pipeline has 11,750 miles of pipeline. Tennessee s system enters New England at two points: western Mass. near West Pittsfield and southern Connecticut near Greenwich. It enters New York at several points from southwestern Pennsylvania, central Pennsylvania, an interconnect at Niagara, and through New Jersey into the New York City area and on to Connecticut. It has 109 Bcf of storage, and a capacity of ~9.6 Bcf/d. Texas Eastern Transmission Company is a business unit of Spectra Energy Partners, an Enbridge company. Its system incorporates approximately 9,096 miles of pipe, from the U.S. Gulf Coast to New Jersey. Its peak capacity is Bcf/d, with storage of 74 Bcf. TransCanada PipeLine has a network of approximately 56,000 miles of pipeline which tap into virtually all major gas supply basins in North America. It interconnects with several systems serving the Northeast. It has more than 650 Bcf of working gas storage capacity. It acquired the Columbia Pipeline Group in the U.S. in Transcontinental (Transco) is a subsidiary of Williams Company. The Transco pipeline comprises a 10,200-mile pipeline system, extending from South Texas to New York City. The system design capacity is 15.8 billion cubic feet per day. In the Northeast, it provides gas service to New York City, New Jersey and the Mid-Atlantic region. It has 197 Bcf of seasonal storage. 38

44 UTILITY MILES OF PIPELINE AND MAIN, NORTHEAST The miles of pipeline and distribution mains form a basic indicator of access to the gas market. The Northeast has continued to increase both its transmission and distribution systems; planned infrastructure enhancements and LDC system growth will likely produce increases to these numbers in coming years. The chart below shows percentage of pipeline mains by material by state as of Plastic pipe is in the percentile range for most states in the region, but is the dominant method for new distribution pipe, and now represents 57% of all U.S. miles of main. STATE / U.S. DISTRIBUTION MAIN MILES TRANSMISSION MILES Connecticut 8, Maine 1, Massachusetts 21,669 1,133 New Hampshire 1, New Jersey 34,961 1,578 New York 49,126 4,562 Pennsylvania 48,346 10,168 Rhode Island 3, Vermont U.S. total 1,295, ,651 Source: PHMSA, U.S. Department of Transportation, 2017 data. 39
45 NORTHEAST PIPELINE PROJECTS IN PROCESS 2018 saw several infrastructure projects placed into service in the region. Several other projects are in the regulatory and development process for the period and are summarized below. This list changes with market conditions please visit NGA s web site during the year for updated listings. PROJECT COMPANY DESCRIPTION EST. IN- SERVICE STATUS Portland XPress Atlantic Bridge PNGTS Enbridge PNGTS has executed Precedent Agreements with several Local Distribution Companies (LDCs) in New England and Atlantic Canada to re-contract certain system capacity set to expire in 2019 as well as expand the PNGTS system to bring its certificated capacity up to 0.3 Bcf/d. The approximately $80 million Portland XPress Project (PXP) will proceed concurrently with upstream capacity expansions. The in-service dates of PXP are being phasedin over a three-year period beginning November 1, Incremental expansion on Algonquin and Maritimes & Northeast, to serve New England and Canadian Maritimes. Proposed capacity of ~133,000 Dth/d. Partial service began in Nov at 40,000/day Announced Filed application with FERC for Phase I, Phase I went in-service on Nov. 1, 2018 with volumes of 40,000 Dth/ day. 2019/20 Announced, Feb Filed with FERC, Oct Received environmental assessment from FERC, FERC issues certificate, Partial service began, Nov Full volumes expected in-service, late Full project path expected in-service in 2 nd half of 2019/first half This table is based on publicly-available information as of Nov. 2018; project details may change. 40
46 NORTHEAST PIPELINE PROJECTS IN PROCESS (cont d) PROJECT COMPANY DESCRIPTION EST. IN- SERVICE STATUS PennEast Project Rivervale South to Market Northeast Supply Enhancement Empire North Expansion AGL Resources, NJR Pipeline Company, South Jersey Industries, UGI Energy Services, Spectra Energy and PSE&G Power LLC Williams / Transco Williams / Transco 100-mile pipeline intended to bring lower cost natural gas produced in the Marcellus Shale region to homes and businesses in Pennsylvania and New Jersey. Designed to provide natural gas service to the equivalent of 4.7 million homes, up to 1 Bcf per day. PennEast is investing nearly $1 billion to build the pipeline with the costs split among the four entities. Designed to provide up to 190,000 dekatherms per day of firm natural gas transportation service. The project will require a new 0.61 mile pipe segment along the existing Transco pipeline in Bergen County, N.J., modifications to four existing pipeline metering facilities in N.J. and N.Y., and an uprate of miles of existing pipe in Bergen County, N.J. The project would add natural gas pipeline infrastructure in PA, NJ and NY. Designed to provide customers access to an additional 400 million cubic feet of natural gas per day (enough natural gas to serve the daily needs of about 2.3 million homes). The Northeast Supply Enhancement project will provide service to National Grid. Empire Pipeline The proposed project size is 300, ,000 Dth/d. Transportation paths: Jackson/Corning to Chippawa/Hopewell. Open Season concluded Nov new compressor stations Announced Aug Open season held August In FERC pre-filing process, Oct Filed with FERC, Sept FERC issued draft EIS, FERC issued final EIS, Approved by FERC, Announced, In FERC pre-filing, May Filed with FERC, FERC issues draft EIS, NYS DEC denies water quality certificate, says application is incomplete, Open season concluded, Nov Filed with FERC, This table is based on publicly-available information as of Nov. 2018; project details may change. 41
47 NORTHEAST PIPELINE PROJECTS IN PROCESS (cont d) PROJECT COMPANY DESCRIPTION EST. IN- SERVICE Constitution Pipeline Wright Interconnect Project (WIP) Northeast Gateway Cabot/Williams Iroquois Gas Transmission Williams / Transco Approx. 124-mile Constitution Pipeline is designed to extend from Susquehanna County, PA, to the Iroquois Gas Transmission and Tennessee Gas Pipeline systems in Schoharie County, N.Y. Proposed capacity of 650 MMCf/d. Cabot and Southwestern are shippers. WIP will enable delivery of up to 650,000 Dth/d of natural gas from the terminus of the proposed Constitution Pipeline in Schoharie County, NY into both Iroquois and the Tennessee Gas Pipeline under a 15 year capacity lease agreement with Constitution. Designed to create 65,000 Dth/d of firm transportation capacity for northeastern markets. Transco has executed precedent agreements with PSEG Power, LLC (PSEG) and UGI Energy Services, LLC for firm transportation service under the project. Will consist of adding electric horsepower at an existing Transco compressor station in NJ, in addition to making modifications to two existing Transco meter stations. STATUS This table is based on publicly-available information as of Nov. 2018; project details may change Announced spring Filed with FERC, Authorized by FERC, NYS DEC denies water quality permit, ; company affirms plans to continue with project, FERC grants 2-year extension, U.S. Court of Appeals for 2 nd District upholds NYS DEC denial of certificate, FERC finds that NYS DEC did not waive its authority in decision, Constitution announces it will seek rehearing at FERC, Constitution petitions U.S. Supreme Court, 1-18, re: U.S. Second Court of Appeals decision. Supreme Court declines to hear case, FERC denies request for rehearing, Pipeline developers announce they will appeal to federal district court, FERC grants 2-year extension, Announced Filed with FERC, FERC issued final EIS, Authorized by FERC, FERC grants 2-year extension, FERC grants 2-year extension, Filed with FERC,
48 NORTHEAST PIPELINE PROJECTS IN PROCESS (cont d) PROJECT COMPANY DESCRIPTION EST. IN- SERVICE Station 261 Tennessee Gas Pipeline / Kinder Morgan Access Northeast Northern Access Enbridge, Eversource Energy, National Grid National Fuel Gas Supply & Empire Pipeline The 261 Upgrade Projects will create 72,400 dekatherms per day (Dth/d) of additional transportation capacity of natural gas on the existing Tennessee Gas Pipeline system. Projects are located in Agawam, MA and include the Looping Project and the Horsepower (HP) Replacement Project. The Looping Project involves the installation of 2.1 miles of a 12-inch diameter pipeline loop that will run parallel and adjacent to an existing TGP pipeline. The HP Replacement Project involves the replacement of two existing turbine compressor units with one new, cleaner-burning turbine compressor unit, as well as the installation of auxiliary facilities at TGP s existing Station 261. The gas pipeline expansion project will enhance the Algonquin and Maritimes pipeline systems and market area storage assets in New England to deliver up to one billion cubic feet of natural gas per day for electric generation markets. Would provide 925 MMCf/d of capacity in NY, CT, RI and MA, incl. 6.8 Bcf of LNG at proposed facility in Acushnet, MA. Capacity of 350,000 Dth/day on Empire, and 140,000 to be delivered to Tennessee 200 line. Approx. 99 miles of 24 pipeline and a compressor station upgrade and one new compressor station. Nov STATUS This table is based on publicly-available information as of Nov. 2018; project details may change. Announced late Filed with FERC, Announced Open season held first half of In FERC prefiling, Nov MA Supreme Court ruled in Aug that electric utilities could not invest in pipeline capacity; NH PUC ruled in similar fashion. Project developers announce withdrawal of application from FERC review process, 6-17: we are putting pre-permitting activities on hold but we are still advancing the project Filed with FERC, March FERC issues environmental assessment, Approved by FERC, NYS DEC denies water quality certificates, FERC denies rehearing of its permit, 8-18, stating NYS DEC had waived its authority on water quality certificate by its delay in rendering decision. 43
49 NATURAL GAS PRODUCTION IN NORTHEAST U.S. Natural gas production in the Northeast continues steady and rapid growth, as illustrated in the chart below based on data from the U.S. Energy Information Administration (EIA). Appalachian production as of fall 2018 is about 29 Bcf per day. Source: NY State Dept. of Environmental Conservation/ Office of Oil & Gas Pennsylvania alone accounted for 19% of total U.S. marketed natural gas production in 2017, with 5.36 Tcf, according to U.S. EIA. It is the second largest producing state in the U.S., behind only Texas. EIA noted in August 2018 that Marcellus and Utica production collectively accounted for about 29% of total [U.S.] production in July Recent infrastructure buildout in the region has allowed natural gas to move out of the region and has reduced the prevailing discount to the national benchmark price at Henry Hub and to regional prices. The New York State Department of Environmental Conservation / Division of Mineral Resources reports that gas production in the state in 2017 was 11.4 billion cubic feet (Bcf), down from 13.4 Bcf in Annual production is less than one-third what it was in The production is from conventional gas wells; the hydraulic fracturing drilling process is not permitted in the state. 44
50 LNG SERVING NEW ENGLAND MARKET Import facilities: Everett LNG facility, Everett, MA (part of Exelon Generation/Constellation). Began operation in Storage of 3.4 billion cubic feet. On a sustainable basis, the vaporization capacity is approximately 715 million cubic feet per day. Additional sendout capability of 100 MMBtu/d in liquid via truck. Canaport facility, Saint John, NB, Canada. Began operation in Operated by Repsol in partnership with Irving Oil. Sendout capability of 1 Bcf/d in vapor via Brunswick Pipeline into Maritimes & Northeast. Three storage tanks of 3.3 Bcf each, or ~10 Bcf total. Northeast Gateway facility, offshore Cape Ann, MA. Began operation in Operated by Excelerate Energy. Sendout capability of 0.4 to 0.8 Bcf/d in vapor via underwater HubLine. Neptune facility, offshore Gloucester, MA (part of Exelon/Constellation). Completed in Connects to underwater pipeline, HubLine, via 13.4 miles of offshore pipe. Not currently operating. LDC satellite tanks/peak-shaving units: 43 tanks in 28 communities in 5 states (CT, ME, MA, NH, RI). LDCs total LNG storage capacity is 16 Bcf. LDCs vaporization capacity is 1.4 Bcf/day. Liquefaction is available at 5 LDC-owned facilities - total liquefaction capability is 43,500 MMBtu/day. 45
51 LNG IN NEW JERSEY Storage capacity of approximately 3.7 Bcf. LDC tanks in 6 communities, owned by 4 LDCs, as well as one pipeline-owned facility. LNG IN NEW YORK LDC-owned peak-shaving plants: New York City area and Long Island, on Con Edison and National Grid systems. Storage capacity of approximately 3.2 Bcf. LNG obtained via liquefaction of pipeline gas. Vaporization capacity is approximately 0.56 Bcf/day. Liquefaction capacity is 19,850 MMBtu/day. LNG IN PENNSYLVANIA Two utilities, PECO Energy and PGW, utilize LNG peakshaving with storage capacity of approximately 5.45 Bcf. UGI LNG has storage capacity of 1.25 Bcf, for sale into Mid-Atlantic market. 46
.")
52 NORTHEAST NATURAL GAS STORAGE Storage is essential to the natural gas supply and delivery system. The principal storage system in the U.S. is underground storage, in salt caverns, aquifers, and depleted oil and gas fields. There are 414 such facilities in the U.S., with demonstrated peak working gas capacity of 4.8 Tcf. For the Northeast, there are two main types of storage: underground, and liquefied natural gas (LNG). Pennsylvania has considerable underground gas storage, 49 facilities totaling 763 Bcf, which represents 8.2% of total U.S. capacity. New York has 26 underground storage facilities with 246 Bcf of working gas capacity. New York s underground storage represents 2.7% of the U.S. total. There is no underground storage in New England or New Jersey, as the map indicates, because of the unsuitability of the region s geology. The region also accesses underground storage in Canada, notably the Dawn facility in Ontario. New England and New Jersey do utilize LNG. There are two LNG import facilities currently operating in the greater Boston area. There is also a facility in New Brunswick, Canada, close to the U.S. border in Maine. In addition, the LDCs operate above-ground LNG storage tanks for peak-shaving. As noted in previous pages, gas utilities in several Northeastern states (CT, ME, MA, NH, NJ, NY, PA, RI) utilize LNG for peakshaving and system support. New England No underground storage 2 operating LNG import facilities 28 LDC-owned LNG storage facilities New York 26 underground storage facilities 3 peakshaving LNG facilities Blue = underground storage, orange = LNG. Source: U.S. EIA New Jersey No underground storage LDC- and pipeline-owned LNG storage facilities Pennsylvania 49 underground storage facilities 3 LNG storage or peakshaving facilities 47
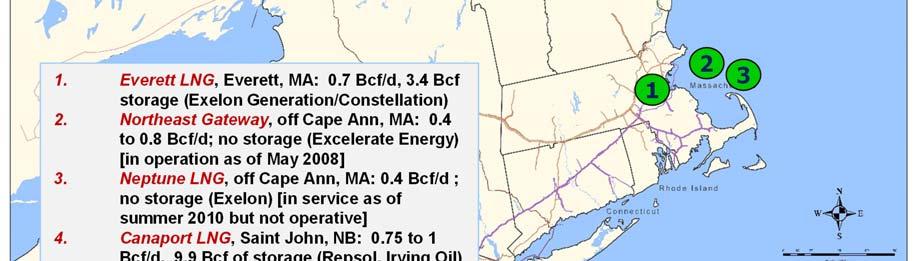
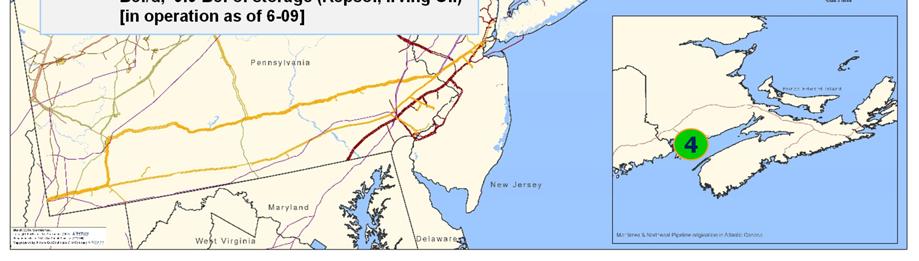
53 48


54 LNG ANNUAL VOLUMES IMPORTED INTO NEW ENGLAND TERMINALS LNG imports in 2017 by New England facilities totaled 64.1 Bcf, compared to 70 Bcf in Distrigas of MA/Everett LNG facility imported all of that total, which equaled 84% of all U.S. ship imports in An offshore LNG facility - Northeast Gateway - had its first cargoes in several years in early 2015 and 2016, but imported no cargoes in 2017 (nor through the first six months of 2018). Even as regional imports decline, the role of LNG remains critical to regional supply in this market. Source: U.S. Department of Energy, Office of Fossil Energy, Office of Natural Gas & Petroleum Import Activities. Liquefied natural gas (LNG) is an important component of the region s gas supply, especially for peak winter needs. The Everett LNG facility (i.e., Distrigas), a subsidiary of Exelon Generation, owns and operates a land-based facility at Everett, MA. There is also one operating facility located offshore near Gloucester, MA Northeast Gateway owned by Excelerate Energy. Another offshore facility owned by Exelon called Neptune, also near Gloucester, MA, is not currently operating. Repsol s Canaport LNG facility in nearby New Brunswick, Canada has supplied about 400 Bcf to the market since it began operation in mid It made 14 Bcf available to the regional market in 2017, via five marine cargoes (source: National Energy Board of Canada). LNG storage tanks at Everett LNG facility 49

55 LNG STORAGE HELD BY NEW ENGLAND GAS UTILITIES Liquefied natural gas (LNG) is a key form of in-region storage for natural gas utilities in the Northeast but particularly so in New England. Overall, it represents about 27% of peak day supply for the region s natural gas utilities. For some utilities, LNG can represent 35 to 40% of peak day supply. LNG on the gas utility system provides not only peak day supply but also pressure support at key points on the systems. The map shows the location of LNG tanks in the New England region. LNG is stored by utilities in 28 communities in 5 New England states. Map prepared by NGA. Red tanks indicate LNG satellite tanks owned and operated by gas LDCs. Locations approximate. 50
56 PROPANE / LP AIR: STORAGE CAPACITY AT NEW ENGLAND GAS LDCs Year Number of Communities with Facilities Number of Tanks Storage Capacity in Gallons ,053, ,928,132 As natural gas pipeline capacity and LNG storage have increased in the region, propane storage at the natural gas utility level has declined. Propane/air was often used to supplement gas pipeline capacity for several utilities in the Northeast, particularly in New England. Five natural gas utilities in New England still utilize propane within their supply portfolio, although the overall capacity has decreased substantially in the last two decades. The rise of natural gas production in the Appalachian region meanwhile is creating opportunities for considerable propane development in the region. 51


57 CANADIAN GAS EXPORTS TO THE NORTHEAST U.S. Canadian imports have long been a major source of U.S. - and Northeast - natural gas supply. The Northeast has drawn supplies from Alberta, offshore Nova Scotia and New Brunswick. Increasingly however the supply dynamic is changing as U.S. domestic production rises, reducing the need for imports. As indicated in the chart above, Eastern U.S. imports have declined considerably over the last few years; Canadian gas exports to the Eastern U.S. are down by over 70% since Overall, Canadian gas exports to the U.S. increased slightly in 2017, with steady exports to the U.S. Midwest and West even as exports to the East continue to decline. 52
58 IV. NATURAL GAS TRENDS IN THE NORTHEAST This section provides an introduction to the natural gas industry in the Northeast. Among the areas addressed are: Gas consumption by sector Price trends Growth areas Gas & power generation. 53
59 54

60 CONNECTICUT Natural Gas Use in Connecticut Primary energy: 35% Electric generation capacity: 39% % of households with gas as main heating fuel: 35% Annual consumption: 233 billion cubic feet (Bcf) of natural gas. Natural Gas Pipelines Serving Connecticut Natural Gas Utilities in Connecticut There are 4 natural gas utilities: Connecticut Natural Gas (purple area on map) Eversource (Yankee Gas Services Co.) (lime-green area on map) Norwich Public Utilities (aqua area on map) The Southern Connecticut Gas Co. (light brown area on map) Natural Gas Utility Customers: There are approximately 615,000 natural gas customers in the state. Algonquin Gas Transmission, a subsidiary of Enbridge. Iroquois Gas Transmission. Tennessee Gas Pipeline Company, a subsidiary of Kinder Morgan. LNG Storage in Connecticut There are utility liquefied natural gas (LNG) storage facilities in four communities. Underground Storage None. Natural Gas Production None. Natural Gas Efficiency Program Spending (2017): $44.4 million 55
 Maine Natural Gas (grey area on map) Summit Natural Gas (yellow area on map) Unitil (blue area")
61 MAINE Natural Gas Utility Customers: There are approximately 46,000 natural gas customers in the state. Natural Gas Utilities in Maine There are 4 natural gas utilities: Bangor Natural Gas (green area on map) Maine Natural Gas (grey area on map) Summit Natural Gas (yellow area on map) Unitil (blue area on map) Natural Gas Use in Maine Primary energy: 14% Electric generation capacity: 32% Natural Gas Pipelines Serving Maine 4 natural gas pipelines transport gas: Portland Natural Gas Transmission (PNGTS). It is owned by TC Pipelines LP, and Energir. Maritimes & Northeast Pipeline. It is owned by Emera, Enbridge and Exxon Mobil. Joint Facilities of PNGTS and Maritimes & Northeast Pipeline. Granite State Gas Transmission. It is owned by Unitil. LNG Storage in Maine There is a utility liquefied natural gas (LNG) storage facility in 1 community. Underground Storage None. Natural Gas Production None. Natural Gas Efficiency Program Spending (2017): $1.7 million % of households with gas as main heating fuel: 8% Annual consumption: 48 billion cubic feet (Bcf) of natural gas. 56

62 MASSACHUSETTS Natural Gas Pipelines Serving Massachusetts Algonquin Gas Transmission, a subsidiary of Enbridge. Tennessee Gas Pipeline Company, a subsidiary of Kinder Morgan. Joint Facilities of PNGTS and Maritimes & Northeast. Natural Gas Use in Massachusetts Primary energy: 31% Electric generation capacity: 43% % of households with gas as main heating fuel: 52% Annual consumption: 441 billion cubic feet (Bcf) of natural gas. Local Gas Utilities: There are eleven natural gas utilities in the state. Natural Gas Utility Customers: There are approximately 1.6 million natural gas customers in the state. LNG Import Facilities There are two in operation one onshore, one offshore. Everett LNG, a subsidiary of Exelon Generation/Constellation Northeast Gateway, a subsidiary of Excelerate Energy LNG Storage in Massachusetts There are utility liquefied natural gas (LNG) storage facilities in 18 communities. Underground Storage None. Natural Gas Production None. Natural Gas Efficiency Program Spending (2017): $215.6 million 57
63 NEW HAMPSHIRE Natural Gas Utility Customers : There are approximately 125,000 natural gas customers in the state. Natural Gas Pipelines Serving New Hampshire 4 natural gas pipelines transport gas: Portland Natural Gas Transmission (PNGTS). It is owned by TC Pipelines LP and Energir. Tennessee Gas Pipeline Company, a subsidiary of Kinder Morgan. Joint Facilities of PNGTS and Maritimes & Northeast Pipeline. Granite State Gas Transmission. It is owned by Unitil. Natural Gas Utilities in New Hampshire There are 2 natural gas utilities: Liberty Utilities (brown area on map) Unitil Corp. (orange area on map) Natural Gas Use in New Hampshire Primary energy: 20% Electric generation capacity: 37% % of households with gas as main heating fuel: 21% LNG Storage in New Hampshire There are utility liquefied natural gas (LNG) storage facilities in 3 communities. Underground Storage None. Natural Gas Production None. Natural Gas Efficiency Program Spending (2017): $5.9 million Annual consumption: 52 billion cubic feet (Bcf) of natural gas. 58
64 NEW JERSEY Natural Gas Utility Customers: There are 3 million natural gas customers in the state. Natural Gas Pipelines Serving New Jersey Natural Gas Utilities in New Jersey There are 4 natural gas utilities: Elizabethtown Gas (pale green area on map) New Jersey Natural Gas (lime green area on map) PSE&G (light red area on map) South Jersey Gas (light purple area on map) Natural Gas Use in New Jersey Primary energy: 36% Electric generation capacity: 63% % of households with gas as main heating fuel: 75% Algonquin Gas Transmission and Texas Eastern Transmission, subsidiaries of Enbridge. Columbia Transmission, a subsidiary of TransCanada. Dominion Energy Transmission Tennessee Gas Pipeline Company, a subsidiary of Kinder Morgan. Transcontinental Pipeline, a subsidiary of Williams. LNG Storage in New Jersey There are utility liquefied natural gas (LNG) storage facilities in several communities. Underground Storage None. Natural Gas Production None. Natural Gas Efficiency Program Spending (2017): $79.4 million Annual consumption: 703 billion cubic feet (Bcf) of natural gas. 59

65 NEW YORK Natural Gas Use in New York Primary energy: 36% Electric generation capacity: 52% % of households with gas as main heating fuel: 59% Annual consumption: 1,230 billion cubic feet (Bcf) of natural gas. Local Gas Utilities: There are ten natural gas utilities in the state. Natural Gas Utility Customers: There are 5 million natural gas customers in the state. Natural Gas Production In 2017, production was 11 Bcf. Natural Gas Efficiency Program Spending (2017): $140.5 million Natural Gas Pipelines Serving NY Algonquin Gas Transmission and Texas Eastern Columbia Transmission Dominion Energy Transmission Empire Pipeline Iroquois Gas Transmission Millennium Pipeline National Fuel Gas Supply North County Pipeline Stagecoach Gas Pipeline & Storage Tennessee Gas Pipeline Company Transcontinental Pipeline. LNG Storage in New York There are utility liquefied natural gas (LNG) storage facilities in three communities. Underground Storage 246 Bcf. 60
66 PENNSYLVANIA Natural Gas Use in PA Primary energy: 31% Electric generation capacity: 35% % of households with gas as main heating fuel: 52% Annual consumption: 1,025 billion cubic feet (Bcf) of natural gas. Local Gas Utilities: There are eleven natural gas utilities in the state. Natural Gas Utility Customers: There are 3 million natural gas customers in the state. Natural Gas Production In 2017, production was 5.4 Tcf. Natural Gas Pipelines Serving PA Columbia Transmission (TransCanada) Dominion Energy Transmission Equitrans National Fuel Gas Supply Tennessee Gas Pipeline Company Texas Eastern Transmission Transcontinental Pipeline. LNG Storage There are four liquefied natural gas (LNG) facilities. Underground Storage 763 Bcf. Natural Gas Efficiency Program Spending (2017): $5.2 million 61
67 RHODE ISLAND Natural Gas Utility Customers: There are approximately 266,000 natural gas customers in the state. Natural Gas Pipelines Serving Rhode Island 2 natural gas pipelines transport gas: Algonquin Gas Transmission, a subsidiary of Enbridge. Tennessee Gas Pipeline, a subsidiary of Kinder Morgan. Natural Gas Utility in Rhode Island There is 1 natural gas utility: National Grid (tan area on map) Natural Gas Use in Rhode Island Primary energy: 48% Electric generation capacity: 94% % of households with gas as main heating fuel: 53% LNG Storage in Rhode Island There are utility liquefied natural gas (LNG) storage facilities in 2 communities. Underground Storage None. Natural Gas Production None. Natural Gas Efficiency Program Spending (2017): $26.8 million Annual consumption: 80 billion cubic feet (Bcf) of natural gas. 62

68 VERMONT Natural Gas Utility Customers : There are 50,000 natural gas customers in the state. Natural Gas Pipeline Supplying Vermont 1 natural gas pipeline transports gas to the VT border: TransCanada Pipeline LNG Utility Storage in Vermont None. Underground Storage None. Natural Gas Utility in Vermont There is 1 natural gas utility: Vermont Gas Systems (dark green area on map) Natural Gas Use in Vermont Primary energy: 10% Natural Gas Production None. Natural Gas Efficiency Program Spending (2017): $2.9 million Electric generation capacity: 0% % of households with gas as main heating fuel: 18% Annual consumption: 12 billion cubic feet (Bcf) of natural gas. 63
69 STATE NORTHEAST STATES ANNUAL NATURAL GAS CONSUMPTION BY SECTOR, 2017 (Bcf) RESIDEN- TIAL COMMER- CIAL INDUSTRI- AL ELECTRIC POWER TOTAL* CT ME MA NH NJ NY ,230 PA ,025 RI VT Source: U.S. Energy Information Administration, Natural Gas Annual 2017, released September Numbers are rounded off. Delivered energy consumption. * Vehicle fuel consumption not shown, which slightly increases total number for some states. 64

70 NATURAL GAS PRICE TRENDS U.S. natural gas prices in 2018 have continued on a generally stable path, after a notable rise in volatility during a severe cold weather snap in early January in the Northeast. Commodity prices in 2018 have been relatively low, at around $3.00/MMBtu for the Henry Hub annual average. U.S. EIA projects the 2019 Henry Hub price to be in the range of $3.00 as of fall The Northeast market remains vulnerable to greater spot price volatility compared to the national average, reflecting infrastructure constraints, as seen in the chart above on the left. The U.S. Dept. of Energy noted in a 2015 report that because the natural gas market is both efficient and transparent, natural gas price behavior can provide valuable insights into the underlying regional supply and demand conditions. The entire Northeast region experienced considerable spot price volatility in the polar vortex winter of , and again in the winter of , although the heights were less extreme. U.S. EIA noted in March 2017 that natural gas pipeline expansion projects that were completed in recent years [in the Northeast] have reduced, but did not eliminate, sharp price increases with anticipated cold weather. The Bomb Cyclone event of late December 2017/early January 2018 resulted in extreme regional spot market volatility. The FERC noted in Oct that a record high natural gas price for a single next day transaction occurred on January 4, 2018 at Transco Zone 6 NY. The high price was $175/MMBtu, while the volume weighted average price surged to a record $141/MMBtu. Natural gas prices exceeded $100/MMBtu at times at both Algonquin City Gate in New England ISO, and Transco Zone 5 South in PJM. 65
71 RESIDENTIAL HEATING FUELS STATE 2017 % 2000 % 1990 % Connecticut Gas, 35 Oil, 41 Elec., 16 Gas, 29 Oil, 52.4 Elec., 14.6 Gas, 26.3 Oil, 54.4 Elec., 15.1 Natural gas continues to make inroads in the residential heating market in the region. This table illustrates the leading house heating fuels, by percentage, for the years 1990, 2000 and Maine Gas, 8 Oil, 61 Propane, 11 Massachusetts Gas, 52 Oil, 26 Elec., 16 Gas, 3.5 Oil, 80.2 Elec., 4.4 Gas, 43.9 Oil, 39.4 Elec., 12.4 Gas, 1.8 Oil, 69.5 Elec., 11.7 Gas, 38 Oil, 44 Elec., 13.5 For the 9 state region, natural gas in 2017 represented 55% of home heating, compared to 22% for heating oil and 15% for electricity. According to the most recent data, natural gas represented 59% of the home heating market in New York state, and threefourths of the home heating market in New Jersey. In Pennsylvania, gas heats 52% of homes. In New England, gas's share is 39.5%. Heating oil is second at 35.6%. Electricity is 13.7%. New Hampshire Gas, 21 Oil, 43 Propane, 17 New Jersey Gas, 75 Oil, 8 Elec., 13 New York Gas, 59 Oil, 20 Elec., 12 Pennsylvania Gas, 52 Oil, 16 Elec., 23 Rhode Island Gas, 53 Oil, 31 Elec., 11 Gas, 18.4 Oil, 58.1 Elec., 7.6 Gas, 66.8 Oil, 19.4 Elec., 10.3 Gas, 51.7 Oil, 33.1 Elec., 8.7 Gas, 51 Oil, 25.5 Elec., 16.5 Gas, 46.3 Oil, 42.1 Elec., 7.6 Gas, 15.2 Oil, 55.8 Elec., 12.4 Gas, 57.5 Oil, 29.2 Elec., 10 Gas, 45.7 Oil, 39.6 Elec., 8.5 Gas, 49.5 Oil, 27.9 Elec., 14.8 Gas, 40.7 Oil, 47 Elec., 7.9 Source: U.S. Census Bureau, Profile of Selected Housing Characteristics. Data is 2017, 1-year estimates. Vermont Gas, 18 Oil, 42 Wood, 15 Propane, 17% Gas, 12.1 Oil, 58.6 Elec., 4.7 Wood, 9.4 Gas, 8 Oil, 54.3 Elec.,
72 CHANGES IN NORTHEAST HOME HEATING CUSTOMER BASE, Number of households by primary space heating fuel, Northeast states (in thousands) 2010/ / / / / / / / /19 Natural Gas 11,118 11,245 11,356 11,529 11,705 11,802 11,858 12,020 12,184 Heating Oil 5,858 5,705 5,464 5,244 5,097 4,923 4,763 4,661 4,519 Propane Electricity 2,776 2,896 3,014 3,038 3,093 3,253 3,311 3,369 3,492 Wood U.S. EIA data indicates that the number of natural gas households in the Northeast U.S. has increased by over 1 million since (Note: The 2018/19 numbers are still preliminary.) In the same period, heating oil lost 1.3 million households, electricity gained 716,000, and propane gained 207,000. Source: U.S. EIA, October
73 NEW ENGLAND / NEW JERSEY / NEW YORK / PENNSYLVANIA MONTHLY LOAD CURVE This graph displays the monthly variations in gas consumption in New England, New Jersey, New York and Pennsylvania for the illustrative period of June 2017 through June As can be seen, all four regions are winter-peaking systems. January 2018 represents the highest monthly consumption period for all of the states. Virtually all of the region s utilities set new sendout records in the first week of January 2018, reflecting new customer additions and very cold weather. Source: U.S. Energy Information Administration, Natural Gas Monthly 68
 7,037 MW 3.3 MW 97.")


74 PROJECTED NATURAL GAS ADDITIONS IN REGIONAL ELECTRIC GENERATION SECTOR PROPOSED GENERATOR ADDITIONS BY FUEL TYPE Northeast Electric Power Systems Natural Gas Wind Solar & Other Renewables Energy Storage NY ISO 5,038 MW 2,488 MW 64 MW 20 MW ISO-NE 3,092 MW 7,948 MW 1,644 MW 845 MW NJ (PJM) 7,037 MW 3.3 MW 97.1 MW PA (PJM) 15,198 MW 218 MW 224 MW 12 MW Natural gas has been an increasingly significant fuel in the Northeast electric power system over the last 20 years. The region s three electric grid operators, as shown in these graphics, report that natural gas remains a leading choice for proposed new power plants. Renewable energy, imported hydro from Canada, and efficiency (not portrayed) are the other leading projected future power sources at this time. Offshore wind is a source of particular interest. In 2018, MA, RI, CT, NY and NJ all announced planned new investments to increase offshore wind substantially in coming years. Data sources for table: ISO-NE, Sept presentation NY ISO, 2018 Load & Capacity Data Report 2017 New Jersey State Infrastructure Report, released May 2018 by PJM 2017 Pennsylvania State Infrastructure Report, released May 2018 by PJM 69
75 V. TECHNOLOGY & ENVIRONMENTAL ISSUES New technologies and environmental issues have been key drivers in shaping the regional gas market in recent years. Among the areas addressed are: Natural gas vehicles Power generation technologies Efficiency investments Environmental issues RD&D advances. 70

76 NATURAL GAS EFFICIENCY Natural gas efficiency programs are a central part of the evolving national and regional natural gas supply/ demand portfolio. Efficiency remains a resource of immense opportunity. The Northeast states already are national leaders in their per capita energy efficiency, and the utilities in the region, electric and gas, have been active for years in efficiency programs. As the American Council for an Energy-Efficient Economy (ACEEE) has noted, efficiency opportunities exist in multiple sectors: While the roots of natural gas efficiency programs lie within residential markets, there are now programs serving multiple types of natural gas customers - from homeowners to large industries. There are opportunities for improved energy efficiency across the spectrum of customers and technologies using natural gas. Programs may target specific technologies that use natural gas, such as furnaces, water heaters, boilers, and cooking equipment, or they may target the systems and facilities that are served by natural gas technologies. Improving the thermal envelope of buildings is one example of programs that address whole buildings. The 2018 annual ACEEE Scorecard for Energy Efficiency, which looks at both electric and natural gas programs, found that five Northeast states were in the top 10 in the U.S.: MA, RI, VT, CT, and NY; and that all the Northeastern states were in the top 25. In 2017, $1.34 billion was invested in natural gas efficiency programs nationwide, according to the ACEEE. Of that, over one-third of the national total ($522 million, or 39%) was invested in the nine Northeast states (CT, ME, MA, NH, NJ, NY, PA, RI and VT). This commitment will continue in coming years. 71
77 RENEWABLE NATURAL GAS Renewable Natural Gas (RNG), also known as bio-methane or biogas, is pipeline quality gas derived from biomass that is fully interchangeable with natural gas. The future natural gas network could include renewable gas from dairy farms, waste water treatment plants, landfills, wood waste and food waste plants. The Gas Technology Institute (GTI) observes that Bio-methane and liquid biofuels provide an opportunity to supply affordable, clean, domestically-sourced energy to U.S. and global energy customers. These renewable energy sources can help companies comply with renewable portfolio standard (RPS) requirements, low carbon fuel standards, and other policy-driven efforts intended to promote the use of renewable and sustainable energy resources for power generation, transportation, and other end use market applications. In the Northeast, there is growing interest and initiatives toward implementing RNG. Vermont Gas is the first utility in the nation with a retail RNG offering. National Grid has been an active proponent for several years of incorporating biogas into the natural gas system. In a position paper a few years ago, National Grid observed that "the biggest driver of renewable gas is GHG reduction, but what makes renewable gas more compelling is that it also enhances diversity of supply while providing a solution for using local waste resources to produce renewable energy." In fall 2018, Con Edison announced the construction of up to three renewable gas facilities that would turn food waste, sludge, yard and other waste into natural gas; and Liberty Utilities New Hampshire announced an agreement to develop a new RNG production facility at a landfill in Bethlehem, N.H. This project will help strengthen the landfill s sustainability profile, while producing renewable energy to serve Liberty s natural gas customers. NGA is working in New York State on an "(RNG) Interconnect Guidance Document" intended to enhance understanding of both technical and policy issues to ensure RNG project interconnect success. 72
78 NATURAL GAS VEHICLES Natural gas fueled vehicles (also known as NGVs) have shown steady growth in recent years nationally and regionally. These vehicles provide environmental benefits, reliability, cost-effectiveness, and are sourced from domestic supplies. Natural gas fuels 23% of all transit buses in the U.S., and over 60% of new refuse truck orders are natural gas fueled. The availability of public fueling stations remains a challenge. According to the U.S. Department of Energy's Alternative Fuels Data Center, Pennsylvania has 51 public compressed natural gas (CNG) stations, New York State has 35, New Jersey has 13, and New England has 26. Nationally, there are 943 CNG fueling stations. Efforts are underway to increase the number of publicly available stations. Pennsylvania has established a Natural Gas Energy Development Program to award grants to promote the use of domestic natural gas as a vehicle fuel in Pennsylvania. The private sector is at the same time establishing its own network for private fleets, from delivery vans to trucks. Companies with specific daily travel routes are finding it makes sense to use CNG or LNG, depending on weight and distance. There are public LNG fueling stations available in Connecticut, Massachusetts and Pennsylvania. In Canada, there is also a blue road of LNG fueling stations linking Quebec and Ontario trucking routes. There is growing interest in renewable natural gas as an input to the transportation fuel stream. Potential sources of organics used to create renewable natural gas include food waste, agriculture waste, wastewater and landfill gas. The U.S. Department of Energy notes that like conventional natural gas, RNG can be used as a transportation fuel in the form of compressed natural gas (CNG) or liquefied natural gas (LNG). RNG qualifies as an advanced biofuel under the Renewable Fuel Standard. 73
79 CNG AND LNG FOR OFF-SYSTEM SUPPLY Areas not currently served by pipeline (or distribution) infrastructure are looking at ways to gain access to the fuel and increasingly opting for portable delivery systems, often referred to as a virtual pipeline. In this process, CNG or LNG can be delivered via truck to serve institutional or industrial sites. The gas is transported via a trailer that also can serve to offload the gas into the facility. This application is proving especially popular in areas of New England, New York and Eastern Canada where natural gas pipeline infrastructure has yet to reach. The new fuel system can potentially be set up in a matter of several months. The natural gas can be sourced from the local gas distribution utility, or via the interstate transmission company. Customers include paper mills, medical facilities, and farm/food processing. Shown in the photo is a CNG fueling station in Pembroke, NH operated by Clean Energy. The station operates as a CNG refueling stations for vehicles, but also supplies CNG by truck the white trucks in the photo are examples. 74
, also known as cogeneration, is the simultaneous production of electricity and heat from a single fuel source such as natural gas.")
80 CHP & FUEL CELLS Natural gas is a key fuel input for energy systems that represent new technologies with opportunities for reduced air emissions, higher system efficiency, and greater reliability. Combined heat and power (CHP), also known as cogeneration, is the simultaneous production of electricity and heat from a single fuel source such as natural gas. Natural gas fuels 70% of existing CHP capacity in the U.S. Total generating capacity in the U.S. from CHP in 2014 was 83 gigawatts, representing about 8% of total capacity. The U.S. EPA notes that gas turbines produce a high quality (high temperature) thermal output suitable for most combined heat and power applications...there is a significant amount of gas turbine based CHP capacity operating in the United States located at industrial and institutional facilities. Much of this capacity is concentrated in large combined-cycle CHP systems that maximize power production for sale to the grid. However, a significant number of simple-cycle gas turbine based CHP systems are in operation at a variety of applications including oil recovery, chemicals, paper production, food processing, and universities. CHP is environmentally beneficial. EPA reports that because of their relatively high efficiency and reliance on natural gas as the primary fuel, gas turbines emit substantially less carbon dioxide (CO2) per kilowatt-hour (kwh) generated than any other fossil technology in general commercial use. Gas Turbine or Engine with Heat Recovery Unit Source: U.S. EPA Fuel Cells use hydrogen as the fuel in an electrochemical process, similar to what occurs in a battery, that generates electricity (EPA). The primary fuel source for the fuel cell is hydrogen, which can be obtained from natural gas and other fuels containing hydrocarbons. Fuel cells provide great advancements in efficiency and lower emissions. The National Academy of Science noted in an Oct report that, looking ahead, natural gas-powered fuel cells could become mainstream and generate significant amounts of electricity. 75

, the EXPLORER II robotics program, and testing of drone systems for gas")
81 NYSEARCH: Innovative R&D NGA's NYSEARCH is recognized as one of the leading gas industry research and development organizations in the U.S., with pioneering programs that have received national and international recognition. NYSEARCH has recorded significant RD&D achievements - monitoring technology developments, identifying common needs, performing market research, evaluating potential technical solutions, and conducting product development. Recent success stories include the development, testing and commercialization of the Remote Methane Leak Detector (RMLD), the EXPLORER II robotics program, and testing of drone systems for gas company facility inspection flights. In 2018, NYSEARCH continued its work on evaluating technologies to measure methane emissions. For further information, visit the NYSEARCH web site at 76
82 ADDRESSING CARBON EMISSIONS State Energy-Related CO2 Emissions Natural gas is a contributor to greenhouse gas emissions, but is the cleanest of all fossil fuels, and as a result natural gas is included as part of the solution to the climate change challenge. At the same time, utility companies are implementing efficiency programs to reduce usage and emissions. Furthermore, natural gas companies are striving to reduce their emissions of methane, which is a greenhouse gas. Companies at all levels of the natural gas production and transmission chain are working to reduce pipeline leaks, fugitive emissions, and impacts from venting. Methane emissions from natural gas distribution systems and landfills in Massachusetts for example declined by over 65% between 1990 and One highly successful program has been the Natural Gas STAR program of the U.S. EPA. The program invites voluntary participation from industry segments to reduce methane emissions. Almost 1,200 billion cubic feet (Bcf) of methane emissions have been reduced by participating companies in the last ten years. A number of LDCs from the Northeast participate in this program. EPA reports that "reducing methane emissions can result in environmental, economic, and operational benefits. Source: U.S. EIA, (million metric tons carbon dioxide)
83 ACHIEVING EMISSIONS REDUCTIONS IN THE POWER SECTOR The electric utility sector in the Northeast has achieved major reductions in several air emission areas in recent years in part thanks to new, more efficient power sources, from natural gas to renewables. In New York State, from 2000 to 2016, NY ISO reports that emissions rates from the power sector dropped by 43% for CO 2, 87% for NOx, and 98% for SO 2. ISO-NE reports that from 2001 to 2016, total emissions from power plants in New England dropped by 98% for sulfur dioxide (SO 2 ), 73% for nitrogen oxides (NOx), and 29% for CO 2. PJM emissions data indicates a significant drop in SO 2, NO x and CO 2 for its entire region, which includes declining trends for all three pollutants in both New Jersey and Pennsylvania. U.S. power sector carbon dioxide emissions have fallen by 28% since 2005, with the substitution of natural gas for coal a key driver. 78

84 REDUCING METHANE EMISSIONS IN NATURAL GAS SYSTEMS Natural gas systems are a leading contributor to CH 4 or methane emissions in the U.S., along with agriculture, landfills and coal mining. But methane emissions from natural gas have been trending lower overall in recent decades. CH 4 emissions from natural gas systems declined by 16% from 1990 to 2016, according to the U.S. EPA's 2016 Greenhouse Gas Inventory, released in April The decline is due to the following, notes EPA: The decrease in CH4 emissions is largely due to a decrease in emissions from transmission, storage and distribution. The decrease in transmission and storage emissions is largely due to reduced compressor station emissions (including emissions from compressors and fugitives). The decrease in distribution emissions is largely attributed to increased use of plastic piping, which has lower emissions than other pipe materials, and station upgrades at metering and regulating (M&R) stations." [EPA, Inventory of U.S. Greenhouse Gas Emissions and Sinks: , page ES-16] At the state level, progress continues. Connecticut reported in June 2017 that the contribution of methane emissions from natural gas distribution systems within Connecticut is less than one percent (0.03%) of all GHG emissions. The amount of natural gas leakage in New York State declined by over 50% from 1990 to The leading sources of methane emissions in the state are landfills and agricultural animals, followed by natural gas, according to NYSERDA's Mar GHG state inventory (see chart to right). Reducing methane emissions further through infrastructure replacement, new technology applications, and best practices at all stages of the production and delivery process, is an industry priority. 79
85 ACCELERATING REPLACEMENT OF OLDER PIPE MATERIALS Miles of Distribution Main Considered Replacement Candidates by Type State Bare Steel Cast / Wrought Iron Percentage of Total Main % CT 146 1, % ME % MA 1,349 3, % NH % NJ 1,011 4, % NY 5,498 3, % PA 6,701 2, % RI % VT % Accelerated repair and replacement of more leak -prone natural gas distribution system components is an issue of high priority. The Pipeline and Hazardous Materials Safety Administration (PHMSA) of the U.S. Department of Transportation is urging action on repairing older pipe systems, which are considered more vulnerable to potential leaks. Accelerating repair and replacement would meet safety, environmental and efficiency goals. In July 2013, NARUC, the national state regulatory association, adopted a resolution encouraging regulators and industry to consider sensible programs aimed at replacing the most vulnerable pipelines as quickly as possible along with the adoption of rate recovery mechanisms that reflect the financial realities of the particular utility in question. Utilities in the Northeast are working aggressively to accelerate this replacement process, in concert with efforts to reduce emissions and extend the systems to meet market demand data, released 2018 by PHMSA 80
86 NGA's MEMBER LOCAL DISTRIBUTION COMPANIES (as of November 2018) Bangor Natural Gas Company 21 Main Street Bangor, ME (207) The Berkshire Gas Company 115 Cheshire Road, P.O. Box 138 Pittsfield, MA (413) Blackstone Gas Company 61 Main Street, P.O. Box 162 Blackstone, MA (508) Central Hudson Gas & Electric Corp. 284 South Avenue Poughkeepsie, NY (845) Columbia Gas of Pennsylvania 121 Champion Way, Suite 100 Canonsburg, PA Connecticut Natural Gas Corp. 77 Hartland Street, 4th floor East Hartford, CT (860) Consolidated Edison Co. of NY, Inc. 4 Irving Place New York, NY (212) Corning Natural Gas Corp. 330 West William Street Corning, NY (607) Columbia Gas of Massachusetts 4 Technology Drive, Suite 250 Westborough, MA (508)
87 NGA's LDC MEMBERS (as of 11-18) Eversource Energy One NSTAR Way Westwood, MA (800) Selden Street Berlin, CT (800) Fillmore Gas Company, Inc New York 19 Fillmore, NY (585) Hamilton Municipal Gas 3 East Broad Street, PO Box 119 Hamilton, NY (315) Holyoke Gas & Electric Dept. 99 Suffolk Street Holyoke, MA (413) Liberty Utilities MA PO Box 911 Fall River, MA (508) massachusetts.libertyutilities.com/fall-river Liberty Utilities NH 15 Buttrick Road Londonderry, NH (800) Maine Natural Gas PO Box 99 Brunswick, ME (207) Middleborough Gas & Electric Dept. 32 South Main Street Middleborough, MA (508) National Fuel Gas Distribution Co. (NY) 6363 Main Street Williamsville, NY (716) National Fuel Gas Distribution Co. (PA) 1100 State Street Erie, PA (814)
88 NGA's LDC MEMBERS (as of 11-18) National Grid One MetroTech Center Brooklyn, NY (718) Sylvan Road Waltham, MA (781) New Jersey Natural Gas Co Wyckoff Road Wall, NJ (732) New York State Electric & Gas 4500 Vestal Parkway East Binghamton, NY (607) Norwich Public Utilities 173 North Main Street Norwich, CT (860) Orange & Rockland Utilities, Inc. One Blue Hill Plaza Pearl River, NY (914) PECO Energy 2301 Market Street Philadelphia, PA (800) Philadelphia Gas Works (PGW) 800 W. Montgomery Avenue Philadelphia, PA (215) Public Service Electric & Gas Co. 80 Park Plaza Newark, NJ (973) Rochester Gas & Electric Corp. 89 East Avenue Rochester, NY (585)
89 NGA's LDC MEMBERS (as of 11-18) The Southern Connecticut Gas Co. 855 Main Street, P.O. Box 1540 Bridgeport, CT (203) South Jersey Gas One South Jersey Plaza Folsom, New Jersey (609) St. Lawrence Gas Company 33 Stearns Street Massena, NY (315) Summit Natural Gas of Maine 442 Civic Center Drive, Suite 100 Augusta, ME (207) UGI Utilities, Inc N. 12th Street, Suite 360 Reading, PA (610) Unitil 6 Liberty Lane West Hampton, NH (888) Valley Energy, Inc. 523 S. Keystone Avenue Sayre, PA (570) Vermont Gas Systems, Inc. P.O. Box 467 S. Burlington, VT (802) Wakefield Municipal Gas & Light Department 480 North Avenue Wakefield, MA (781) Westfield Gas & Elect. Light Dept. 100 Elm Street Westfield, MA (413)
90 TRANSMISSION COMPANIES AND LNG MEMBERS (as of 11-18) Algonquin Gas Transmission Co. 890 Winter Street, Suite 300 Waltham, Massachusetts (617) Con Edison Transmission 4 Irving Place New York, NY (212) Exelon Generation (Everett LNG) 116 Huntington Avenue, Suite 700 Boston, Massachusetts (617) (Everett terminal) Granite State Gas Transmission, Inc Forest Avenue Portland, Maine (207) Iroquois Gas Transmission System One Corporate Drive, Suite 600 Shelton, Connecticut (203) Maritimes & Northeast Pipeline 890 Winter Street, Suite 300 Waltham, Massachusetts (617) Millennium Pipeline One Blue Hill Plaza, 7th floor Pearl River, NY (800) Portland Natural Gas Transmission System (PNGTS) One Harbour Place, Suite 375 Portsmouth, NH (603) Repsol Energy North America 2001 Timberloch Place, Suite 3000 The Woodlands, Texas (281) Tennessee Gas Pipeline Company 1001 Louisiana Houston, TX (713)
91 VII. ABOUT NGA The Northeast Gas Association (NGA) is a regional trade association that focuses on education and training, operations, planning, technology research and development, and increasing public awareness of natural gas in the Northeast U.S. NGA represents natural gas distribution companies, transmission companies, liquefied natural gas importers, and manufacturers and suppliers to the industry. These member companies provide natural gas to over 13 million customers in nine states (Connecticut, Maine, Massachusetts, New Hampshire, New Jersey, New York, Pennsylvania, Rhode Island and Vermont). Mission Statement The Northeast Gas Association s mission is to promote and enhance the safe, reliable, efficient, and environmentally responsible delivery of natural gas to customers in the region, and to advocate for the industry from production to delivery. Its web site is For further information, contact NGA at: Northeast Gas Association 75 Second Avenue, Suite 510 Needham, Massachusetts Tel Its NYSEARCH office is located at: 20 Waterview Boulevard, 4th floor Parsippany, NJ Tel
92 DATA SOURCES The data sources used in the Guide are referenced on each page. NGA is grateful to the many agencies and individuals from a variety of sectors who provided information and guidance in the preparation of this report. Documents of particular interest include the following: New York State Energy Research and Development Authority (NYSERDA) ( - Patterns and Trends - New York State Energy Profiles: Pennsylvania Public Utility Commission - Pennsylvania Gas Outlook Report 2016 U.S. Department of Energy, Office of Fossil Energy, Office of Natural Gas & Petroleum Import and Export Activities - Natural Gas Imports and Exports U.S. Energy Information Administration ( - Annual Energy Outlook Natural Gas Annual Natural Gas Monthly - State Energy Data Report National Energy Board of Canada - Statistics: Natural Gas Exports and Imports NGA will continue during the year to provide up-to-date summaries of regional gas industry developments, and will make that information available on its web site at:

93 75 Second Avenue, Suite 510 Needham, Massachusetts tel Waterview Boulevard Parsippany, New Jersey tel