Near-term opportunities to develop carbon dioxide removal in the United States
|
|
|
- Lucas James
- 5 years ago
- Views:
Transcription
1 Near-term opportunities to develop carbon dioxide removal in the United States Daniel L. Sanchez AAAS Congressional Science and Engineering Fellow Princeton University STEP Seminar April 30, 2018
2 Bioenergy with Carbon Capture and Sequestration (BECCS) Biomass (fixes CO 2 from atmosphere) Energy conversion process with carbon capture Carbon-negative energy products CO 2 for compression and sequestration 2
")
3 1) Biomass harvesting 2) Biomass capture & conversion 3) Energy and carbon products 3 Canadell and Schulze (2014)

4 4 Anderson and Peters, Science (2016)
5 5 ~3 PgC/yr [GtC/yr]= 30% of current (2014) global emissions Cumulative capital investment through 2050: over $1.9 trillion Large-scale BECCS deployment beginning in 2020 Deployment: 24 GW/yr of BECCS by 2040


6 Current deployment: 1 MtCO 2 /yr.01% of median 2100 deployment 6
7 IPCC: the availability and scale of [CDR] technologies and methods are uncertain and CDR technologies and methods are, to varying degrees, associated with challenges and risks (high confidence) National Academies: Carbon dioxide removal ready for increased research and development DOE Secretary of Energy Advisory Board charged to describe a framework for a Department of Energy (DOE) Research, Development and Demonstration (RD&D) program on CO 2 utilization technologies that has the potential to introduce negative emissions at the gigatonne (Gt) scale 7
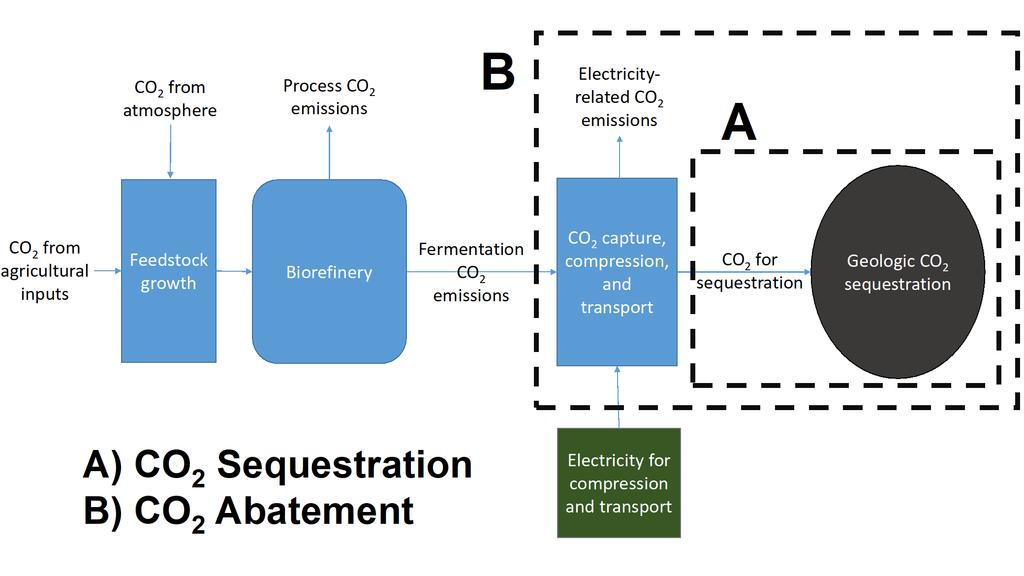
8 Assess near-term opportunities to research, develop, and demonstrate carbon dioxide removal (CDR) technologies by leveraging existing infrastructure, technologies, policies, and institutions 8 CO 2 capture and sequestration from biorefineries Federal CDR R&D program design
9 Near-term opportunities for CO 2 capture and sequestration from existing biorefineries in the United States 9
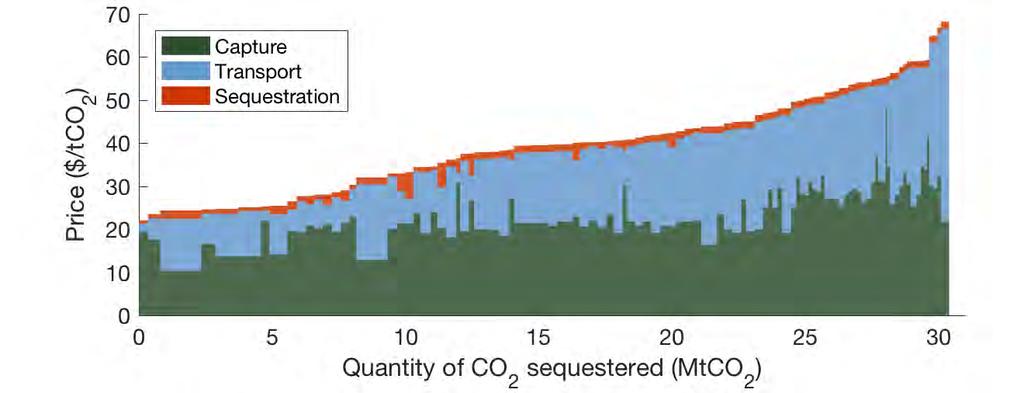
10 Motivation Point source purity is the primary factor that influences the cost of CO 2 captured Estimated breakeven capture cost: ~$30/tCO 2 for ethanol fermentation Capture typically comprises the largest cost in CCS 10 Psarras et al. ES&T (2017)

11 Motivation (2) Existing infrastructure and deployments Markets: beverage carbonation, dry ice, chemicals, ph reduction U.S. merchant CO 2 market: ~10 million tons Current sequestration: ~1 MtCO 2 /yr Estimated cost: $35/ton 11
12 Motivation (3) 12
13 Problem statement We study the abatement potential and costs of near-term biogenic CO 2 capture and sequestration from biorefineries in the United States using process engineering, spatial optimization, and lifecycle assessment Estimate CO 2 volumes, and capture, compression, transportation, and sequestration costs Calculate emissions impacts and abatement costs for CA s Low Carbon Fuel Standard and other policies Minimize total costs of CCS network via integer programming over range of feasible policy incentives 13
14 14 Results
 15 Sanchez et al.")
15 Contour plot of modeled abatement costs and scales for CO 2 capture, dehydration, and compression for biorefineries (N=216) 15 Sanchez et al. PNAS (2018)
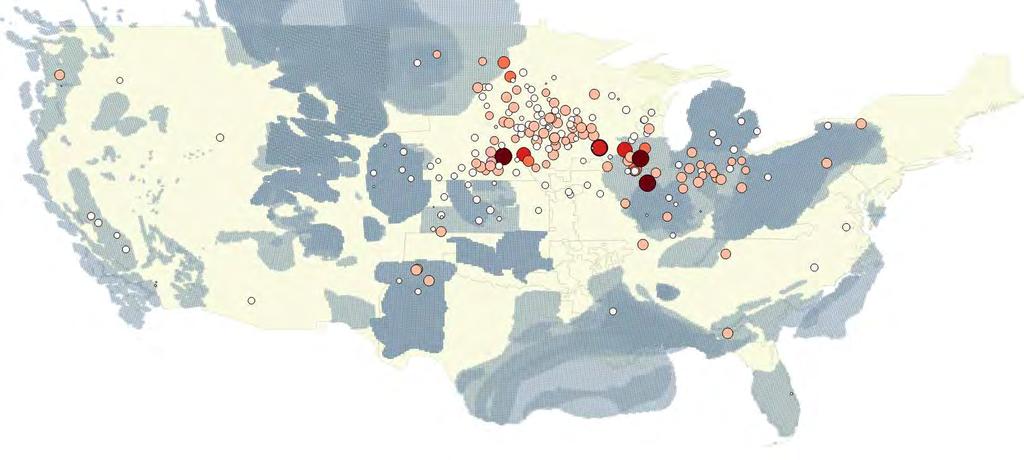
16 16 Optimal spatial capture, transportation, and sequestration networks for sequestration credits of $30, $60, $90 and $120 / tco 2, at the scale of the United States, and focusing on the Midwest United States

17 17 Sanchez et al. PNAS (2018)

18 Infrastructure Design $30/ton 6.2 Mt CO 2 /yr miles
19 $30/ton

20 $60/ton 30.4 Mt CO 2 /yr 106 4,256 miles Integrated pipeline networks allow exploitation of low cost resources
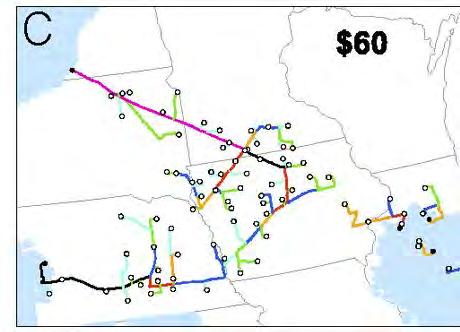
21 $60/ton
22 $90/ton 39.2 Mt CO 2 /yr 157 7,018 miles
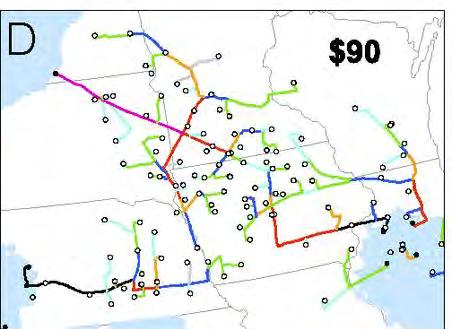
23 $90/ton

24 $120/ton 43.3 Mt CO 2 /yr 185 9,412 miles
25 25
26 26
27 27 PROFIT
28 28
29 Policy drivers and policy impacts 29
30 Carbon sequestration tax credits FUTURE Act (S. 1535): Previous law: ~$20/tCO 2 for permanent sequestration, $10 for enhanced oil recovery, 500 kt/yr minimum, likely fully subscribed Current law: up to $50/tCO 2 tax credit (45Q) sequestered, 12-year duration No credit cap, ~25 kt/yr minimum Signed into law February 2018 after several years of effort Liken to sequestration credit 30

31 31
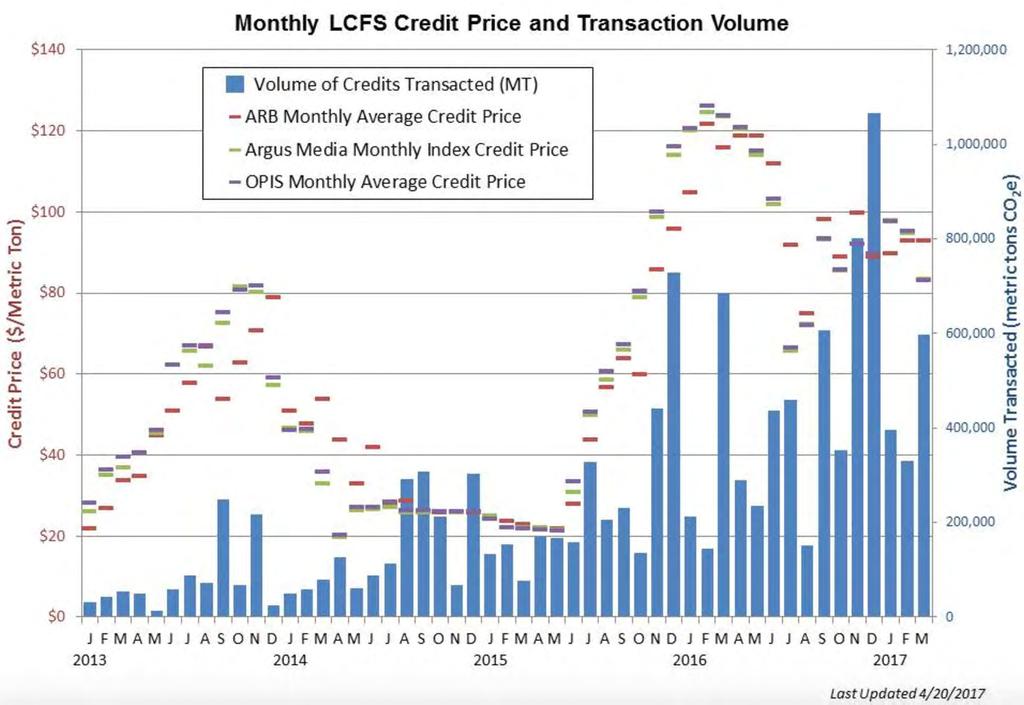
32 Carbon abatement credits California Low Carbon Fuel Standard Uncertain price, currently $75-125/tCO 2 abated Price cap: $200/ton Limited market size Proposed: quantification and permanence methodologies Proposed: extension through 2030, with tightening of cap Liken to abatement credit CA-GREET: need regional emissions intensity of electricity used for compression Additional markets: Oregon, British Columbia 32 Soon: Canada and Brazil
33 33

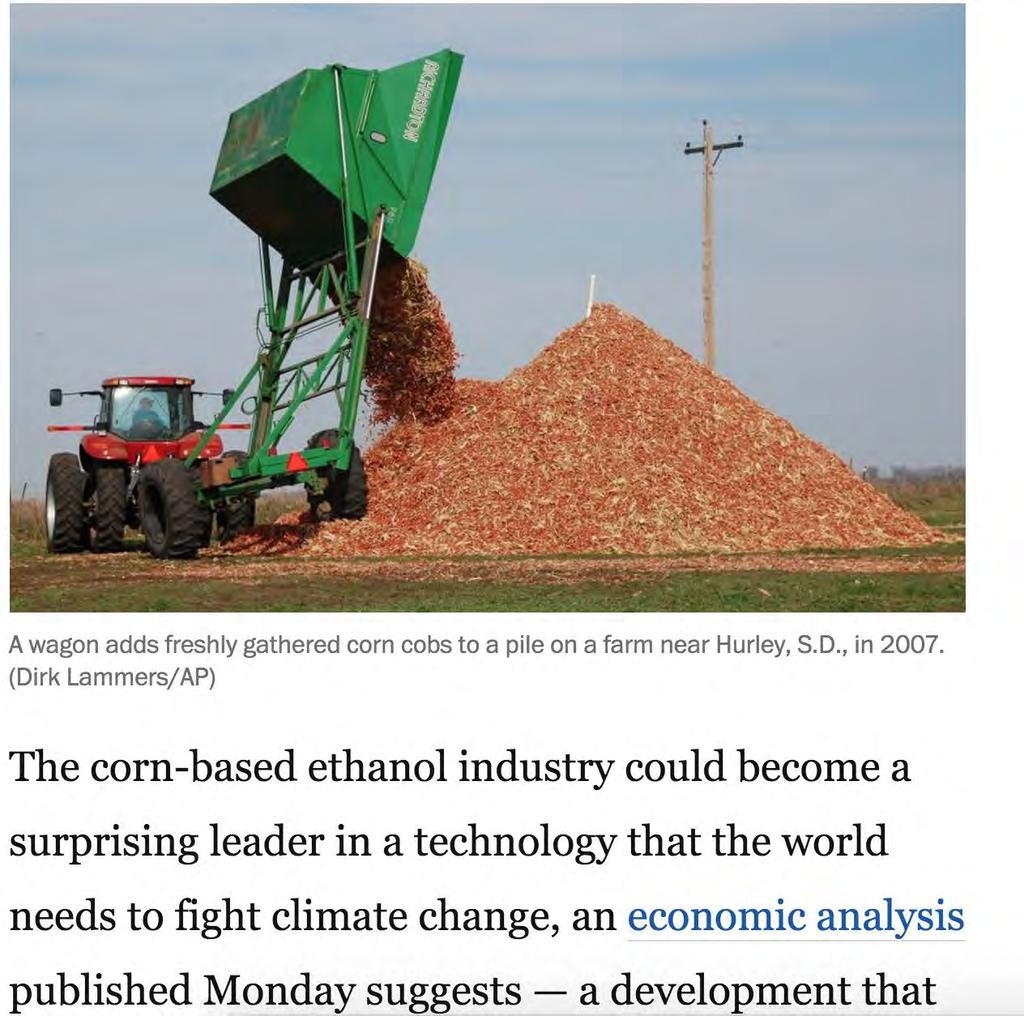
34 Argues that CCS on in-state and out-of-state biorefineries can provide additional low carbon fuel supplies to California There will be ample supplies of low-carbon transportation fuel to attain CARB s 20% proposal, and that a higher target would likely be achievable. 34
35 Renewable fuel mandates Renewable Fuels Standard (US EPA) Uncertain price, low for conventional biofuels Limited policy support for CCS deployment Exception: grain sorghum + CCS can qualify as an advanced biofuel October 2016: discussion of LCA + CCS methodology at part of annual RFS rulemaking 35
36 Conclusions Low-cost CCS opportunities exist at biorefineries around the United States Aggregation of CO 2 in integrated pipeline networks enable cost-effective sequestration Near-term policy could be sufficient to incentivize up to ~45 MtCO 2 /yr of sequestration This financial opportunity can catalyze the growth of carbon capture, transport, utilization, and sequestration, improve the lifecycle impacts of conventional biofuels, and help fulfill the mandates of lowcarbon fuel policies across the U.S. 36

37 37
38 Research, Development, and Demonstration Priorities for CDR in the United States 38
39 39
40 Problem statement A lack of technical and commercial maturity of CDR technologies hinders potential deployment As a world leader in supporting science and engineering, the United States (US) can play an important role in reducing costs and clarifying the sustainable scale of CDR We evaluate R&D needs, relevant agency authority, barriers to coordination, and interventions to enhance RD&D across the federal government of the US. 40
41 41
42 42
43 43
44 44
45 Executive branch: coordination and prioritization Several administrative options Recommend: coordinate RD&D through two complementary pathways: 1) renewing intra-agency commitment to CDR in five primary agencies, including both research and demonstration, stimulated by executive order; 2) coordinating research prioritization and outcomes across agencies, led by the Office of Science and Technology Policy (OSTP) and loosely based on the National Nanotechnology Initiative Evaluate options based on several criteria embracing technological diversity and administrative efficiency, fostering agency buy-in, and achieving commercial deployment 45

46 Legislative vehicles 46
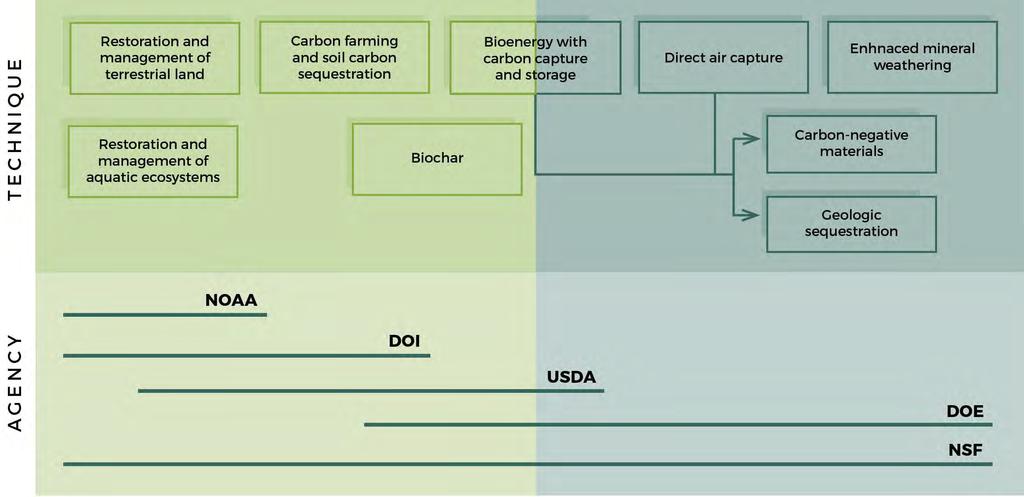
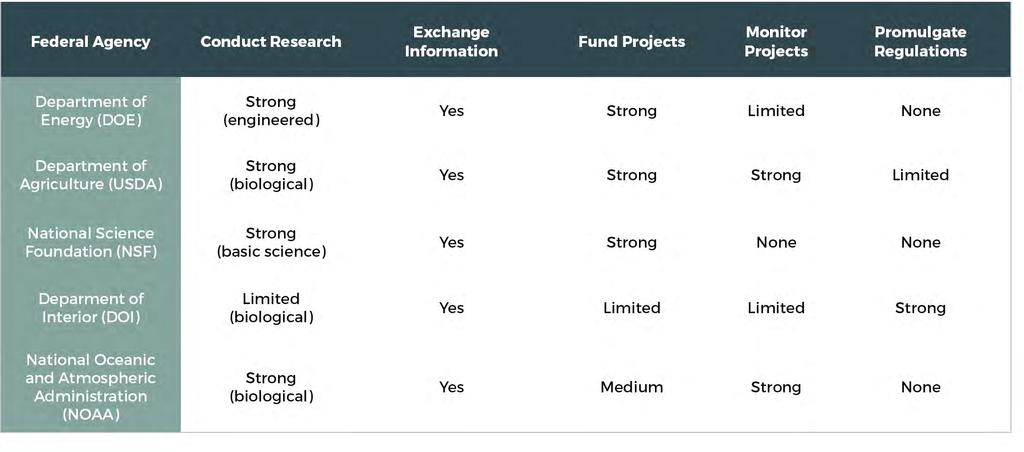
47 Conclusions On the basis of agency authority and expertise, DOE, USDA, DOI, NOAA, and NSF are the most important agencies to conduct research, fund projects, monitor effects, and promulgate regulations We evaluate potential RD&D program design on four criteria: technological diversity, administrative efficiency, agency buy-in, and a targeting of commercial deployment The executive branch could effectively coordinate RD&D strategy through two complementary pathways: Renewing intra-agency commitment to CDR, stimulated by executive order Coordinating research prioritization and outcomes across agencies, led by OSTP Future Farm and Energy Bills provide legislative vehicles for enhanced programs 47
48 48 Appendix
49 49
50 50
51 51
52 Works cited D.L. Sanchez, D.M. Kammen. A commercialization strategy for carbon-negative energy Nature Energy, 1, 1-4 (2016). D.L. Sanchez, G. Amador, J. Funk, K.J. Mach. Federal research, development, and demonstration priorities for carbon dioxide removal in the United States Manuscript under review. D.L. Sanchez, N. Johnson, S. McCoy, K.J. Mach. Near-term deployment of carbon capture and storage from biorefineries in the United States Manuscript in preparation. 52
53 LCFS market analysis Question: What amount of compliance can ethanol + CCS provide in the LCFS? Method: adapt ARB s 2015 compliance pathway Market size: max about 1.5 billion gallons / yr (~10% of ethanol supply) Carbon intensity: ~25 g/mj in 2030 vs. 57 without CCS One of the lowest CI fuels in market Sugarcane: 40 g/mj, Cellulosic: 20 g/mj, Renewable gasoline: 35 g/mj in 2030 Credits: roughly ~7-8 million credits (tco 2 abated / yr) through 2030 Overall impact: Creates attractive market for CCS deployment Cannot absorb entire cost-effective supply of ethanol+ccs Does not solve underlying problems with ethanol blending limitations in CA s low carbon fuel markets 53
54 54
55 55
56 56 ~30% of current emissions
57 57
58 Goals Spatial characterization of fermentation CO 2 emissions, capture and compression costs from existing biorefineries, as well as candidate sequestration sites across the U.S Spatially-optimized infrastructure design and supply curves for biogenic CO 2 capture, transport, and sequestration in the United States Lifecycle carbon intensity impacts for transportation fuels, evaluated under CA-GREET Cost-optimal deployment levels under multiple sequestration and carbon abatement credit scenarios Evaluation of policy impacts for the CA LCFS, RFS, and CCUS Act 58
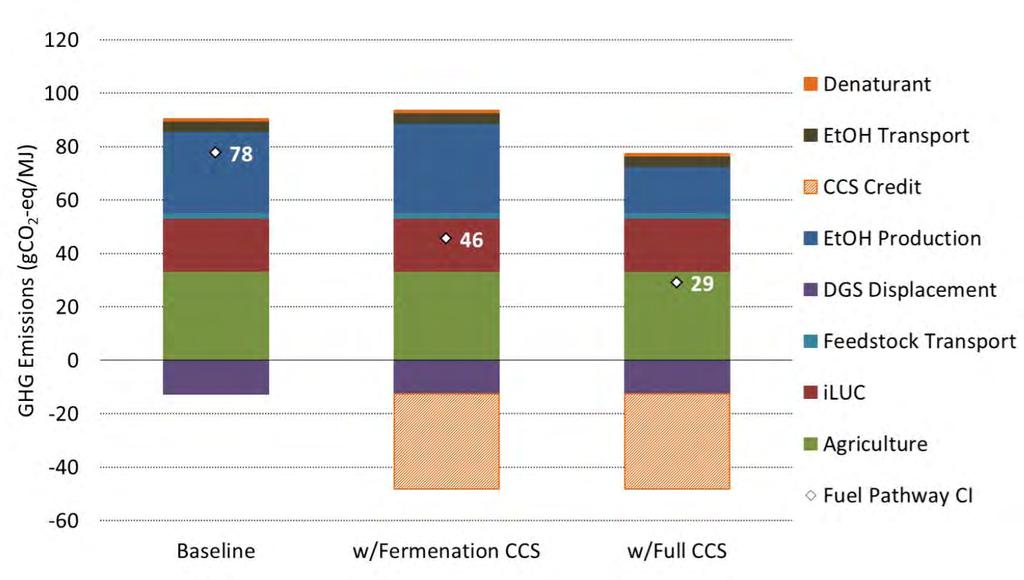
59 LCFS market analysis Question: What amount level of compliance can ethanol + CCS play in satisfying the LCFS mandate through 2030? Method: adapt ARB s 2015 compliance pathway Project through 2030 Continue 1.5% fuel demand decrease per year Adopt ARB assumptions of fuel carbon intensity (CI), ethanol demand growth via E85, and indirect land use change Continue 1%/yr decrease in CI CCS improves CI of corn ethanol by 32 gco2-eq/mj (McCoy 2016) Assume all ethanol is supplied by corn ethanol + CCS 59
60 LCFS conclusions Market size: max about 1.5 billion gallons / yr (~10% of ethanol supply) ARB 2015 compliance cases, on the contrary, assumes declining market share for corn ethanol, from 1.1 bgy -> 320 mgy by 2025 Carbon intensity: ~25 g/mj in 2030 vs. 57 without CCS One of the lowest CI fuels in market Sugarcane: 40 g/mj, Cellulosic: 20 g/mj, Renewable gasoline: 35 g/mj in 2030 Credits: roughly ~7-8 million credits (tco 2 abated / yr) through 2030 Overall impact: Creates attractive market for CCS deployment Cannot absorb entire cost-effective supply of ethanol+ccs Does not solve underlying problems with ethanol blending limitations in CA s low carbon fuel markets 60
61 CI scenarios through % Straight line to 12% Straight line to 20%
62 Ethanol market size and CIs Gasoline Demand mmgal 14,433 14,324 14,181 14,039 13,899 13,760 13,622 13,418 13,216 13,018 12,823 12, Ethanol % vol 9.91% Total Ethanol mmgal CI corn ethanol (g/mj) ARB ARB+C CS
63 63
64 64