Supply of safe drinking water through Water Security & Safety Plan approach
|
|
|
- Abner Harrington
- 5 years ago
- Views:
Transcription

1 Supply of safe drinking water through Water Security & Safety Plan approach April 19, 2017 CSIR NEERI, NAGPUR


2 CSIR - National Environmental Engineering Research Institute (CSIR-NEERI)


![clone [sequence not deposited] HKA12](/docs-images/90/104090840/images/3-6.jpg "Uncultured archaeon clone[ay996936](3) 812")
](/docs-images/90/104090840/images/3-7.jpg "674 HKA24 Uncultured archaeon")
 591 AY667272 1000 1000](/docs-images/90/104090840/images/3-8.jpg "Uncultured archaeon AF229778 Uncultured")
 865 HKA13 Uncultured")
 518 HKA22 531](/docs-images/90/104090840/images/3-10.jpg "Uncultured archaeon clone [AY996944](4)")
](/docs-images/90/104090840/images/3-11.jpg "HKA4 Uncultured archaeon clone[ay996929](2)")
 1000 HKA6 Uncultured")
 896 AJ576234](/docs-images/90/104090840/images/3-13.jpg "Uncultured archaeon 848 HKA46 Uncultured")
 HKA15](/docs-images/90/104090840/images/3-15.jpg "Uncultured Thermoplasmatales archaeon")
 1000 HKA19 Uncultured](/docs-images/90/104090840/images/3-16.jpg "archaeon clone[ay996941](1) Hazardous waste")


3 Carbon Credit: Soil carbon estimation 0.1 Ecorestoration Monitoring of Dioxins, Furans and PoPs Carrying Capacit y Uncultured marine eukaryote clone [sequence not deposited] HKA12 Uncultured archaeon clone[ay996936](3) 812 HKA8 Uncultured archaeon clone [AY996933](2) 674 HKA24 Uncultured archaeon clone[ay996945](4) 591 AY Uncultured archaeon AF Uncultured archaeon HKA34 Uncultured archaeon clone[ay996952](3) 865 HKA13 Uncultured archaeon clone[ay996937](3) 518 HKA Uncultured archaeon clone [AY996944](4) HKA36 Uncultured archaeon clone[ay996954](4) HKA4 Uncultured archaeon clone[ay996929](2) HKA11 Uncultured euryarchaeote clone[ay996935](3) 1000 HKA6 Uncultured archaeon clone [AY996931](4) 896 AJ Uncultured archaeon 848 HKA46 Uncultured archaeon clone [AY996962](2) HKA15 Uncultured Thermoplasmatales archaeon clone[ay996938](1) 1000 HKA19 Uncultured archaeon clone[ay996941](1) Hazardous waste Management EIA Studie s Monitoring, Mitigation & Restoratio n Carbon Capture & Sequestration Industries Tar Recovery Cleane r Energy Solar to Chemical Hydrogen Storage & Delivery Energy Sector Societal Mission Health Safe Drinking Water Rapid composting Smokeless Chulha Essential oils from citrus waste Cost effective fish food CSIR 800 Impact of Vector Control Toxicogenomics MSW Management Solar Electro-Defluoridation Phytorid for Sewage Treatment Materials for Arsenic, Fluoride & Iron removal Detection of waterborne Pathogens CSIR-NEERI Towards Nation Building
4 Water Technology and Management Division Water Safety Plan (WSP) Training Water Quality Monitoring & Surveillance (WQMS) Clean & Safe Water Environmental Impact Assessment PoU Treatment Development & Evaluation Advocacy with Government


5 CSIR-NEERI Technologies


6 Strategic plans for Rural Drinking water supply and sanitation Parameter households with piped water supply 35% 90% Public (Stand) Post 20% 10% Hand pumps 45% 10% Source: Nation Rural Drinking Water Supply Guidelines, 2013
7 Technological position in water ladder With increasing awareness, economic prosperity, people realizing the importance of time, rise in demand for : adequate quantity of water better quality of water supplied, and reliability of services Public stand posts Household connection - individual & multiple Tube wells, hand pumps Wells, protected springs Unprotected source, shallow hand pumps, canals, etc.


8 Water System Elements - Catchment Storage Treatment Catchment Distribution Aim to ensure supply of sufficient quantity of safe water End User Risk based approach (Catchment to Consumer)

9 FROM TOTLADOH DAM PROPOSED PUMPING UNIT & BPT PENCH KHAIRY DAM NAGPUR 24x7 Water Supply started KANHAN RIVER MAHADUL A PUMPING STATION PENCH-IV BINA JUNCTION BPT KANHAN WTP INTAKE WELLS GOREWAD A LAKE OG PENCH- II PENCH- III PENCH- I MB R ES R ES R NMC SERVICE AREA ES R ES R TO GORSI KHURD DAM

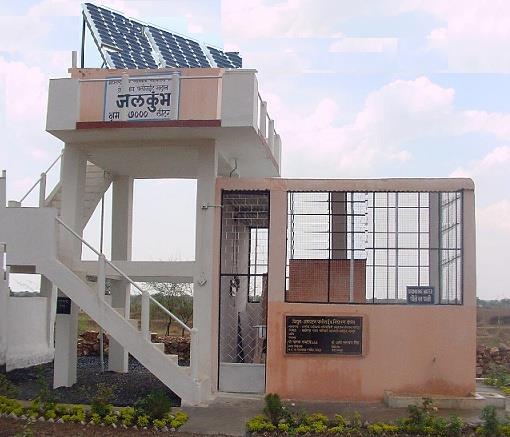
10 Bhendala Study Area Village : Bhendala Area : 7.56 km 2 Population: 1184 (census 2011) No. of Households: 244 Nirmal Gram Puraskar in 2010 Bhendala Source : Google Maps Piped network Sanitary interventions VWSC Revenue collection system

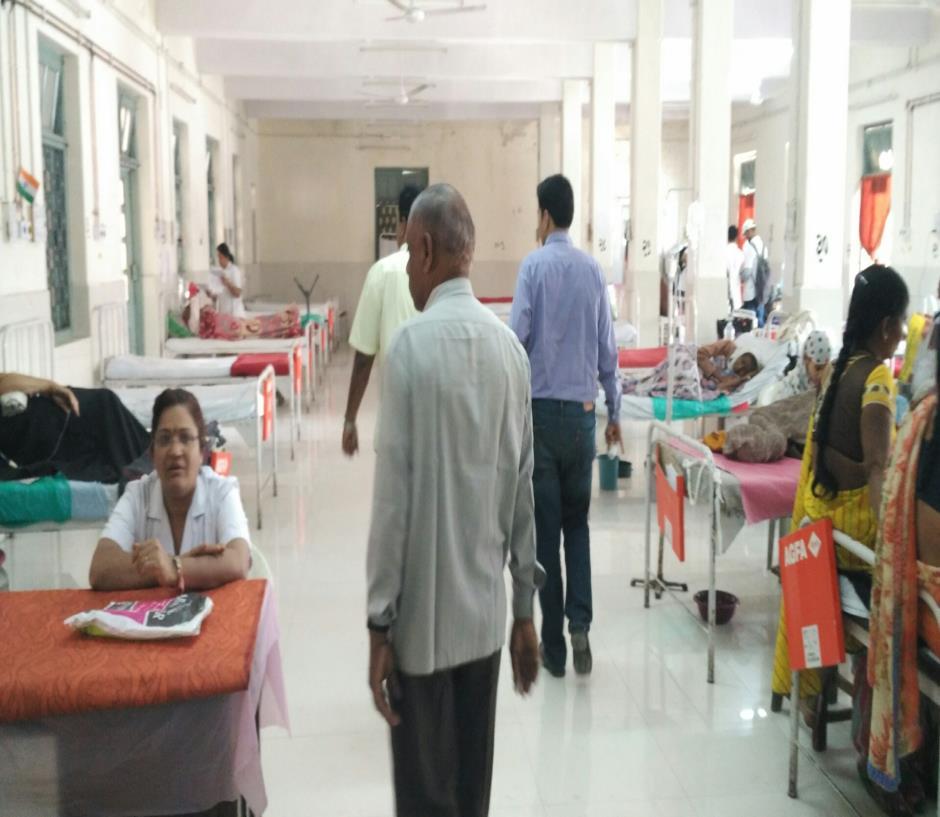
11 Government Medical College and Hospital Main Hospital Building TB Ward Building Super Specialty Hospital Building Medical College Building Dental College Building Main Hospital building - 44 wards, OPDs, 6 OTs, Autoclave room and Kidney unit TB ward building GMCH - Skin ward, Infectious ward and TB ward
12 CFU/100 ml Water Quality Nagpur TTC Avg TTC Max Intake Inlet Outlet Inlet Outlet Inlet Outlet Tap Storage Tap Storage Tap Storage Source WTP MBR ESR High Medium Low Sampling locations


13 Water Quality - Bhendala Source ESR Community Handpump & Household taps Household Storage


14 Water Quality GMC


15 Water Safety Plan Approach.. Risk Assessment System mapping Improvement Plan Control measures Monitoring + verification


16 28 7 Catchment Hazard Extraction Catchment Catchment Surface Water Reservoirs, Lakes & Drams Rivers Ground Water Dug Well Tube Well & Hand pumps Marine Water Open drains contaminating source Technological Intervention Natural Constructed wetlands
17 Totladoh Dam Pench Khairi Reservior Mahadula Pumping Gorwada Lake


18 Impact of catchment on source water quality 7.6 mg/l fluoride


19 Pump House Totladoh Dam Pench Khairi Reservior BPT Pench 4 WTP 2300 mm Line Mahadula Pumping Gorwada Lake
20 Treatment Extraction Treatment Storage Catchment Distribution Community Treatment Chemical treatment SS Arsenic Disinfection Pathogens Protozoa End User Risk Based Appraoch(Catchment to Consumer)
 Community Treatment Chemical treatment Arsenic Suspended Solids Disinfection Pathogens")
21 Treatment - Hazards Treatment Technological Intervention Community Arsenic Removal Disinfection Technologies Risk Based Approach (Catchment to Consumer) Community Treatment Chemical treatment Arsenic Suspended Solids Disinfection Pathogens Protozoa
22 Water System Elements - Catchment Extraction Treatment Storage Catchment Distribution Distribution & Storage Master Balancing Reservoir Elevated Service Reservoir Pump Station Distribution Lines End User Risk Assessment (Catchment to Consumer)


23 Water System Elements Storage & Distribution Storage Corrosion of Pipes Leakage Contamination / Loss of water Distribution Drinking pipeline laid in the open drain Crossing of Sewer Lines and Drinking pipeline Risk Assessment (Catchment to Consumer)

+0.7408(Ag l 0.")

24 Risk Assessment Arrangement Vulnerable Pipes Old Corroded Pipes Leakage in Network Intermittent Water Supply Hazards to Water Pipe Pipes close to Sewer Supply Line in Contact with Drain Soil and Surface Water Pollution Vulnerability Computation λ l = (D l ) (L l ) (P l ) (H l -1 ) (Ag l ) where, λ l is the failure rate of pipe i (based on the number of breaks/km/year); D l is the diameter of pipe i in mm; L l is the length of pipe i in km; P l is the hydraulic pressure of pipe i in meter; H l is the installation depth of pipe i in meter; and Ag l is the age of pipe i in years. Risk of Contaminan t Ingress
25 GIS Mapping and Risk Assessment Modeling Pipes in contaminant zone Results of Pipe Condition Assessment and Risk Assessment PCA Classification No. of Pipes Very Bad 3 Bad 15 Medium 293 Good 327 Very Good 290 Risk Classification No. of Pipes Very High 3 High 17 Medium 490 Low 418
26 Household & PoU Treatment Extraction Treatment Storage Catchment Distribution PoU Treatment Technology Disinfection TDS / Hardness Removal Chemical Contamination Arsenic Fluoride Nitrate. Handling Practices End User Risk Assessment (Catchment to Consumer)


27 Household & PoU Treatment PoU Treatment Technology Disinfection TDS / Hardness Removal Chemical Contamination Arsenic Fluoride Nitrate. Handling Practices Technological Intervention Nitrate Removal Technologies Electro Dearsenification / Defluoridation Chemo De aresenification / Defluoridation UV Based Disinfection Sanitary Survey for hand pumps / wells End User Risk Assessment (Catchment to Consumer)


28 Way Forward Interactions with Stakeholders Technical Assistance (Preparation of WSP) Training and awareness workshops Monitoring, Feedback & Improvement


29 Improvement Implementation PRE POST PRE POST

30 Improvement Implementation PRE POST

31 Change in water quality Sump Overhead Taps PoU taps Storage tank vessels Canteen PoU tap
32 Integration of Water Safety Plan & Sanitation safety Plan Safety planning approach Background with courtesy of Kate Medlicott (WHO)

33 Thank You 33