B U I L D I N G P A R T N E R S H I P S F O R E N E R G Y S E C U R I T Y
|
|
|
- Kelley Bryan
- 5 years ago
- Views:
Transcription

1 Importance of reliable and comparable energy statistics and energy efficiency indicators in national policies Kyiv, 8 October 2014 Peter Dal, Senior Expert B U I L D I N G P A R T N E R S H I P S F O R E N E R G Y S E C U R I T Y
2 Outline Introduction Energy supply and dependency Important energy issues in Ukraine and main purposes of energy statistics Energy planning, modelling and projections Transformation sector and renewables Energy efficiency indicators
3 3 Introduction
4 Almost any activity requires energy Energy supports nearly every aspect of a modern economy and is a key driver of economic development. The steady increases in economic activity in all sectors (transformation, industrial processes, services, transport and households) tend to put an upward pressure on energy consumption.
5
6
7 Energy supply and energy dependency 7
8 A continued increase in global energy consumption has lead to a pressure on prices Million toe Energy consumption by region '95 '00 '05 '10 '12 North America South and Central America Europe and Euroasia Middle East Africa Asia and Pacific 8
9 Spot market prices of crude oil High energy prices can be a heavy burden on net importers USD per Barrel, annual average '75 '80 '85 '90 '95 '00 '05 '10 '13* Brent, USD per barrel Brent, USD per barrel (2012 prices) *Prices for 2013 cover only the first six months. 9
10 IEA study on natural gas: The market is evolving fast Lesson learnt: Natural gas security is important Lessons for statistics? More accurate timely data on gas flows Non member country data..timely, accurate.. The power sector: Data for fuel switching Storage data Market transparency indispensable IEA: Gas demand grows in any scenario

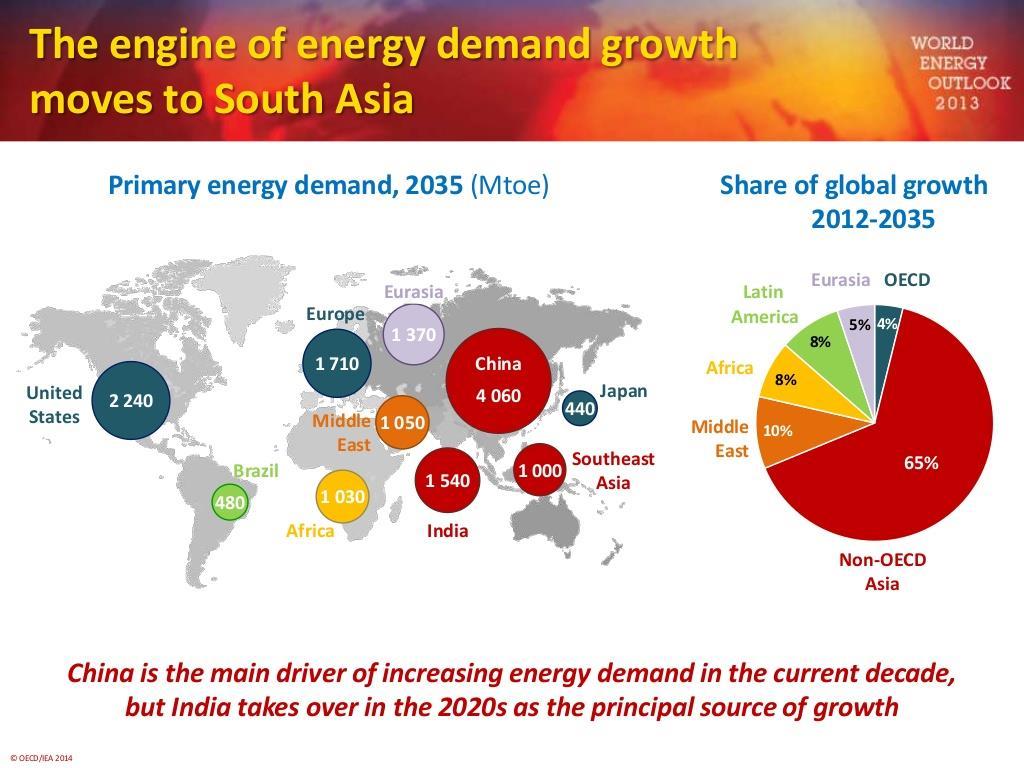
11 Today, Ukraine is very dependent on gas imports. Important political targets are maximal utilization of renewable energy sources and energy saving programs The development will be reflected in the energy statistics Here a boat with wood pellets 11
12 To avoid a world-wide energy crisis The situation An increasing demand for energy and fossil resources becoming more difficult to extract Fossil fuels become more expensive Need for reducing green house gas emissions The responses Moderating the demand by improving energy efficiency Developping non carbon energies (nuclear or renewables) Good quality statistics are necessary Renewables is a challenge: Many kind of RES Each kind of RES is a specific problem, needing a mix of surveys, administrative sources and modeling
13 Important energy issues in Ukraine Main purposes of energy statistics 13
14 Important energy issues in Ukraine Main targets in the Ukrainian energy strategy: Development of the nuclear energy system Integration of electricity and gas markets Security of energy supplies and the transit of hydrocarbons Development of the coal sector (fuel diversification) Development of renewable energy (fuel diversification and clean energy) Improving energy efficiency in the transformation sector and in final consumption Source: Implementation of the EU-Ukraine Memorandum of Understanding on Energy Cooperation during 2013
15 Main purposes of energy statistics Description of an important economic sector (degree of self-sufficiency, import dependency by fuels, share of renewables etc.) Input into forecasting Input into calculation of energy efficiency indicators Main input into calculation of emissions from energy production and consumption, incl. CO 2 CO 2 from energy is the most important component in a country s greenhouse gas inventory Basis for energy planning, energy policy and monitoring of energy policy By its very nature, an unreliable energy statistics could cause major problems for a country! 15
16 Energy data needed Supply data (production, imports/exports, stocks) Data on the transformation sector, incl. capacities and transmission Data on energy consumption (in companies, in households, in services and for transport) The above data constitute the energy balance For energy efficiency indicators more detailed data are needed (e.g. in households: Energy for space heating, water heating, cooking and electrical appliances) Energy prices 16

17 statistics Comparable energy statistics is obtained by use of international guide lines (joint IEA/ Eurostat/UN manual 17
18 18 Energy planning etc.
19 Energy statistics go hand-in-hand with planning, modelling and projections Mid- to long-term energy projections/forecasts help to provide strategic direction for decision makers Inform policy makers in government Outline pathways forward for businesses to make appropriate investment decisions Foundation of any good model/forecast is the baseline statistics The quality of the modelling is essentially a function of the quality and disaggregation of the data available
20 The energy planning process Planning of energy systems is especially important due to its specific features The energy systems are characterized by: A long lead time is required to build infrastructures which provide additional energy Capital intensive considerable investments are required, with long term payback period Multiple alternatives in options to provide the needed energy Good governance is to plan well in advance


21 The energy planning process Economic Growth Analysis Energy Resource Analysis Energy Demand Analysis Energy Technology Analysis Energy Supply/Demand Balance Impacts Analysis Decision Analysis Feedback
22 GDP and total final energy consumption Danish statistics and projection Index 2000= Climate adjusted '00 '05 '10 '15 '20 '25 GDP Final energy consumption 22
23 Global CO 2 emissions IEA: Energy efficiency will play a key role in the future Gt CO Baseline emissions 57 Gt BLUE Map emissions 14 Gt WEO ppmcase ETP2010 analysis CCS 19% Renewables 17% Nuclear 6% Power generation efficiency and fuel switching 5% End-use fuel switching 15% End-use fuel and electricity efficiency 38% Forecast: Energy efficiency will account for almost half of the reduction
24 Transformation sector and renewables 24

25 Policy targets for electricity and natural gas - Regional integration of the electricity and gas markets - Substitutes: Diversification of fuels Requirements: Good planning High quality statistics

26 Also an energy target : Maximum utilization of renewable energy sources The planning process and monitoring of the results are supported by a detailed energy statistics
27 Renewable power generation mix 2010 Total renewables: TWh Renewable municipal waste (31 TWh) Solid biomass (163 TWh) Hydro 85.9% Biogas (31 TWh) Liquid biomass (3 TWh) Other 14.1% Geothermal (65 TWh) Solar PV (12 TWh) Solar CSP (1 TWh) Ocean (1 TWh) Wind (219 TWh) Source: IEA statistics World wide: 19% of electricity from renewable sources in 2010
28 Wind power capacity and wind power s share of domestic electricity supply High priority in Denmark MW % 30% 25% 20% 15% 10% 5% '95 '00 '05 '10 '12 Wind power offshore capacity, M W Wind power onshore capacity, M W Wind power's share of domest ic elect ricit y 0%
29 Energy efficiency indicators 29
30 IEA: Today, energy efficiency has reached the top of the political agenda Save energy in all sectors: Residential, Transports, Industry, Services Electricity generation Concerns a variety of economic players Households, governments, utilities, manufacturers, etc. Increase exports - reduce imports Increase domestic (and global) energy security Strengthen RD&D Create jobs Reduce greenhouse gas (mainly CO 2 ) emissions
31 What are energy efficiency indicators? Tools: based on detailed statistics to analyse energy use and efficiency trends Examine impacts of economic activity and structure, income, prices, policies, etc Support national policy-making and are used to shape priorities for future action and to monitor progress Used for estimating CO 2 savings, so a key element of environment policy tool

32 The efficiency indicators pyramid (IEA) Aggregated Indicators TPES/GDP TPES/Production Electricity Cons./Population CO2/GDP PPP Efficiency Elec. Prod. Energy Intensity End-use Energy Intensity Unit Energy Consumption Disaggregated Indicators Process/Appliance Efficiency Cons./ton cement Heating/m 2 Litre/100km (stock) Dry process Condensing boiler Litre/100km What are the data needed to build a minimum set of disaggregated indicators?
33 Indicators in more levels Need for aggregate as well as specified data Macro level: Gross and final energy consumption Gross domestic product (GDP) Sector level Energy consumption per sector and use Value added (+employee) and socio economic data Industrial processes, electrical appliances and specific consumption (e.g. new cars litre/100km)


34 The ODYSSEE - MURE Network E CONOTEC C O N S U L T A N T S 34
35 Energy efficiency indicators: Odyssee-Mure Important information on political use of energy statistics and indicators in member countries Odyssee-Mure home page Publications - Free to download National reports,
36 Final energy intensity, climate adjusted koe/ ,16 Austria Denmark 0,14 France Germany 0,12 Italy Netherlands Sweden 0,1 UK Norway EU 0,08 0, Source: Odyssee 36
37 Thank you for attention! Peter Dal Senior Expert, Energy Statistics INOGATE Technical Secretariat and Integrated Programme in support of the Baku Initiative and the Eastern Partnership energy objectives