Investor Presentation August 2016
|
|
|
- Felicity Ford
- 5 years ago
- Views:
Transcription


1 Investor Presentation August 2016
2 Cautionary Statement Information Current as of August 3, 2016 Except as expressly noted, the information in this presentation is current as of August 3, 2016 the date on which PGE filed its Quarterly Report on Form 10-Q for the quarter ended June 30, 2016 and should not be relied upon as being current as of any subsequent date. PGE undertakes no duty to update the presentation, except as may be required by law. Forward-Looking Statements Statements in this news release that relate to future plans, objectives, expectations, performance, events and the like may constitute forward-looking statements within the meaning of the Private Securities Litigation Reform Act of 1995, Section 27A of the Securities Act of 1933, as amended, and Section 21E of the Securities Exchange Act of 1934, as amended. Forward-looking statements include statements regarding earnings guidance; statements regarding the expected capital costs for the Carty Generating Station and the recovery of those costs; statements regarding future load, hydro conditions and operating and maintenance costs; statements concerning implementation of the company s integrated resource plan; statements concerning future compliance with regulations limiting emissions from generation facilities and the costs to achieve such compliance; as well as other statements containing words such as anticipates, believes, intends, estimates, promises, expects, should, conditioned upon, and similar expressions. Investors are cautioned that any such forward-looking statements are subject to risks and uncertainties, including reductions in demand for electricity; the sale of excess energy during periods of low demand or low wholesale market prices; operational risks relating to the company s generation facilities, including hydro conditions, wind conditions, disruption of fuel supply, and unscheduled plant outages, which may result in unanticipated operating, maintenance and repair costs, as well as replacement power costs; failure to complete capital projects on schedule or within budget, or the abandonment of capital projects, which could result in the company s inability to recover project costs; the costs of compliance with environmental laws and regulations, including those that govern emissions from thermal power plants; changes in weather, hydroelectric and energy markets conditions, which could affect the availability and cost of purchased power and fuel; changes in capital market conditions, which could affect the availability and cost of capital and result in delay or cancellation of capital projects; the outcome of various legal and regulatory proceedings; and general economic and financial market conditions. As a result, actual results may differ materially from those projected in the forward-looking statements. All forward-looking statements included in this news release are based on information available to the company on the date hereof and such statements speak only as of the date hereof. The company assumes no obligation to update any such forward-looking statement. Prospective investors should also review the risks and uncertainties listed in the company s most recent annual report on form 10-K and the company s reports on forms 8-K and 10-Q filed with the United States Securities and Exchange Commission, including management s discussion and analysis of financial condition and results of operations and the risks described therein from time to time.
3 PGE Value Drivers Clear focus: 100% regulated utility Attractive service territory Progressive environmental and renewable position Focus on operational efficiency Strong financial position Generation and T&D investment opportunities 3


4 4 STRONG PLATFORM FOR STAKEHOLDER VALUE The Company The Strengths The Execution
5 PGE at a Glance Quick Facts: Vertically integrated generation, transmission and distribution 859,497 customers (1) 46% of Oregonians Majority of Oregon s commercial and industrial activity Financial Snapshot (2) : Beaver Port Westward 1 & 2 26 OREGON Portland I-5 WASHINGTON Sandy T.W. Sullivan River River Mill Faraday North Fork Salem Columbia River 84 Oak Grove Montana Colstrip 3 & 4 Washington Tucannon River Wind Farm Eastern Oregon Coyote Springs Biglow Canyon Boardman Carty Madras, Oregon Pelton Round Butte Revenue: $1.9 billion Earnings per share: $2.04 Hydro Gas Coal Wind Service territory Net Utility Plant Assets: $6.0 billion (1) As of 6/30/2016 (2) As of 12/31/2015 5

6 Strategic Direction Mission: To be a company our customers and communities can depend upon to provide electric service in a safe, sustainable and reliable manner, with excellent customer service, at a reasonable price. The path forward is guided by: Strong relationships with customers and community Empowering employees Opportunity to grow the business Delivering value to all stakeholders 6
 2016E load growth of approximately 1% Retail Load (1) (Million MWhs")
7 (1) On a cycle basis and adjusted for weather, excluding one large paper company, and net of energy efficiency (2) Annualized growth in Nonfarm Payroll Employment from the State of Oregon Employment Department June 2016, Population growth estimates for 2015 from US Census Bureau 7 Attractive, Growing Service Area Load Growth (1) 2016E load growth of approximately 1% Retail Load (1) (Million MWhs Rounded) Driven by: Residential customer growth Strong industrial deliveries growth Strong Economic Conditions (2) 18.6 Oregon employment growth of approximately 3% Oregon population growth of 1.5% Energy Efficiency Incremental EE expected in 2016E is equivalent to approximately 1.5% in load growth E Long-term forecast ~1% annually through 2030
 May 2020 John Savage [D] Mar 2017 Stephen Bloom [R] Nov")
8 Constructive Regulatory Environment Regulatory Construct Oregon Public Utility Commission 9.6% allowed return on equity 50% debt and 50% equity capital structure Governor-appointed three-member commission Chair: Lisa Hardie [D] (1) May 2020 John Savage [D] Mar 2017 Stephen Bloom [R] Nov 2019 Forward test year Integrated Resource Planning (IRP) Renewable Portfolio Standard (RPS) Regulatory Mechanisms Net variable power cost recovery Annual Power Cost Update Tariff (AUT) Power Cost Adjustment Mechanism (PCAM) Decoupling through 2016 (2) Renewable Adjustment Clause (1) Newly appointed at the end of May 2016 (2) PGE filed for a three year extension of the decoupling mechanism on March 1, A settlement was reached in July and the final order is expected by mid-august 8


9 9 STRONG PLATFORM FOR STAKEHOLDER VALUE The Company The Strengths The Execution
10 10 Key Strengths 1 High customer satisfaction 2 Diverse generation and customer base 3 High quality utility operations 4 Solid financial performance 5 Strong financial position


11 1. High Customer Satisfaction Top Quartile System Reliability Edison Electric Institute Top Quartile Customer Satisfaction TQS Research, Inc. Most Trusted Brand Market Strategies International Top Ranked Renewable Energy Program National Renewables Energy Laboratory All customer satisfaction and reliability measures consistently top quartile 11
 Total = $1.")


12 2. Diverse Generation and Customer Base Retail Revenues by Customer Class (2015) Total = $1.78B Power Sources as a Percent of Retail Load (2016 AUT) (1) Total = 2,120 MWa Industrial 13% Purchased Power 12% Hydro 21% Commercial 37% Residential 50% Natural Gas 37% Wind & Solar 13% Coal 17% (1) Hydro and wind/solar include PGE owned and contracted resources; purchased power includes long-term contracts 12

13 3. High Quality Utility Operations Highly dependable PGE generation portfolio with five-year average availability of 92% (1) Strong power supply operations to stabilize and optimize power costs Progressive approach to reduce coal generation Boardman 2020 Plan T&D investment to ensure high reliability and customer satisfaction High Quality Utility Operations Ongoing investment in technology to improve service and capture efficiencies (1) Represents 2011 through
 2014 2015 9.0% 8.3% 7.9% 9.4% 8.3% 10.0% 10.0% 10.0% 9.75% 9.68% 2.3 2.1 1.9 1.7 1.5 1.3 1.")
14 4. Solid Financial Performance EPS NI ROE Allowed ROE $1.95 $147 Net Income, Earnings per Share, and ROE (NI in millions) $1.87 $141 $1.84 $142 $1.35 (2) $105 (2) $2.18 $2.04 $175 $ (1) % 8.3% 7.9% 9.4% 8.3% 10.0% 10.0% 10.0% 9.75% 9.68% (1) 2013 displays full-year non-gaap adjusted operating earnings, which excludes the negative impact of the Cascade Crossing expense ($0.42 EPS) and the customer billing refund ($0.07 EPS) (2) GAAP earnings for year-end 2013 were $105 million or $1.35 per diluted share 14
 Based on the company achieving earnings and cash flow estimates and other factors influencing dividends and subject to approval of the Board of Directors")
15 4. Consistent Dividend Growth $0.92 $0.96 $1.00 $ % CAGR $1.05 $1.07 $1.09 $1.11 $1.16 $ Target Payout Ratio % % Actual Payout Ratio 0.30 Note: Represents annual dividends paid (1) Based on the company achieving earnings and cash flow estimates and other factors influencing dividends and subject to approval of the Board of Directors Annual dividend increases expected to be in the 5-7% range (1) 15
 (in millions) Financial Resources Investment grade credit ratings")

 All values as")
16 5. Strong Liquidity Position for Growth Revolving Credit Facilities (1) (in millions) Financial Resources Investment grade credit ratings Total Credit Facilities & Cash $660 Available Credit + Cash $661 Manageable debt maturities Target capital structure of 50% debt and 50% equity S&P Moody s Senior Secured A- A1 Cash $93 Letters of Credit -$92 Senior Unsecured BBB A3 Outlook Stable Stable (1) All values as of 6/30/


17 17 STRONG PLATFORM FOR STAKEHOLDER VALUE The Company The Strengths The Execution
 Carty CWIP balance as of 6/30/2016: $587M (2) (1) Total estimated cost does not reflect any")
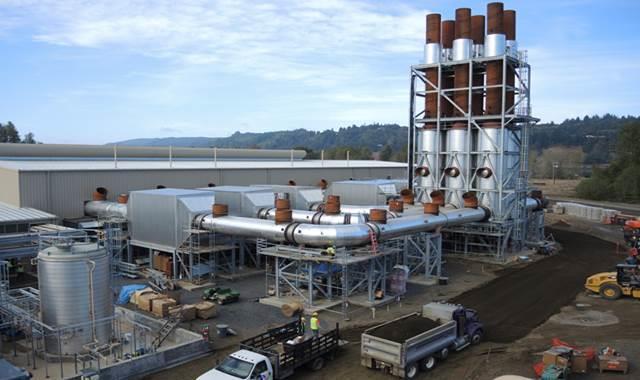
18 New Generation: Baseload Resource Carty Generating Station: Placed in-service on July 29, 2016 Carty Generating Station, a 440 MW natural gas baseload plant near Boardman, OR Capital costs, including AFDC, approved in 2016 GRC: $514M Total estimated cost, including AFDC, for completion: $640-$660M (1) Carty CWIP balance as of 6/30/2016: $587M (2) (1) Total estimated cost does not reflect any amounts that may be received from sureties under the performance bond, the original contractor, or contractor s parent company (2) Includes $59 million of AFDC 18


19 Executing on New Generation Tucannon River Wind Farm Capacity: 267 MW In-service date: Dec Project cost: $525 M On time On budget Port Westward Unit 2 Capacity: 220 MW Fuel: Natural Gas Reciprocating Engines In-service date: Dec Project cost: $311 M Note: Final completion costs include AFDC and 2015 capital expenditures of $25 million and $7 million for Tucannon River Wind Farm and Port Westward Unit 2, respectively 19
20 MWa Load-Resource Forecast Projected Annual Average Energy Load-Resource Balance (1) : 149 MWa Surplus : 419 MWa Deficit 2030: 793 MWa Deficit Year Gas Wind+Solar Hydro Contracts Coal Energy Efficiency Load (1) Load-resource forecast as included in the 2013 IRP update filed in December 2015; assumes normal hydro conditions 20
 Estimated expenditures for project not reflected in chart because the")
21 Note: Amounts do not include AFDC (1) Consists of board-approved ongoing Cap Ex and hydro relicensing per the Form 10-Q filed on August 3, 2016 (2) Total estimated cost does not reflect any amounts that may be received from sureties under the performance bond, the original contractor, or contractor s parent company (3) Estimated expenditures for project not reflected in chart because the project is subject to OPUC approval 21 Forecasted Capital Expenditures $ millions $626 - $646 $194 $214 $432 Additional capital investments are being reviewed by management to improve system safety and reliability, reduce risk exposures and modernize systems to meet customer expectations. $398 $316 $282 $301 Outlook In April the Board of Directors approved spending for the Field Voice Communications project. Management identified an opportunity for investment in a natural gas project. (3) Base Capital Spending (1) (2) Carty Generating Station
22 22 Clean Electricity Plan and Coal Transition Plan Key Elements of Plan Increase the renewable portfolio standard to 50 percent in 2040 Transitions Oregon off coal-fired generation by 2035 Includes PTCs in power costs, beginning with AUT filing for % 35% 45% 50% Reaffirms state s commitment to energy-efficiency programs 20% Encourages transportation electrification Increases access to solar energy for more Oregonians Flexibility to achieve goals while working with the Oregon Public Utility Commission New renewable portfolio standards

23 23 Request For Proposal for Renewables Results of OPUC hearing At a special hearing on July 29, 2016, the OPUC adopted Staff's recommendation and took no action on PGE's request for approval of an accelerated RFP. PGE is conducting further process and analysis on the accelerated renewables RFP and will determine appropriate timing for seeking approval of a revised RFP schedule.
24 Integrated Resource Plan Standard IRP Process Timeline: 4 th Quarter 2016 File IRP 1 st Half 2017 OPUC acknowledgement expected 2 nd Half 2017 RFP process commences 2018 Expected to reach decisions on RFPs Areas of focus Energy efficiency and demand side actions 2020 Renewable Portfolio Standard requirement of 20 percent and impacts of the Oregon Clean Electricity Plan Boardman replacement Energy and capacity needs
25 PGE Value Proposition High quality utility operations Attractive service territory Strong financial position Strong Platform executing Sustained Long Term Growth Progressive renewable position Generation and T&D investment opportunities New investments drive rate-base growth 25
26 PGE Investor Relations Team William Valach Director, Investor Relations* (503) Christopher Liddle Manager, Corporate Finance & Investor Relations (503) Jacquelyn Ferchland Portland General Electric Analyst, Investor Relations (503) Investors.PortlandGeneral.com 121 S.W. Salmon Street Suite 1WTC0509 Portland, OR * After 25 years with PGE and 10 years leading the Investor Relations team, Bill Valach will be retiring on August 19,
27 Portland General Electric Appendices
 Beaver Units 1-8 508 11% Coyote Springs 243 5%")
 267 6% Wind and Solar Contracts 52 1% 769 17% Purchased Power 568 12% Power Sources as a Percent of Retail Load (2015 Actuals)")


28 Diversified Resource Mix Resource Capacity as of 12/31/15 Capacity in MW % of Total Capacity Hydro (1) Deschutes River Projects 303 7% Clackamas/Willamette River Projects 192 4% Hydro Contracts % 1,087 24% Natural Gas/Oil (1) Beaver Units % Coyote Springs 243 5% Port Westward Unit % Port Westward Unit % 1,371 30% Coal (1) Boardman % Colstrip 296 6% % Wind Biglow Canyon (2) % Tucannon River (3) 267 6% Wind and Solar Contracts 52 1% % Purchased Power % Power Sources as a Percent of Retail Load (2015 Actuals) Total = 18,831,000 MWh Purchased Power 26% Natural Gas 25% Hydro 16% Wind 11% Coal 22% Total 4, % (1) Capacity of a given plant represents the megawatts the plant is capable of generating under normal operating conditions, net of electricity used in the operation of the plant. (2) With respect to Biglow Canyon, capacity represents nameplate and differs from expected energy to be generated, which was a 26% capacity factor in (3) With respect to Tucannon River Wind Farm, capacity represents nameplate and differs from expected energy to be generated, which was a 32% capacity factor in
 2017 Power Sources as")


, and Carty Generating Station (natural gas, July")

 Based on an estimated forecast")

29 Changing Generation Portfolio 2013 Power Sources as a Percent of Retail Load (2013 Actuals) 2017 Power Sources as a Percent of Retail Load (2017 Estimate) (1) Purchased Power 35% Natural Gas 18% Hydro 17% Wind & Solar 8% Coal 22% 4 years later Coal 19% Hydro 21% Natural Gas 47% Wind & Solar 13% Changes driven by: New generation: Port Westward Unit 2 (natural gas, Q4 2014), Tucannon River (wind, Q4 2014), and Carty Generating Station (natural gas, July 2016) Next requirements under Oregon s RPS (requiring a portion of PGE s retail load to be serviced by renewable resources): 20% by 2020, 27% by 2025, 35% by 2030, 45% by 2035 and 50% by 2040 (1) Based on an estimated forecast which includes new generation from Carty Generating Station Note: For both charts, hydro and wind/solar include PGE owned and contracted resources 29
30 Financing Activity Equity Issuances Date Shares Net Proceeds Equity Forward Sale Agreement June million -- Draw pursuant to forward August million $20 million Draw pursuant to forward June million $271 million Net remaining shares available for issuance: 0 Equity Over-Allotment June million $46 million Long-term Debt ($ in millions) Issued: Amount Issuance Date Coupon Maturity $100 8/15/ % 2045 $100 10/15/ % 2046 $80 11/17/ % 2024 $75 1/15/ % 2030 Matured/Redeemed: Amount Date $70 Matured Jan 2015 $67 Redeemed May 2015 $75 Redeemed Jan 2016 $58 Redeemed Jan 2016 $70 5/19/ % 2035 $140 1/6/ % 2021 $50 5/4/16 ~1.1% Nov 2017 $75 6/15/16 ~1.1% Nov
31 Generation Plant Operations Track record of high availability PGE Thermal Plants 90% 92% 84% 89% 89% PGE Hydro Plants 100% 99% 100% 100% 99% PGE Wind Farm 97% 98% 98% 94% 97% PGE Wtd. Average 93% 94% 89% 92% 93% Colstrip Unit 3 & 4 84% 93% 66% 83% 93% Generation Reliability and Maintenance Excellence Program Corporate strategy started in 2007 to increase availability of PGE s generation plants and increase predictability of plant dispatch costs for power operations Key Elements Reliability Centered Maintenance (RCM) modeling for PGE s generating plants and incorporation of models into PGE s maintenance management system (Maximo) Root Cause Analysis (RCA) for unplanned generation outages, which expedites communication across PGE s fleet on both resolution and prevention actions Internal training on technical skills, including inspection, welding and metallurgy supporting both RCM and RCA efforts 31
32 2013 Integrated Resource Plan 2013 IRP was acknowledged by the OPUC on 12/2/14 and PGE received written confirmation on stipulations to incorporate into the 2016 IRP development PGE filed a 2013 IRP update in December 2015 Action Plan Resource Additions through 2017 No new long-term supply side resources proposed in this IRP Hydro contract renewals Proceed with demand side resource procurement Energy Efficiency: 124 MWa by 2017 Dispatchable Standby Generation (DSG): additional 23 MW (total of 116 MW) Demand Response (DR): additional 25 MW (total of 45 MW) Short and mid-term market purchases & sales to balance portfolio Action Plan Studies and Initiatives to Inform 2016 IRP Operational flexibility assessment Third party load forecast methodology assessment/study Assessment of emerging EE, in conjunction with Energy Trust of Oregon (ETO) Dynamic dispatch requirement / capabilities assessment, and review of new analytical tools for optimizing portfolio commitment and dispatch Distributed generation evaluation Boardman biomass technical & economic assessments (continuation of current plan) Assessment of longer-term gas supply alternatives to address price volatility Transmission Requirements Retain and/or acquire required service under Bonneville Transmission Administration s Open Access Transmission Tariff 32
33 Return on Equity 33 Recovery of Power Costs Annual Power Cost Update Tariff Annual reset of prices based on forecast of net variable power costs (NVPC) for the coming year Subject to OPUC prudency review and approval, new prices go into effect on or around January 1 of the following year Power Cost Adjustment Mechanism (PCAM) Power Cost Sharing Earnings Test for 2016 Customer Surcharge 90/10 Sharing 8.6% Customer Surcharge Baseline NVPC $30 million ($15) million 90/10 Sharing Deadband 9.6% 10.6% Customer Refund Customer Refund PGE absorbs 100% of the costs/benefits within the deadband, and amounts outside the deadband are shared 90% with customers and 10% with PGE An annual earnings test is applied, using the regulated ROE as a threshold Customer surcharge occurs to the extent it results in PGE s actual regulated ROE being no greater than 8.6%; customer refund occurs to the extent it results in PGE s actual regulated ROE being no less than 10.6%
34 2016 General Rate Case Oregon Public Utility Commission Order Overall increase in customer prices: 0.7% Return on Equity: 9.6% Capital Structure: 50% debt, 50% equity Cost of Capital: 7.51% Rate Base: $4.4 billion (1) Annual revenue requirement increase: $12 million Customer Prices Base Business: January 1, 2016 Carty: August 1, 2016 Customer price changes: Base business reduction of 2.5% Carty increase of 2.5% (1) Includes Carty at $514 million 34
35 35 Current Renewable Portfolio Standard Additional Renewable Resources PGE s 2009 Integrated Resource Plan addressed procurement of renewable resources to meet the 2015 requirement of Oregon s Renewable Portfolio Standard (RPS). To help meet this standard PGE built Tucannon River Wind Farm, a 267 megawatt, 116 turbine wind resource located in southeastern Washington RPS 5% 15% 20% 27% 35% 45% 50% Renewable Portfolio Standard qualifying resources supplied approximately 10% of PGE s retail load in 2012, 2013, & 2014, and 15% of retail load in Renewable Adjustment Clause (RAC) Renewable resources can be tracked into prices, through an automatic adjustment clause, without a general rate case. A filing must be made to the OPUC by the sooner of the online date or April 1 in order to be included in prices the following January 1. Costs are deferred from the online date until inclusion in prices and are then recovered through an amortization methodology.
36 36 Decoupling Mechanism The decoupling mechanism is intended to allow recovery of margin lost due to a reduction in sales of electricity resulting from customers energy efficiency and conservation efforts. This includes a Sales Normalization Adjustment (SNA) mechanism for residential and small nonresidential customers ( 30 kw) and a Lost Revenue Recovery Adjustment (LRRA), for large nonresidential customers (between 31 kw and 1 MWa). The SNA is based on the difference between actual, weather-adjusted usage per customer and that projected in PGE s 2015 general rate case. The SNA mechanism applies to approximately 61% of 2015 base revenues. The LRRA is based on the difference between actual energy-efficiency savings (as reported by the ETO) and those incorporated in the applicable load forecast. The LRRA mechanism applies to approximately 26% of 2015 base revenues. In PGE s 2014 General Rate Case, PGE and parties stipulated to the extension of the decoupling mechanism for three years, through the end of In addition, the use-per-customer baseline was adjusted for new connects with lower energy usage. There were no changes or extensions to the decoupling mechanism in the either the 2015 or 2016 General Rate Cases. PGE filed for another 3-year extension of the decoupling mechanism on March 1, 2016 under docket UE 306. Recent Decoupling Results (in millions) Q1 & Q Sales Normalization Adjustment $(6.6) $(6.9) $2.8 Lost Revenue Recovery Adjustment $1.4 $(1.9) $0.0 Total adjustment $(5.2) $(8.8) $2.8 Note: refund = (negative) / collection = positive
 NW IOU and Public Average 10.0 NW IOU and Public Average 8.")
37 Average Retail Price Comparison Residential and Commercial Summer 2015 Residential Electric Service Costs Northwestern Investor-Owned and Public Utilities 1,000 kwh per Month (cents per kwh) Commercial Electric Service Prices Northwestern Investor-Owned and Public Utilities 40 kw Demand - 14,000 kwh per Month (cents per kwh) NW IOU and Public Average 10.0 NW IOU and Public Average 8.6 EEI U.S. Average* 13.7 EEI U.S. Average* 11.8 PGE - Sch 7 (OR) 11.7 PGE - Sch 83 (OR) 9.4 Western OR Elec Coop (OR) 17.6 Western OR Elec Coop (OR) 12.8 Emerald PUD (OR) 9.8 Emerald PUD (OR) 8.7 Tacoma Power (WA) 8.5 Tacoma Power (WA) 7.8 Snohomish PUD (WA) 9.5 Snohomish PUD (WA) 8.5 Seattle City Light (WA) 9.9 Seattle City Light (WA) 8.0 Clark PUD (WA) 9.4 Clark PUD (WA) 8.4 Tillamook PUD (OR) 9.1 Tillamook PUD (OR) 6.8 Salem Electric (OR) 8.5 Salem Electric (OR) 7.0 Eugene WEB (OR) 7.6 Eugene WEB (OR) 8.6 Columbia River (OR) 7.2 Columbia River (OR) 6.9 Rocky Mountain Power (UT) 11.8 Rocky Mountain Power (UT) 10.1 Puget Sound (WA) 10.2 Puget Sound (WA) 9.7 PacifiCorp (WA) 8.4 PacifiCorp (WA) 8.3 Avista (WA) n/a Avista (WA) n/a Idaho Power (ID) 10.5 Idaho Power (ID) 7.4 PacifiCorp (OR) 11.1 PacifiCorp (OR) * This average is based on Investor-owned utilities only. 37
 NW IOU and Public Average EEI U.S. Average* PGE - Sch 85 Primary (OR) 7.2 7.9 9.")
38 Average Retail Price Comparison Small and Large Industrial Summer 2015 Small Industrial Electric Service Prices Northwestern Investor-Owned and Public Utilities 1,000 kw Demand - 400,000 kwh per Month, Primary Voltage (cents per kwh) NW IOU and Public Average EEI U.S. Average* PGE - Sch 85 Primary (OR) Large Industrial Electric Service Prices Northwestern Investor-Owned and Public Utilities 50,000 kw Demand - 32,500,000 kwh per Month, Subtransmission Voltage (cents per kwh) NW IOU and Public Average EEI U.S. Average* PGE - Sch 89 Subtrans (OR) Western OR Elec Coop (OR) Emerald PUD (OR) Tacoma Power (WA) Snohomish PUD (WA) Seattle City Light (WA) Clark PUD (WA) Tillamook PUD (OR) Salem Electric (OR) Eugene WEB (OR) Columbia River (OR) Rocky Mountain Power (UT) Puget Sound (WA) PacifiCorp (WA) Western OR Elec Coop (OR) Emerald PUD (OR) Tacoma Power (WA) Snohomish PUD (WA) Seattle City Light (WA) Clark PUD (WA) Tillamook PUD (OR)** Salem Electric (OR) Eugene WEB (OR) Columbia River (OR) Rocky Mountain Power (UT) Puget Sound (WA) PacifiCorp (WA) n/a Avista (WA) n/a Avista (WA) n/a Idaho Power (ID) 7.2 Idaho Power (ID)** n/a PacifiCorp (OR) 7.5 PacifiCorp (OR) * This average is based on Investor-owned utilities only. ** Idaho Power does not report a price to EEI for large industrial customers at this usage and demand level. Tillamook PUD does not offer a large general service tariff on their web site. 38