Drinking Water Quality in the Horizons Region
|
|
|
- Shannon Kelly
- 5 years ago
- Views:
Transcription


1 Drinking Water Quality in the Horizons Region November 2014 Horizons Report 2014/EXT/1405
2 Prepared for: Dr Jon Roygard November 2014 Science Manager Report No. 2014/EXT/1405 Horizons Regional Council ISBN Palmerston North Prepared by: Pattle Delamore Partners Ltd 295 Blenheim Road Upper Riccarton Christchurch Phone: Ref: C R002 CONTACT 24 hr Freephone help@horizons.govt.nz SERVICE CENTRES Kairanga Cnr Rongotea and Kairanga-Bunnythorpe Roads Palmerston North Marton Hammond Street Taumarunui 34 Maata Street REGIONAL HOUSES Palmerston North Victoria Avenue Wanganui 181 Guyton Street DEPOTS Levin 11 Bruce Road Taihape Torere Road Ohotu Woodville 116 Vogel Street POSTAL ADDRESS Horizons Regional Council, Private Bag 11025, Manawatu Mail Centre, Palmerston North 4442 F
3 Drinking Water Quality in the Horizons Region Prepared for Horizons Regional Council November 2014 PATTLE DELAMORE PARTNERS LTD 295 Blenheim Rd, Upper Riccarton, Christchurch P O Box 389, Christchurch, New Zealand Tel Fax Web Site Auckland Wellington Christchurch solutions for your environment
4 P A T T L E D E L A M O R E P A R T N E R S L T D i D R I N K I N G W A T E R Q U A L I T Y I N T H E H O R I Z O N S R E G I O N Quality Control Sheet T I T L E Drinking Water Quality in the Horizons Region C L I E N T Horizons Regional Council V E R S I O N Final I S S U E DATE November 2014 J O B R E F E R E N C E S O U R C E F I L E ( S ) C C R002 D O C U M E N T C O N T R I B U T O R S Prepared by S I G N A T U R E C h r i s W o o d h o u s e Reviewed by Approved by S I G N A T U R E N e i l T h o m a s P e t e r C a l l a n d e r Limitations: This report has been prepared on the basis of information provided by Horizons Regional Council. PDP has not independently verified the provided information and has relied upon it being accurate and sufficient for use by PDP in preparing the report. PDP accepts no responsibility for errors or omissions in, or the currency or sufficiency of, the provided information. This report has been prepared by PDP on the specific instructions of Horizons Regional Council for the limited purposes described in the report. PDP accepts no liability if the report is used for a different purpose or if it is used or relied on by any other person. Any such use or reliance will be solely at their own risk. C R002 UPDATED_FINAL.DOCX
5 P A T T L E D E L A M O R E P A R T N E R S L T D i i D R I N K I N G W A T E R Q U A L I T Y I N T H E H O R I Z O N S R E G I O N Table of Contents S E C T I O N P A G E 1.0 Introduction Groundwater Quality Analysis Methods Location of DWS breaches in Data Available for Redox Conditions Major Cations and Anions Minor Determinands Nutrients Bacteria ph Summary Groundwater Quality Trend Analysis Major Cations and Anions Minor Determinands Nutrients Bacteria ph Conclusions References 19 C R002 UPDATED_FINAL.DOCX
6 P A T T L E D E L A M O R E P A R T N E R S L T D 1 D R I N K I N G W A T E R Q U A L I T Y I N T H E H O R I Z O N S R E G I O N 1.0 Introduction Pattle Delamore Partners have been engaged by Horizons Regional Council to review groundwater chemistry data to describe the patterns of groundwater quality in the region and if breaches of Maximum Acceptable Values (MAVs) or Guideline Values (GVs) in the Drinking Water Standards for New Zealand 2005 (revised 2008) (DWSNZ). Information gleaned from these analyses will be used to provide recommendations to groundwater users in the area. Horizons Regional Council provided data from their Hilltop and Qualarc databases for the analysis. The PDP (2013) report highlighted some bores which breach national drinking water standards, this report uses more recent data to provide an updated assessment of where any breaches occur. Detailed analysis was conducted on 27 boreholes from the Hilltop database, with data records extrapolated back in time using information from the Qualarc database. At all monitoring sites, field measurements were made of groundwater temperature, electrical conductivity, ph, dissolved oxygen, and redox potential. Laboratory analysis was then generally undertaken for a selection or all of the following: Major cations (Ca, Mg, Na, K); Major anions (HCO 3, SO 4, Cl); Other chemical species that often affect water quality (Fe, Mn, As, F, B); Other indicative chemical parameters (SiO 2, Br) and; Indicators of bacterial contamination (Escherichia coli (E. coli), total coliforms). Groundwater quality data from has been assessed for breaches of New Zealand drinking water standards (NZDWS) of 14 water quality parameters according to New Zealand Ministry of Health guidelines (2008). This data has been examined spatially, and using historical data any recent trends have been highlighted. Reasons for breaches and trends are also discussed. 2.0 Groundwater Quality Analysis 2.1 Methods Firstly, the number of records and the length of the time series data for each bore were assessed. This data is presented in Table 1 together with the well depths and locations. Next, water quality parameters in the Hilltop database were chosen for analysis if NZDWS guideline values (GVs) and maximum acceptable values (MAVs) exist. A total of 14 water quality parameters were selected. Table 2 presents the list of parameters used and the NZDWS GVs and MAVs for each. Any necessary corrections to the data were then made; Nitrate and Nitrite were converted into Nitrate - N and Nitrite-N respectively. This is because data for both Nitrate-N and Nitrate existed, with the same being the case for Nitrite and DWS are often reported in terms of nitrogen content. In low ph environments, ammonia (NH 3 ) becomes ammonium (NH 4 ), and so for simplicity, all data was C R002 Updated_Final.docx
7 P A T T L E D E L A M O R E P A R T N E R S L T D 2 D R I N K I N G W A T E R Q U A L I T Y I N T H E H O R I Z O N S R E G I O N converted into ammoniacal nitrogen. To calculate hardness, the calcium and magnesium concentrations were converted into molar equivalents of calcium carbonate, and then summed. For some species in the Qualarc and Hilltop databases, different chemical analyses have been undertaken on the same parameter at different times, for example total arsenic and soluble arsenic. A brief analysis was undertaken to determine any differences in the calculated values from these methods, by plotting results from the differing analyses against one another for each borehole. No obvious trend was identified from any of the resultant plots, and all results were included in the subsequent analysis. Detection limits vary between the differing analyses, and only some are reported. The detection limits in the Hilltop database are consistent, and these have been added to the figures in Appendix B. Where samples returned results below the detection limit, half the detection limit was used in statistical analysis. For each bore and each species, the mean, median, maximum and minimum values, and total number of beaches were calculated for all data prior to 2013 and for Bores were then segregated based on their redox characteristics (oxidising or reducing) according to the findings of PDP (2013). Finally, time series of data for each redox environment and for each chemical species were plotted, and maps showing where breaches of NZDWS GVs, and MAVs occur spatially were constructed. One bore in the Hilltop database (352271), was not analysed as this is screened in the deeper basement rock and the groundwater has a high electrical conductivity making it unsuitable for potable supply, contrasting with the sand and gravel screened bores. C R002 Updated_Final.docx
8 P A T T L E D E L A M O R E P A R T N E R S L T D 3 D R I N K I N G W A T E R Q U A L I T Y I N T H E H O R I Z O N S R E G I O N Table 1: Bore details and length and quantity of groundwater quality data records for each bore. Bore Easting Northing No. No. Depth Screened Data Source Start Date End Date Sampling Samples (m) Lithology rounds Analysed Sand Qualarc/Hilltop 29/10/ /10/ Gravel Qualarc/Hilltop 28/09/ /10/ Gravel Qualarc/Hilltop 7/11/ /10/ Sand Qualarc/Hilltop 25/05/ /10/ Gravel Qualarc/Hilltop 25/03/ /10/ Gravel Qualarc/Hilltop 7/11/ /10/ Gravel Qualarc/Hilltop 8/11/ /10/ Unknown Qualarc/Hilltop 29/04/ /10/ Sand Qualarc/Hilltop 26/01/ /10/ Gravel Qualarc/Hilltop 8/11/ /10/ Gravel Qualarc/Hilltop 8/11/ /10/ Gravel Qualarc/Hilltop 31/10/ /08/ Sand Qualarc/Hilltop 29/04/ /10/ Unknown Qualarc/Hilltop 8/11/ /10/ Gravel Qualarc/Hilltop 8/11/ /10/ Gravel Qualarc/Hilltop 29/04/ /10/ Sand Qualarc/Hilltop 2/05/ /10/ Unknown Qualarc/Hilltop 20/04/ /03/ Unknown Qualarc/Hilltop 29/04/ /10/ Unknown Qualarc/Hilltop 1/05/ /10/ Sand Qualarc/Hilltop 21/06/ /03/ Unknown Qualarc/Hilltop 21/05/ /12/ Unknown Qualarc/Hilltop 23/03/ /10/ Sand Qualarc/Hilltop 20/07/ /03/ Unknown Qualarc/Hilltop 29/04/ /10/ Unknown Qualarc/Hilltop 2/08/ /03/ Sand Qualarc/Hilltop 28/10/ /03/ Unknown Qualarc/Hilltop 8/11/ /10/ C R002 Updated_Final.docx
9 P A T T L E D E L A M O R E P A R T N E R S L T D 4 D R I N K I N G W A T E R Q U A L I T Y I N T H E H O R I Z O N S R E G I O N Table 2: Water Quality Parameters analysed for and their corresponding NZDWS GVs and NZDWS MAVs. Chemical Species NZDWS Guideline Value (GV) NZDWS Maximum Acceptable Value (MAV) Justification Arsenic n/a 0.01 mg/l Health and environmental hazard. Boron 0.5 mg/l 1.4 mg/l Health and environmental hazard. Iron 0.2 mg/l n/a Aesthetics (potability and encrustation, staining). Manganese 0.04 mg/l 0.4 mg/l Aesthetics (taste, and staining), health and environmental hazard. Sodium 200 mg/l n/a Health hazard, and affects water usability for irrigation. Indicator of seawater intrusion. Hardness 200 mg/l & < 100 mg/l if ph < 7 n//a Aesthetic and water usability, can cause encrustation if > 200 mg/l, and corrosion if < 100 mg/l and ph <7. Fluoride 0.7 mg/l 1.5 mg/l Health hazard (skeletal disorders) Chloride 250 mg/l n/a Potability, corrosiveness, and indicator of seawater intrusion Sulphate 250 mg/l n/a Aesthetic and health hazard. Ammoniacal Nitrogen 1.24 mg/l n/a Environmental hazard (toxic to aquatic life) Nitrite Nitrogen n/a 0.91 mg/l (short term) 0.06 mg/l (long term) Pollution indicator, health and environment hazard Nitrate Nitrogen n/a 11.3 mg/l Pollution indicator, health and environment hazard ph < 7 & > 8.5 n/a Water usability and contamination indicator E. Coli n/a < 1 per 100 ml Health risk, and indicator of contamination. 3.0 Location of DWS breaches in Data Available for For most bores, two sampling rounds were undertaken in March and October 2013 across the Horizons region for all parameters. However, additional samples were taken for nitrate and ph at some bores and some of these were taken in 2014 as well as Conversely, some bores were sampled only annually for arsenic. Table 3 summarises the sampling dates in bores where one or C R002 Updated_Final.docx
10 P A T T L E D E L A M O R E P A R T N E R S L T D 5 D R I N K I N G W A T E R Q U A L I T Y I N T H E H O R I Z O N S R E G I O N more parameters were not sampled biannually in 2013 (March and October). No samples were taken from the 96 m deep bore in , which is located north-east of Palmerston North. Table 3: Monitoring bores not sampled biannually in showing the dates of sampling rounds. Borehole Sampling rounds Nitrate and ph Sampling rounds Arsenic Sampling rounds remaining parameters October 2013 October 2013 October 2013 Last sampled August 2012 March & October 2013 March 2013 March & October 2013 March & October 2013 March 2013 March & October 2013 March & October 2013 March 2013 March & October March 2013 March 2014 tri-monthly (5 samples) No samples taken March 2013 March 2014 tri-monthly (6 samples extra sample taken in March 2013) March & October March 2013 March 2014 No samples taken tri-monthly (5 samples) March & October 2013 March 2013 March & October June 2013 March 2014 tri-monthly (4 samples) March 2013 March 2014 tri-monthly (5 samples) No samples taken No samples taken March 2013 March 2014 Last sampled May 2008 (E. coli last sampled August 2009) tri-monthly (5 samples) March & October 2013 March 2013 March & October 2013 C R002 Updated_Final.docx
11 P A T T L E D E L A M O R E P A R T N E R S L T D 6 D R I N K I N G W A T E R Q U A L I T Y I N T H E H O R I Z O N S R E G I O N 3.2 Redox Conditions Figure A.1 shows a map of the Horizons region and the analysed wells, separating the boreholes according to their redox conditions and depth (< 20 m deep and > 20 m deep). Redox bores were defined in the PDP (2013) report based on the concentrations of several water quality parameters. Bores with high iron, manganese, arsenic and ammonia were classed as reducing, while bores with high nitrate, and low arsenic, iron and, manganese were classified as oxidising. Generally, most of the oxidising bores are shallow ( 27 m deep), while deeper bores tend to be reducing. This is because deeper groundwater is older, and dissolved oxygen in the water is consumed by redox reactions through time. Oxidising wells predominantly occur to the east and south-west, with the reducing wells mostly occurring close to the coast. A total of 13 oxidising wells and 14 reducing wells were analysed. 3.3 Major Cations and Anions Five major ions were analysed; Sodium, Magnesium and Calcium (combined as Hardness), Chloride, and Sulphate. Typically these ions are present in groundwater in the highest concentrations Sodium Figure A.2 shows a map of median sodium concentrations and redox conditions in No Sodium breaches are found to occur, and all but one analysis produced a median value < 55 mg/l. Oxidising bores all had low (<27 mg/l median value) sodium concentrations, which is expected in shallow groundwater environments. Reducing bores had similar concentrations to oxidising bores ( 55 mg/l), with the exception of bore located close to the Manawatu gorge. This well produced a median value of 178 mg/l, however this concentration is still below the NZDWS GV of 200 mg/l Hardness The NZDWS optimum range for hardness is mg/l. Soft water is characterised as being below this optimum range, whilst hard water is characterised as exceeding it. Figure A.3 shows a map of median hardness concentrations and where breaches of the NZDWS GV occurred in 2013 (i.e. where concentrations were outside the mg/l range). In general, harder potentially encrusting waters occur in deeper, reducing bores while softer potentially corrosive waters occur in shallower oxidising bores. Fourteen breaches of hardness < 100 mg/l were identified occurring in all sampled oxidising wells. The softest waters occurred in wells and , and , with the remaining wells having median hardness values of > 71 mg/l. Eight breaches of hardness > 200 mg/l were identified in 6 of the 13 sampled reducing wells. Three of these breaches were borderline, yielding median values of mg/l. The greatest median hardness was 562 mg/l in the 117 m deep bore, to the C R002 Updated_Final.docx
12 P A T T L E D E L A M O R E P A R T N E R S L T D 7 D R I N K I N G W A T E R Q U A L I T Y I N T H E H O R I Z O N S R E G I O N north west of Bulls and the other hard water bores > 201 mg/l also lie immediately to the west of this bore in the Rangitikei groundwater management zone Chloride Figure A.4 shows a map of median chloride concentrations and redox conditions in No breaches of the chloride NZDWS GV were detected. Chloride in oxidising bores is 39 mg/l throughout the region, far below the NZDWS GV of 250 mg/l/. The maximum median chloride concentrations are at bore (152 mg/l), located adjacent to the Manawatu gorge east of Palmerston North and (143 mg/l), northwest of Bulls. These wells are relatively deep, 83 m and 117 m respectively. Bore is proximal to the Pohangina anticline and basement aquifers which have high salinities. Mixing with these deeper groundwaters could cause greater chloride concentrations Sulphate Figure A.5 shows a map of median sulphate concentrations and redox conditions in No breaches of the sulphate NZDWS GV were detected. In oxidising wells, sulphate is always > 5 mg/l which is expected as sulphate reduction cannot occur in oxidising conditions. However, the maximum median sulphate concentration is < 39 mg/l, far below the NZDWS GV of 250 mg/l. In 7 of the 13 reducing wells, sulphate concentrations are < 0.05 mg/l. The greatest sulphate concentrations (105.5 mg/l) occur in and chloride concentrations are also high in this well. This is a deep (117 m deep), reducing well and could indicate that mixing with saline groundwaters is occurring at depth, or it may be an indication of the local geology. The presence of gypsum for example can give rise to high sulphate concentrations. 3.4 Minor Determinands Minor determinands are ions which are often present in groundwater but in typically much lower concentrations than major ions, except in exceptional cases. Five minor determinands were assessed, including two metals (iron and manganese), two metalloids (arsenic and boron), and one anion (fluoride) Manganese Figure A.6 shows a map of median manganese concentrations and where breaches of the NZDWS GV and MAV occurred in A total of 24 breaches of the manganese NZDWS GV (0.04 mg/l) were detected, 17 of which also exceeded the MAV (0.4 mg/l). Only one oxidising well had a manganese concentration exceeding the NZDWS GV, this well is shallow (7.2 m) and located close to the Rangitikei River. This is an exception and could be caused by a connection to the river or local geology. All of the remaining 8 sampled oxidising bores had manganese concentrations typically below the detection limit. C R002 Updated_Final.docx
13 P A T T L E D E L A M O R E P A R T N E R S L T D 8 D R I N K I N G W A T E R Q U A L I T Y I N T H E H O R I Z O N S R E G I O N As expected, manganese concentrations exceed the GV in all reducing wells, and exceed the MAV in bores close to the coast and along the Manawatu River. Over 74% of samples taken in 13 reducing wells exceeded the NZDWS MAV. This is a consequence of the reducing conditions, where the low oxygen content of the groundwater allows dissolution of metals and metalloids in the strata Iron Figure A.7 shows a map of median iron concentrations and where breaches of the NZDWS GV occurred in Fourteen of the twenty one sampled wells yielded iron concentrations exceeding the GV of 0.2 mg/l. Only oxidising well had iron concentrations exceeding the NZDWS GV. This well is m deep and adjacent to the Manawatu River, this exceedance could again be due to a connection with the river or due to the local geology. As with manganese, all reducing wells exceeded the iron GV. Concentrations are greatest along the coast and the Manawatu River Arsenic Figure A.8 shows a map of median arsenic concentrations and where breaches of the NZDWS MAV occurred in Five of the twenty one bores had at least one sample taken which exceeded the MAV. No breaches of the MAV were observed in oxidising bores, with concentrations below or just above the analytical detection limit. Nine breaches of the NZDWS MAV occurred in five reducing wells close to the coast, a total of 39% of samples from the 13 reducing wells. These breaches of the MAV for arsenic are consistent with the reducing / oxidising groups of bores, with breaches of the MAV only occurring in reducing bores, where higher concentrations of arsenic are typically found. Away from the zone where breaches are found to occur, concentrations are at least an order of magnitude lower Boron Figure A.9 shows a map of median boron concentrations and where breaches of the NZDWS GV and MAV occurred in Only one of the twenty one sampled bores breached the GV, and no exceedances of the MAV were detected. Oxidising bores had median boron concentrations 0.05 mg/l, consistent with the groundwater redox conditions found in these bores. As with oxidising wells, 85% of the 13 sampled reducing wells had median boron concentrations 0.05 mg/l, and only one well exceeded the boron GV. No exceedan ces of the MAV occurred. The only identified GV breach occurred in bore , which is located close to the Manawatu gorge, east of Palmerston North. This well is 83 m deep and has a median Boron concentration of 1.19 mg/l. No other wells surrounding this borehole have high boron concentrations and since these are all shallow (< 20 m deep) C R002 Updated_Final.docx
14 P A T T L E D E L A M O R E P A R T N E R S L T D 9 D R I N K I N G W A T E R Q U A L I T Y I N T H E H O R I Z O N S R E G I O N this implies that the high boron levels may be a result of the nature of the deep strata and reflect local conditions around that particular bore. Mixing with groundwaters from the basement aquifers of the Pohangina anticline, which have a different geochemistry could produce these high boron concentrations. The next greatest median boron concentration is 0.12 mg/l, far below the NZDWS GV of 0.5 mg/l Fluoride Figure A.10 shows a map of median fluoride concentrations in No exceedances of the GV or MAV occurred, in any of the samples collected. The highest median concentration in oxidising bores is 0.2 mg/l, far below the fluoride GV of 0.7 mg/l. The greatest median concentration in reducing bore is 0.35 mg/l, half that of the NZDWS GV. Concentration are generally higher in reducing wells closer to the coast. 3.5 Nutrients Nutrients are present in groundwater from natural sources, such as organic matter within th e aquifer, or from anthropogenic sources such as fertilizer. Concentrations of ammonia, nitrite, and nitrate are examined here Ammoniacal Nitrogen Figure A.11 shows a map of median ammoniacal nitrogen concentrations and where breaches of the NZDWS GV occurred in Ammonia occurs naturally from the breakdown of organic matter in anaerobic conditions, from animal waste or anthropogenic fertilizer application. Ammoniacal nitrogen is low (always 0.01 mg/l) in oxidising wells, this is because in oxidising conditions ammonia is oxidised to nitrite or nitrate. In total 43.5% of samples from the 13 sampled reducing wells breach the NZDWS GV. Exceedances of the GV in reducing bores occur in wells ranging in depth from m. These wells are mostly sited in the agricultural regions of the Manawatu and Rangitikei groundwater management zones Nitrite Nitrogen Figure A.12 shows a map of median nitrite N concentrations in No wells breached the long term NZDWS MAV of 0.06 mg/l. Concentrations of nitrite N in oxidising wells are always at least an order of magnitude below the NZDWS MAV. This is perhaps because nitrite oxidises to nitrate in the oxidising conditions of these wells. The highest concentrations of nitrite N in reducing wells occurred in deeper bores ( m) close to the coast. The maximum of these values though remains an order of magnitude below the MAV concentration. In general nitrite N concentrations are higher in reducing wells than oxidising wells. Possibly as a by product of nitrate reduction. C R002 Updated_Final.docx
15 P A T T L E D E L A M O R E P A R T N E R S L T D 10 D R I N K I N G W A T E R Q U A L I T Y I N T H E H O R I Z O N S R E G I O N Nitrate Nitrogen Figure A.13 shows a map of median nitrate N concentrations in , and where the NZDWS MAV was breached. Three of the twenty seven sampled bores exceeded the MAV of 11.3 mg/l Two oxidising wells ( and ) had median nitrate nitrogen concentrations exceeding the maximum acceptable nitrate nitrogen concentration, with a further well (372071) having one of five samples which breached this value. These wells are all located to the south of the region, around Levin. All concentrations > 9 mg/l were in oxidising wells < 27 m deep, suggesting that agricultural affects may be significant in causing high concentrations at these points. The maximum nitrate nitrogen concentration in the reducing wells was 0.08 mg/l, which is expected as denitrification (reductive breakdown of nitrate) occurs in anaerobic environments. 3.6 Bacteria The detection limit for E.Coli at the laboratory where samples were analysed was 4 MPN / 100 ml, which is greater than the drinking water standard (< 1 MPN / 100 ml). Therefore, the E.Coli data have been split into three groups. One group contains bores with detections of > 4 MPN / 100 ml, which represent confirmed detections of E.Coli in a sample. The second group contains bores that have detections of 4 MPN / 100 ml or less. The detection limit means that the presence or absence of E.Coli cannot be confirmed in bores in the second group. The final group contains samples with results of < 1 or 0 MPN / 100 ml, which indicates that samples from the bores did not breach drinking water standards. Figure A.14 shows a map of the maximum most probable E. coli numbers per 100 ml in 2013, and where the NZDWS MAV were exceeded (in bores where the count of E.Coli was > 4 MPN / 100 ml), and possibly exceeded (where the count was 1-4 MPN / 100 ml). Only 2 of the 21 sampled wells contained confirmed detections of E coli in either of the two sampling rounds that took place in 2013, both of which are 11 m deep. Shallow bores are vulnerable to contamination from surface sources, so detections of E.Coli in the two bores is not surprising. A further 16 bores contain possible exceedances (between 1 and 4 MPN / 100 ml, while in the remaining 3, results were reported as < 1 MPN / 100 ml, meaning NZDWS were not bre ached. 3.7 ph The acceptable range for ph is 7-8.5, with values outside of this range breaching the DWSNZ GV. Figure A.15 shows a map of median ph values and where NZDWS GV breaches occur in ph is on average < 7 in all oxidised wells. The cause of the low ph is actually likely to be related to the effect of rainfall recharge, which can become acidic as it passes through the soil zone. A total of 79% of samples taken from 20 wells < 27 m deep reported ph values < 7 across both oxidising and reducing bores. C R002 Updated_Final.docx
16 P A T T L E D E L A M O R E P A R T N E R S L T D 11 D R I N K I N G W A T E R Q U A L I T Y I N T H E H O R I Z O N S R E G I ON ph of reducing wells is always > 7 with the exception of two wells ( and ) both wells are < 27 m deep. No samples were taken where the ph exceeds Summary Figure A.16 shows a summary map of where exceedances of NZDWS have been detected in Table 5 summarises data from , and where breaches of NZDWS have occurred. The lower thresholds of ph and hardness GV was breached in all of the 13 sampled oxidising bores. The lower threshold of hardness was breached in all but one of the 8 sampled oxidisin g bores. The MAV for nitrate N was also exceeded in 3 of the 13 sampled bores. In reducing bores, the GV for iron and manganese was breached in all 13 sampled bores. All but one of the reducing wells also exceeded the manganese MAV. Five bores had hardness and ammoniacal nitrogen concentrations above the GV, and arsenic concentration exceeded the MAV in three bores. Median E. coli concentrations exceeded the MAV value in 18 of the 21 sampled bores, although as noted above, these results may not be reliable. Boron concentration exceeded the NZDWS GV in reducing bore sited adjacent to the Manawatu gorge. This is possibly due to mixing with deeper groundwater in the basement. Overall, there are no new exceedances which are exceptional when compared to previous data reported in PDP (2013). 4.0 Groundwater Quality Trend Analysis 4.1 Major Cations and Anions Figures B.1 to B.8 show time series graphs of sodium, chloride, hardness, and sulphate concentrations in both oxidising and reducing boreholes. Sodium and chloride concentrations appear to be predominantly stable across all boreholes, with some bores showing high variability between sampling rounds. The reducing bore shows a slight decreasing trend from 2007 for chloride and 2007 for sodium to 2011 but this has now levelled out. Bore (83 m deep, located close to the Manawatu Gorge, north east of Palmerston North), which is also reducing, shows a steady increasing trend in chloride concentrations since 2001, but this seems to be flattening in recent years. This is consistent with the trends noted by PDP previously. There is also a corresponding increasing trend for sodium in bore (and hardness, see below) but the trend for sodium is less pronounced and shows more variability. Chloride is a useful indicator of general water quality and therefore the trends in this parameter are useful indicators of any longer term in groundwater quality. Trends in chloride were analysed in the groundwater quality report (PDP, 2013) and of the other increasing chloride trends highlighted by PDP (2013), most appear to have stabilised in recent years, and none are of immediate concern. Table 3 summarises any changes in the identified trends from C R002 Updated_Final.docx
17 P A T T L E D E L A M O R E P A R T N E R S L T D 12 D R I N K I N G W A T E R Q U A L I T Y I N T H E H O R I Z O N S R E G I O N Table 4: Changes in Chloride concentrations in wells with trends identified in PDP (2013) Borehole PDP (2013) trend Current Trend Concern Increasing Very slight (0.67 mg/l) increase since Increasing Highly variable since 2005, first result (36.6 mg/l) of 2013 greatest since Decreasing Stabilised only minor changes since No, insignificant recent change, median 2013 concentration of 50.6 mg/l well below GV. No, variability likely related to changes in recharge or connection to surface water bodies (shallow well). Maximum recent concentration well below past maximum of 120 mg/l. No, current decreasing trend has stabilised median of 51.1 mg/l well below GV Increasing No data since Increasing Median 2013 concentration increased by 6.5 mg/l since Increasing Increased since last monitoring but within historic ranges Increasing Most recent result highest since 2009, slight increase Decreasing Slight decrease since 2012, last result is lowest since Increasing Continued very slight (< 0.2 mg/l) increase since Increasing Variable, early 2013 result (31.1 mg/l) highest recorded. Yes, most recent concentration (152.6 mg/l) is highest recorded. No, insignificant recent change, median 2013 concentration of 39.3 mg/l well below GV. No, insignificant recent change, median 2013 concentration of 22 mg/l well below GV. No, decreasing trend. No, concentrations increasing at minor rate, median 2013 concentration of 32.6 mg/l well below GV. No, most recent result significantly lower (21.9 mg/l) than early 2013 result. Over the past 5 years, hardness concentrations have also remained predominantly stable when the variability between sampling rounds is averaged out. The main exception is the reducing bore , which has shown a clear increase in hardness concentrations from , but has C R002 Updated_Final.docx
18 P A T T L E D E L A M O R E P A R T N E R S L T D 13 D R I N K I N G W A T E R Q U A L I T Y I N T H E H O R I Z O N S R E G I O N since remained relatively stable. The pattern of increasing concentration of hardness, chloride and sodium in bore , together with unusually high concentrations of Boron (above the GV, but below the MAV)) may be caused by local conditions around the bore. These trends could be caused by long term trends in recharge and ion exchange. Whilst the concentrations are not yet high enough to be of serious concern, the long term increasing trend in this bore is worth highlighting and keeping under review. With regards to sulphate, there are only three years of available data for sulphate concentrations (from 2011 to 2013), and concentrations have not varied significantly over that time period. 4.2 Minor Determinands Figures B.9 to B.18 show time series graphs of manganese, iron, arsenic, boron, and fluoride concentrations in both oxidising and reducing boreholes. For manganese, all of the oxidising bores have shown a declining trend since with the exception of , which is highly variable between sampling rounds, yielding the highest recorded concentration in early Many of the manganese concentrations in oxidising bores now fall below the detection limit, with the decreasing trend causing an overall decrease of over an order of magnitude. Prior to the change the sampled wells were yielding similar results. The reason for this decrease across oxidising bores may be caused by increasing analysis accuracy or changes in sampling techniques to include filtering samples. In reducing bores, all manganese concentrations have been predominantly stable over the last 4 years. Iron concentrations in oxidising bores are highly variable between sampling rounds, and there is no consistent identifiable trend for any of the bores. In reducing bores, iron concentrations have been relatively stable since 2012, with some minor increases and decreases. Results for almost all boreholes showed a large decrease in 2011, this could be due to a systematic sampling or laboratory error. Since 2011, the concentration of iron in reducing bores shows a consistent and spatially widespread increasing pattern, although the absolute value of concentrations is within the range of historical variability. However, the pattern is noteworthy, since it may reflect region wide drivers for changes in hydrochemistry. Concentrations of arsenic and boron in oxidising bores are mostly stable, with many reported results below the detection limit. Reducing bores also show mostly stable arsenic and boron concentrations, although results from have been highly variable. The maximum concentration ever recorded in this bore was taken in late This variability could reflect the shallow depth (< 9 m) of the bore meaning it is influenced by the diluting effects of surface water recharge to a greater extent. Boron concentrations in reducing well have been steadily increasing since sampling began in 2002 (although the most recent three samples are all stable) and the concentration of Boron is over the NZDWS GV, but currently concentrations are still below the MAV. The reason for this increase is unclear, and since there is little data prior to 2010 confidence in the trend prior to this date is low. However, given the trends in chloride, hardness and sodium in bore continued review of the hydrochemistry observed in this bore is recommended. C R002 Updated_Final.docx
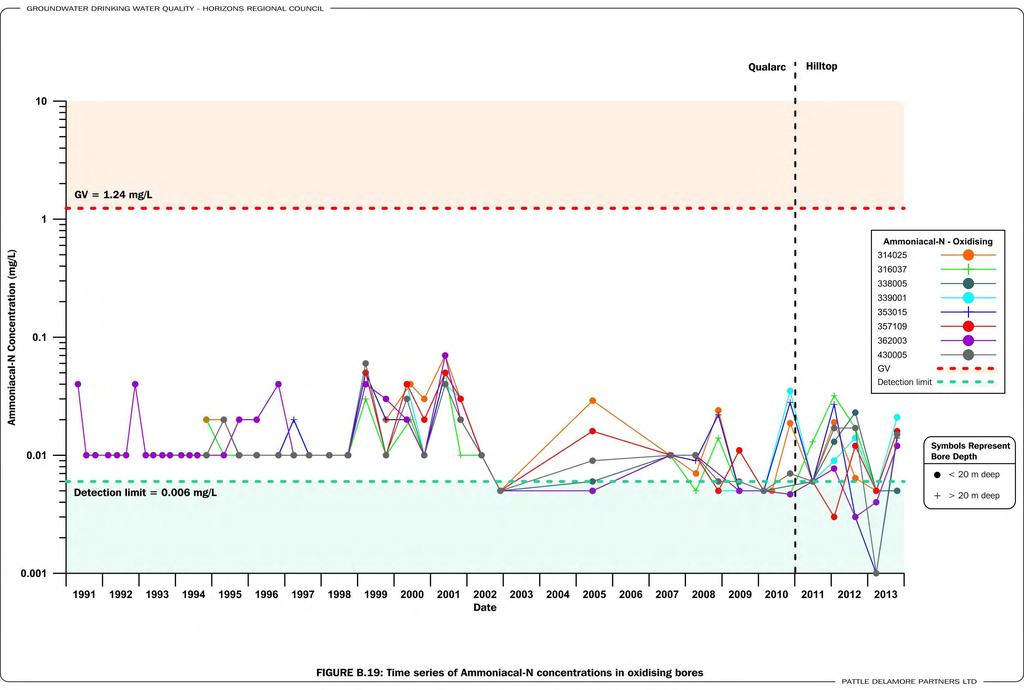
19 P A T T L E D E L A M O R E P A R T N E R S L T D 14 D R I N K I N G W A T E R Q U A L I T Y I N T H E H O R I Z O N S R E G I O N All wells show no consistent increases or decreases in fluoride concentrations, rather steady inconsistent fluctuations between sampling rounds. 4.3 Nutrients Figures B.19 to B.24 show time series graphs of ammoniacal N, nitrite N, and nitrate N concentrations in both oxidising and reducing boreholes. Ammoniacal N concentrations in oxidising bores show a high variability between sampling rounds, which is likely due to the proximity of the concentrations to the detection limit. In most reducing wells concentrations have been declining since 2011, but concentrations remain within the historical range for each bore. This widespread declining trend is similar but opposite to that observed with iron and may perhaps reinforce the possibility of some region wide driver for temporal hydrochemical patterns in the reducing bores. Nitrite N concentrations in both oxidising and reducing bores are highly variable, mostly around or close to the detection limit, with no consistent trends. A series of nitrite N spikes are present when the long term NZDWS MAV is exceeded, particularly in reducing bores. It is often the case that spikes from a number of bores coincide, such as in 2011 for reducing wells. Spikes from 2011 correlate well with spikes in ammonical N concentrations. This might suggest that contamination during sampling might be occurring. Nitrate N concentrations in reducing bores behave in a similar manner to nitrite N concentrations, being predominantly low but variable with a series of spikes. In oxidising bores, nitrate concentrations in most wells appear stable although a variable but increasing trend appears to be present in the time series of bore , with the highest value yet being recorded in the most recent sampling round in late Bore does exhibit a decreasing trend beginning in 2005, and this well has been consistently below the NZDWS MAV since A comparison of current trends with the trends highlighted in PDP (2013) is given in Table 4. Most recent (i.e. 2013) concentrations are stable or slightly decreasing, but these decreases are not significant, and a reversal to an increasing trend could occur. C R002 Updated_Final.docx
20 P A T T L E D E L A M O R E P A R T N E R S L T D 15 D R I N K I N G W A T E R Q U A L I T Y I N T H E H O R I Z O N S R E G I O N Table 5: Changes in Nitrate N concentrations in wells with trends identified in PDP (2013) Borehole PDP (2013) trend Current Trend Concern Stable Most recent data suggests an increasing, but variable, trend Increasing Current decreasing trend since 2012, most recent result (0.15 mg/l) lowest recorded Decreasing Continuing slight decreasing trend, current result is lowest since Increasing Stabilised only minor changes since 2012, median has decreased by 0.17 mg/l Increasing Very slight decreasing trend since 2012, median has decreased by 0.17 mg/l Increasing Decreasing trend since 2005, most recent result (6.6 mg/l) second lowest recorded. Potentially. Maximum concentrations are beginning to approach the MAV. No, trend is decreasing and concentrations well below MAV. Yes, concentrations still consistently greater than MAV. Yes, concentrations have exceeded MAV in the past Yes, concentrations still consistently greater than MAV. Decreasing trend is not significant. Decreasing trend appears consistent in most recent data, but concentrations in this bore should be kept under review due to past exceedances of the MAV Increasing Mostly stable since No, concentrations have never exceeded MAV and appear stable. Current median of 2.94 mg/l well below MAV Increasing Mostly stable since 2009, slight increasing trend in last 3 results Increasing Variable, results within historic ranges. Yes, has breached the MAV in early No, concentrations are variable but have never breached MAV. 4.4 Bacteria Figures B.25 and B.26 show time series graphs of E. coli in oxidising and reducing bores respectively. There is no distinct trend in E. coli concentrations, although since 2008 more wells are reporting values of < 4 per 100 ml and since 2010 the number of results of < 1 per 100 ml C R002 Updated_Final.docx
21 P A T T L E D E L A M O R E P A R T N E R S L T D 16 D R I N K I N G W A T E R Q U A L I T Y I N T H E H O R I Z O N S R E G I O N has increased, which may reflect an improvement in well head security, sampling procedures, or laboratory analysis. However, some of these results may still represent an NZDWS exceedance of the < 1 MPN / 100 ml criterion. In 2013, only two shallow (11 m deep) bores unequivocally breached NZDWS criteria, as mentioned above this is not unexpected for these shallow bores. Exceedances of NZDWS in a number of bores remains uncertain due to the high detection limit. 4.5 ph Figures B.27 and B.28 show time series graphs of ph in oxidising and reducing bores respectively. No consistent ph trend is observed, except in bore , which shows a consistent increasing trend since However, there is much variability, some of which could be due to seasonal recharge changes. Some of the extreme ph spikes often coincide and could be related to inadequate ph meter calibration. The most extreme spike dates to the April 2008 sampling round, when readings reached improbable ph values of These results have been omitted from the time series plot. 5.0 Conclusions A review of 14 water quality parameters across 27 regularly sampled boreholes in the Horizons region has been completed. The majority of bores were sampled on two occasions in 2013 although some additional samples were taken from certain bores and, conversely, some bores were only sampled once for some parameters. A summary of the results derived from the analysis of water quality data in the Horizons region is given below: NZDWS guideline values for ph (< 7) and the lower guideline value for hardness (< 100 mg/l) were breached in all sampled oxidising bores, and 1 bore (13%) exceeded the guideline value for iron concentration; NZDWS maximum acceptable values were breached for nitrate in 23 % of oxidising bores respectively; NZDWS guideline values for iron, ammoniacal N, hardness, manganese, and boron were breached in 100 %, 38 %, 38 %, 15 %, and 8 % of 13 sampled reducing bores respectively; NZDWS maximum acceptable values were breached for manganese and arsenic in 77 % and 23 % of 13 sampled reducing bores respectively; With the exception of borehole , only slight increasing and decreasing trends in water quality exist, and water quality parameters appear to be predominantly stable. There are multiple trends in this bore which may be related to long term trend in rechar ge or mixing with deeper basement groundwater; Generally, where the oxygen content of the groundwater is low (i.e. reducing conditions), dissolution of metals (e.g manganese and iron) and metalloids (e.g. arsenic) in the strata occurs and concentrations of these elements are greater; Generally there have been no significant changes since in GV and MAV exceedances since C R002 Updated_Final.docx
22 P A T T L E D E L A M O R E P A R T N E R S L T D 17 D R I N K I N G W A T E R Q U A L I T Y I N T H E H O R I Z O N S R E G I O N C R002 Updated_Final.docx
23 P A T T L E D E L A M O R E P A R T N E R S L T D 18 D R I N K I N G W A T E R Q U A L I T Y I N T H E H O R I Z O N S R E G I O N Table 6: Summary of groundwater quality indicators grouped according to redox conditions for the period Borehole Depth (m) Max E. Coli (n/100 ml) 1 Median Nitrate- N (mg/l) Max Nitrate- N (mg/l)) Median Nitrite- N (mg/l) Median Arsenic (mg/l) Median Boron (mg/l) Median Manganese (mg/l) Median Iron (mg/l) Median Ammonial N (mg/l) Median Hardness (mg/l) Median ph Median Chloride (mg/l) Median Fluoride (mg/l) Median Sulphate (mg/l) Median Sodium (mg/l) GV Exceeded Oxidising Conditions Hardness, ph E Coli ph, Mn E Coli ph NO Hardness, ph, Fe E Coli Hardness, ph E Coli Hardness, ph E Coli ph Hardness, ph E Coli ph ph NO Hardness, ph E Coli ph NO Hardness, ph E Coli Reducing Conditions Fe E Col, Mn NH3, Fe E Coli, As, Mn Fe, Mn E Coli Hardness, NH3, Fe E Coli, As, Mn ph, NH3, Fe E Col, Mn Hardness, Fe Mn ph, Fe Mn Hardness, Fe Mn NH3, Fe, Mn E Coli, As Hardness, Fe E Coli, Mn NH3, Fe, B E Coli, Mn Fe E Coli, Mn Hardness, Fe, Mn E Coli Notes: 1. The lab detection limit for E.Coli is < 4 MPN/100ml. Therefore, results of 4 MPN/100 ml may not represent actual detections of E.Coli. MAV Exceeded C R002 Updated_Final.docx
24 P A T T L E D E L A M O R E P A R T N E R S L T D D R I N K I N G W A T E R Q U A L I T Y I N T H E H O R I Z O N S R E G I O N 6.0 References New Zealand Ministry of Health (2008). Drinking-water Standards for New Zealand 2005 (Revised 2008). October, Pattle Delamore Partners Ltd. (2013). Report on Horizons Groundwater Quality Monitoring Network. Report prepared for Horizons Regional Council. May, C R002 Updated_Final.docx
25 P A T T L E D E L A M O R E P A R T N E R S L T D 20 D R I N K I N G W A T E R Q U A L I T Y I N T H E H O R I Z O N S R E G I O N BoreNumber Depth Oxidising conditions Max E. coli (n/100 ml) Median nitrate nitrogen (mg/l) Max nitrate nitrogen (mg/l) Median arsenic (mg/l) Median Manganese (mg/l) Median iron (mg/l) Median total ammonial nitrogen (mg/l) Median total hardness (mg/l CaCO 3 ) Median conductivity (ms/m) Median ph Median phosphate (mg/l) Copy of summary water quality data from PDP (2013) for comparison with updated data. Median chloride (mg/l) Median sulphate (mg/l) Median total alkalinity (mg/l HCO3) Median sodium (mg/l) Reducing - oxidising conditions MAV exceeded GV exceeded Piper Diagram Grouping O NO3 ph O O NO3 ph O ph O ph O ph O NO3 ph O ph O ph O NO3 ph O E. coli ph O NO3 ph D O NO3 ph 1 Reducing conditions R Mn Fe, Hard R E. coli, As, Mn Fe, NH3 2 R R E. coli Mn R Mn Fe, NH3, Hard R As, Mn Fe, NH3, ph A R E. coli, Mn Fe R Mn Fe, Hard R As Mn, Fe, NH3, Hard other F R Mn Fe R E. coli? Mn. Fe, NH3 other R E. coli?, Mn Fe R As, Mn Fe, NH3, Hard other T R Mn R E. coli? Mn, Hard other C R002 Updated_Final.docx

26
27
28
29
30
31

32
33
34
35
36
37
38
39 GROUNDWATER DRINKING WATER QUALITY - HORIZONS REGIONAL COUNCIL N ng e Whanganui Ru ah ine Ra Whanganui River Whangaehu River Groundwater management zone Major river 0 Northing (m NZMG) Legend Major population centre Oxidising groundwater environment South Taranaki Bight 4 Reducing groundwater environment Bulls 4 4 Dannevirke Feilding Reducing < 20 m deep Rangitikei River 4 Reducing > 20 m deep Palmerston North Oxidising < 20 m deep Manawatu River Borehole Key Oxidising > 20 m deep Exceedences Key 4 No Exceedences Levin Ta m m Below Detection Limit, possible exceedance a ru ra Maximum Acceptable Value Exceeded e ng Ra *Label is maximum 2013 E. coli concentration in most probable number per 100 ml NZDWS MAV = 1 MPN per 100 ml Easting (m NZMG) 0m Figure A.14: Plot of E. coli concentrations and locations of MAV exceedances for all bores sampled in PATTLE DELAMORE PARTNERS LTD
40
41

42

43

44

45

46

47
48
49

50

51

52

53

54

55 v

56
57

58

59
60

61

62

63

64

65

66

67

68

69