Layers of the Atmosphere. Troposphere Stratosphere Mesosphere Thermosphere
|
|
|
- James Norman
- 5 years ago
- Views:
Transcription

1 Air Pollution


2 Layers of the Atmosphere Troposphere Stratosphere Mesosphere Thermosphere

3 Troposphere Composition Sea level 17km Composition 78% Nitrogen 20% Oxygen Other 2%... Water vapor Argon gas Carbon dioxide Other stuff

4 Troposphere Weather occurs Increase in altitude: Decrease in pressure Decrease in gas density
")
5 17-48 km Similar composition to troposphere Less water Ozone (O 3 ) Stratosphere


6 Functions: Filters UV radiation Allows life to exist Types Ozone Tropospheric BAD! Stratospheric GOOD!

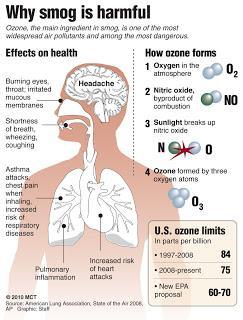
7 Tropospheric Ozone Atmospheric pollutant Not directly emitted Reaction of sunlight with hydrocarbons and nitrogen oxides Effects: lung irritant, damage to plants, & greenhouse gas

8 Stratospheric Ozone Earth s sunscreen Shields from UVB rays Thinning at poles Spring Thinning due to: CFCs released Effects of thinning: DNA damage Skin cancer

9 Air Pollution Contaminant added in high enough concentrations to the air to harm human health or alter climate

10 Types of Pollutants 1. Primary released directly into the air Examples: Carbon monoxides, Particulate matter 2. Secondary Formed as a result of chemical rxns in air Examples: smog, acid rain, ozone(tropo)
11 EPA Indicators of Air Quality Nitrogen Dioxide Ozone (ground level) Carbon Monoxide Lead Particulate Matter Sulfur Dioxide ***VOCs (Volatile Organic Compounds)

12 Nitrogen Dioxide Standard: 0.053ppm Sources: Fuel combustion Vehicles, industry, power plants Forest fires Effects: Heart & Lung problems Acid rain Suppress plant growth Haze or smog


13 Ozone Standard: 0.10 ppm Sources: Secondary pollutant Formed from photochemical rxn in NOx and VOCs Effects: Respiratory problems

14 Carbon Monoxide Standard: 9 ppm Sources: Incomplete combustion of fossil fuels Most from car exhaust Effects: Reduces amount of oxygen reaching tissues & organs Aggravates heart disease Mental & visual sharpness

15 Standard: 1.5 ug/m 3 Sources: Smelters Incinerators Battery manufacturing Effects: Lead Damages nervous system IQ loss Cardiovascular effects Leaded gas was phased out from Blood conc. In US dropped 78% from

16 Standard: 0.3 ppm Sources: Burning coal/oil Smelting Paper manufacturing Effects: Acid rain Respiratory issues Sulfur Dioxide

17 Particulate Matter Standard: 50 ug/m 3 Sources: Burning coal Volcanoes Factories Pollen Development Effects: Lung damage Carcinogens

18 Volatile Organic Compounds Sources: Vehicles Aerosols Evaporation of solvents Dry cleaning Effects: Eye & respiratory irritants Liver & kidney damage Global warming

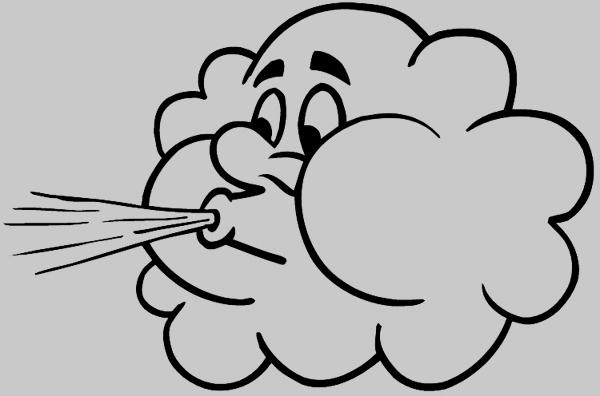
19 Smog A mixture between smog & fog that produces unhealthy urban air Two types 1. Industrial 2. Photochemical
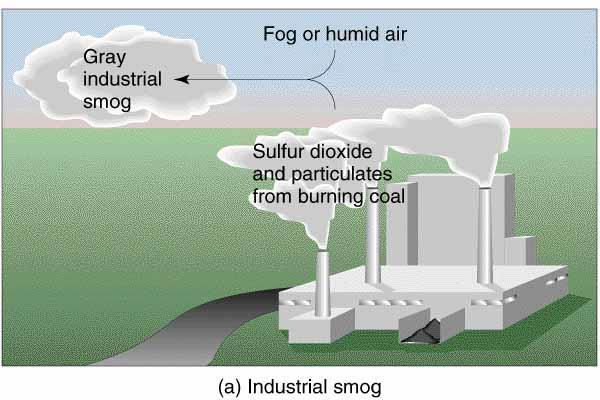
20 Industrial Smog
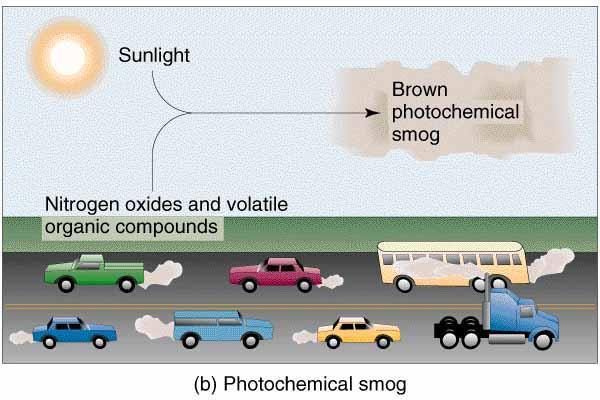
21 Photochemcial Smog
22
23

24 Thermal Inversion A thin layer of atmosphere where the normal decrease in temperature with height switches to an increase in temperature instead trapping air

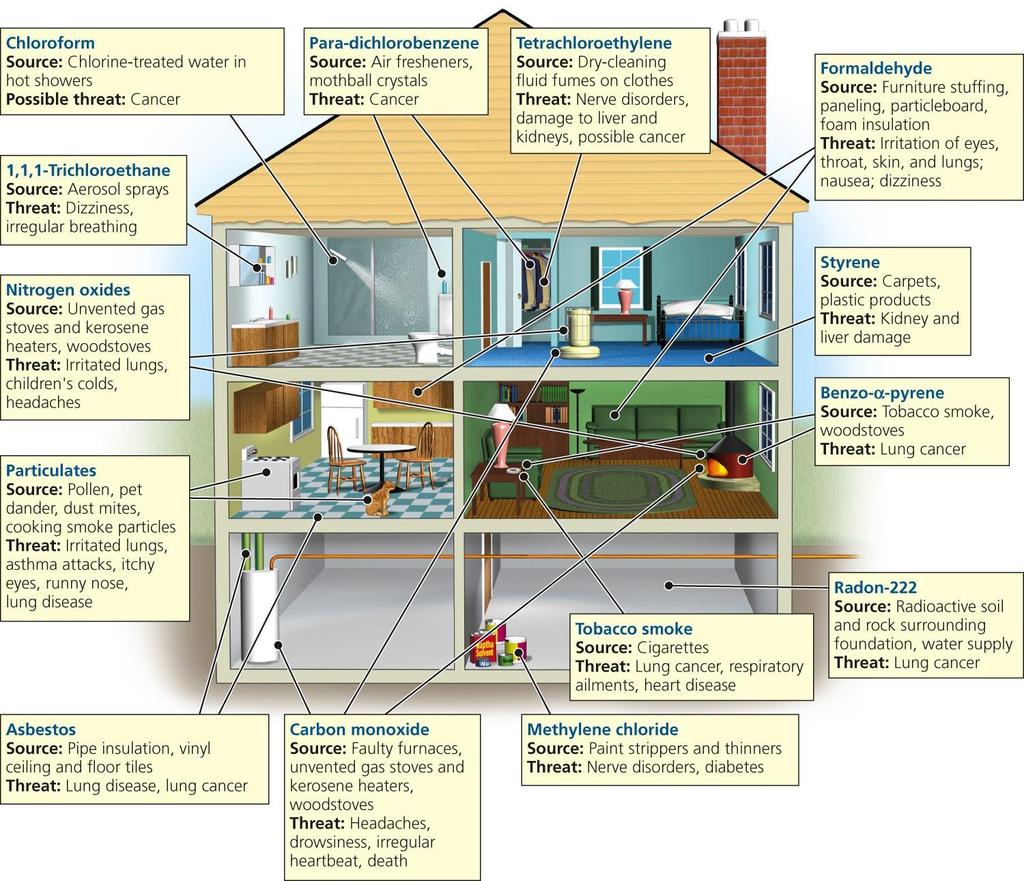
25 Indoor Air Pollutants Less Developed Countries Wood burning stoves Charcoal use Dung & crop residues Unvented/poorly ventilated buildings
26 EPA findings: Indoor Air Pollution Developed Countries 1. Common air pollutants 2-5x higher in buildings & homes than outdoors 2. Pollution levels in high traffic urban areas can be 18x higher inside the car than outside 3. Health risk in urban areas are magnified bc people spend 70-98% of their time indoors
27 More EPA findings Air pollution is listed at the top for cancer risk People most at risk: Smokers Children under 5 Elderly Sick Factory workers

28 Four Most Dangerous Indoor Air Pollutants Tobacco smoke Formaldehyde Building materials Radon gas Underground deposits Small particles emissions


29 Additional Sources Pesticide residue Living organisms & their excrement Dust mites, insect droppings Airbourne spores Mold & fungus
30 a


31 Sick Building Syndrome air pollutants found in buildings to a number of health effects *One in five commercial buildings in the US

32 Acid Deposition AKA: Acid Rain Formation of acidic particles or precipitation due to the interaction between air pollutants such as nitrous oxides & sulfur dioxide with water vapor to produce acids
 Volcanic")

33 Acid Deposition Sources Natural Lightning strikes (NOx) Volcanic eruptions (SO2) Anthropogenic Industry Motor vehicles Electric plants


34 Acid Deposition Effects Human Health Respiratory problems Toxins in fish Aquatic Ecosystems Lower ph fish kills Flora Leach soil nutrients Lower crop yields Damages plants Damage to buildings etc.

35 State of Air Pollution Poor are more susceptible 2.4 million deaths/yr worldwide 150,000 in US
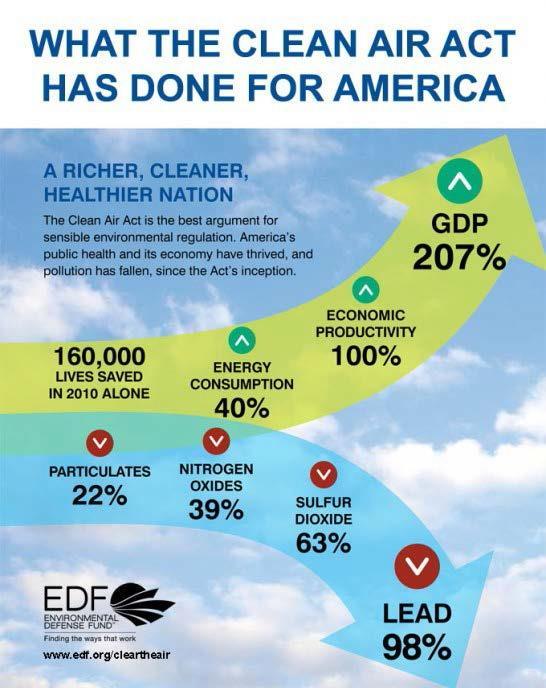
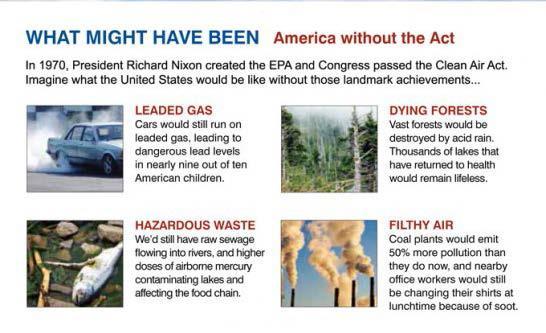
36 Dealing with Air Pollution Legal Clean air act Economic Technological
37 Clean Air Act Initial in 1970 with additions in 1977 & 1990 EPA was charged with: Developing air quality standards for 6 major air pollutants Establishing national standards for hazardous air pollutants (HAPs)
38 6 Major Air Pollutant Standards Primary standard protect human health Secondary standard prevent environmental damage Each standard = Max level allowed Specific period of time *From % (CO2 has inc. 16%) in 6 major pollutants
 Over 21,000 industries, power plants, etc.")
39 HAPs Standards for 188 Publish report Toxic Release Inventory (TRI) Over 21,000 industries, power plants, etc. report Added in 1990
40

41 Next steps Emphasis on prevention Older plants, refineries, etc. required to meet standards Improve fuel efficiency for vehicles
42 Next steps Strict regulations on motorcycles & lawn mowers Stricter guidelines for airports & ships Reduce indoor pollutants Increase & modernize monitoring equipment

43 Emissions Trading Market-based approach to controlling air pollution by providing economic incentives for reducing pollutant emissions Positive: reduction in SO2 emissions by 53% Negative: create toxic hot spots