City of Pittsburg 2015 Urban Water Management Plan Final Draft
|
|
|
- Edgar Joseph
- 5 years ago
- Views:
Transcription


1 Final Draft June 2016
2 Final Draft City Council Ben Johnson, Mayor Will Casey, Vice Mayor Pete Longmire Sal Evola Merl Craft City Manager Joe Sbranti Prepared by: RMC Water and Environment Walter C. Pease, Director of Water Utilities June 2016
3 Table of Contents Introduction and Overview... 1 Overview... 1 UWMP Organization... 2 Plan Preparation... 3 Basis for Preparing a Plan Urban Water Management Planning Act... 3 Regional Planning... 4 Individual Planning and Compliance... 4 Fiscal Year Reporting and Units of Measure... 4 Coordination and Outreach Wholesale and Retail Coordination Coordination with Other Agencies and Community City and County Notification... 7 System Description... 8 Service Area Description... 8 Service Area Boundary... 9 Climate Climate Change Climate Change Mitigation and Adaptation Strategies Service Area Population and Demographics Other Demographic Factors System Water Use Water Use by Sector Distribution System Water Losses Additional Water Uses and Losses Water Savings from Codes, Standards, Ordinances, or Transportation and Land Use Plans 17 Estimated Demands for Lower Income Households Climate Change Impacts to Demand System Energy Intensity SBX7-7 Baselines and Targets Updated Calculations from 2010 UWMP Summary of Revisions Regional Alliance Compliance Daily per Capita Water Use (GPCD) System Supplies Purchased Water Groundwater Groundwater Basin Groundwater Management Overdraft Conditions Historical Pumping Surface Water Stormwater Wastewater and Recycled Water Wastewater Collection and Treatment Recycled Water System Recycled Water Beneficial Uses June 2016 i
4 6.5.4 Actions to Encourage and Optimize Recycled Water Use Desalinated Water Opportunities Exchanges or Transfers Future Water Projects Future Water Supply Projects Supplemental Sources Summary of Existing and Planned Sources of Water Climate Change Impacts to Supply Water Supply Reliability Assessment Constraints on Water Sources Surface Water Groundwater Recycled Water Reliability Factors Reliability by Type of Year Supply and Demand Assessment Regional Supply Reliability Water Shortage Contingency Planning Stages of Action Prohibition on End Uses Penalties, Charges, Other Enforcement of Prohibitions Consumption Reduction Methods Determining Water Shortage Reductions Revenue and Expenditure Impacts Resolution or Ordinance Catastrophic Supply Interruption Plan Minimum Supply Next Three Years Demand Management Measures Overview Water Waste Prevention Ordinances Metering Conservation Pricing Public education and outreach Programs to assess and manage distribution system real loss Water conservation program coordination and staffing support Other Demand Management Measures Plan Adoption Submittal and Implementation Inclusion of All 2015 Data Notice of Public Hearing Public Hearing and Adoption Plan Submittal Public Availability References June 2016 ii
5 List of Tables Table 2-1: Public Water System... 4 Table 2-2: Plan Identification... 4 Table 2-3: Agency Identification... 4 Table 2-4: Water Supplier Information Exchange... 5 Table 3-1a: Monthly Average Climate Data Summary Table 3-1: Population Current and Projected Table 4-1: 2015 Demands for Potable and Raw Water Actual (AFY) Table 4-2: Demand for Potable Water Projected (AFY) Table 4-3: Total Water Demands (AFY) Table 4-4: 12 Month Water Loss Audit Reporting (AFY) Table 4-5: Inclusion in Water Use Projections Table 5-1: Baselines and Targets Summary Table 5-2: 2015 Compliance Table 6-1: Groundwater volume pumped (AFY) Table 6-2: Wastewater generated within Delta Diablo Service Area in 2015 (AFY) Table 6-3: Wastewater Treatment and Discharge within Service Area in 2015 (AFY) Table 6-4: Current and Projected Recycled Water Direct Beneficial Uses (AFY) within Service Area a Table 6-5: 2010 UWMP Use Projection Compared to 2015 Actual a Table 6-6: Methods to Expand Future Recycled Water Use Table 6-7: Future Water Supply Projects Table 6-8: Water Supplies Actual (AFY) Table 6-9: Water Supplies Projected (AFY) Table 7-1a: Factors Resulting in Inconsistencies in Supply Table 7-1: Bases of Water Year Data Table 7-2: Normal Year Supply and Demand Comparison (AFY) Table 7-3: Single Dry Year Supply and Demand Comparison (AFY) Table 7-4: Multiple Dry Years Supply and Demand Comparison (AFY) Table 8-1: Stages of Water Shortage Contingency Planning Table 8-2: Restrictions and Prohibitions on End Users Table 8-3: Stages of WSCP - Consumption Reduction Methods Table 8-4: Minimum Supply Next Three Years Table 10-1: County Notification List of Figures Figure 2-1: ECCC IRWM Regional Boundary... 6 Figure 3-1: City of Pittsburg Service Area... 9 Figure 6-1: Recycled Water System June 2016 iii
6 Acronyms and Abbreviations AF Acre-foot or acre-feet AFY Acre-foot per year BMP Best Management Practice CCF 100 cubic feet of water CCWD Contra Costa Water District CII Commercial, Industrial and Institutional CUWCC California Urban Water Conservation Council CVP Central Valley Project CWC California Water Code DMMs Demand Management Measures DWR Department of Water Resources EBMUD East Bay Municipal Utility District ECCC East Contra Costa County ECCID East Contra Costa Irrigation District EGIA Electric Gas Industries Association ECWMA East County Water Management Association ETo Evapotranspiration FY Fiscal Year FWSS Future Water Supply Study GPCD gallons per capita per day gpm Gallons Per Minute GWMP Groundwater Management Plan HET High Efficiency Toilet IRWMP Integrated Regional Water Management Plan MGD million gallons per day MOU Memorandum of Understanding MSL Mean Seal Level RWF Recycled Water Facility SBX7-7 Water Conservation Bill of 2009 SWP State Water Project SWRCB State Water Resources Control Board TDS Total Dissolved Solids ULF Ultra-low Flow ULFTs Ultra Low Flow Toilets USBR U.S. Bureau of Reclamation UWMP Urban Water Management Plan UWMP Act Urban Water Management Plan Act WEP Water Education Program WWTP Wastewater Treatment Plant June 2016 iv
7 Appendices Appendix A - Appendix B - Appendix C - Appendix D - Appendix E - Appendix F - Appendix G - Appendix H - Appendix I - Appendix J - Appendix K - Public Outreach Notification Letters and Notice of Intention to Adopt Pittsburg Water Supply Memorandum SBX7-7 Tables City s Water Conservation Resolutions CCWD Supply Reliability Analysis Resolution of Adoption of UWMP Pittsburg Plain GWMP Supporting Documentation for Submittal of UWMP and WSCP System Energy Intensity Analysis UWMP Checklist June 2016 v
8 Introduction and Overview This 2015 Urban Water Management Plan (UWMP) for the City of Pittsburg (City) was prepared in compliance with the Urban Water Management Planning Act of 1983 (UWMP Act) and the Water Conservation Bill of 2009 (SBX7-7). It includes all information necessary to meet the requirements of California Water Code (CWC), Division 6, Part 2.6. The information in this UWMP is based on data from the City s 2014/2015 fiscal year (FY) (July 1, 2014 to June 30, 2015). In addition to the UWMP, the City has actively participated for many years in integrated water resources planning and integrated regional water management (IRWM) planning for the East Contra Costa County (ECCC) IRWM Region This chapter acts as an executive summary for this UWMP and provides a brief overview of what is to follow. Overview The City of Pittsburg is a retailer water purveyor that obtains the majority of its potable water supply under a wholesale contract with Contra Costa Water District (CCWD). This water is diverted as raw water from CCWD s Contra Costa Canal. The remainder of the potable water supply is obtained from the City s two groundwater wells. In 2015, 87% of the City s potable supply was provided by CCWD and 13% was from local groundwater wells. Raw water from the canal and the groundwater wells is treated at the Pittsburg Water Treatment Plant before distribution throughout the City s service area. The service area is bounded by the City limits. Service area population has shown steady growth over the last 20 years, but its future growth rate will be limited by available open and developable land. The City s 2015 population was estimated at 67,628 (DOF, 2015) and is projected to grow to 91,600 by 2040 (Pittsburg, City of Pittsburg Housing Element, 2015). The City s wastewater is collected and treated by Delta Diablo, with a portion of the treated effluent comes back to the City as non-potable recycled water, predominantly for irrigation and industrial water customers. The City s potable water use for 2015 was 8,772 acre-feet per year (AFY), more than 7% lower than the projected water use from the 2010 UWMP. It is anticipated that the City s initiatives in decreasing water use to meet urban water use targets, as well as the State-mandated drought restrictions, have been the biggest factors leading to this lower than previously anticipated water use. In this plan, the City has updated its 2015 and 2020 urban water use targets in compliance with SBX7-7 to reflect the City s decision to move from calendar year reporting in 2010 to fiscal year reporting in 2015 and to base updated targets on census population data for 2010 as required by the California Department of Water Resources (DWR) 2015 UWMP Guidebook for Urban Water Suppliers (UWMP Guidebook). The City s updated 2015 urban water use target is 147 gallons per capita per day (GPCD), and the 2020 target is 131 GPCD. Actual daily per capita water use in Pittsburg for 2015 was 116 GPCD, so the City is currently meeting its 2015 target and on track to meeting its 2020 target. For the purposes of water use projections from 2020 to 2040 as documented in this UWMP, it is assumed that the City s water use under average conditions is 127 GPCD, the pre-drought average demand; still below the City s 2020 target use. This results in conservative demand projections, since 2015 demands are lower than average due to the ongoing drought and the state-mandated water use restrictions. Per communications with CCWD, the City anticipates that that the District could meet 100% of City s demands during normal years with its raw water supply, and 85% of the City s demands during drought conditions. Recycled water is considered to be drought-proof and the City s groundwater wells, installed in 1994, historically have not seen production impacted by drought conditions. Thus, it is assumed groundwater and recycled water supplies would be available 100% of the time during dry years and critically dry years. Should drought conditions occur in the future, the City has a four-stage water contingency plan in place. During Stages I and II, rationing is voluntary, while during Stages III and IV, rationing is mandatory. During June
9 Stages I, II, III, and IV, customer water use reduction goals are, respectively, up to 10%, 11-20%, 21-35%, and 36-50%. In addition, the City collaborates with CCWD on Demand Management Measures (DMMs) by providing various water conservation programs to its customers. Existing DMMs include a Water Waste Prohibition program, a metering program that ensures all existing and new connections are metered, conservation pricing, public education and outreach, a water loss auditing program, residential plumbing retrofits and a water-efficient landscaping program. The City s conservation program is likely to become even more important in future years as climate change impacts are realized. With the potential for more frequent and longer droughts and more severe storm events, effective water resource planning is crucial in in providing a reliable water supply. This UWMP addresses climate change impacts to the City s water supply, water demand, and water quality. This Urban Water Management Plan was adopted by the Pittsburg City Council at a public hearing on June 6, 2016 and is scheduled to be submitted to DWR on June 17, UWMP Organization This document, which presents the City s 2015 UWMP, is organized based on guidance provided by DWR in its UWMP Guidebook and includes references to specific water code section citations, as appropriate. This UWMP has been organized to reflect the same chronological order as the chapters in the UWMP Guidebook and contains the following chapters: Chapter 2 Plan Preparation Chapter 3 System Description Chapter 4 - System Water Use Chapter 5 Baselines and Targets Chapter 6 - System Supplies Chapter 7 Water Supply Reliability Chapter 8 Water Shortage Contingency Planning Chapter 9 Demand Management Measures Chapter 10 Plan Adoption, Submittal, and Implementation Also included in this document are 11 appendices, containing: Public Outreach Examples Notification Letters and Notice of Intention to Adopt Pittsburg Water Supply Memorandum SBX7-7 Tables City s Water Conservation Resolutions CCWD Supply Reliability Analysis Resolution of Adoption of UWMP Executive Summary of Pittsburg Plain GWMP Supporting Documentation for Submittal of UWMP and WSCP System Energy Intensity Analysis UWMP Checklist June
10 Plan Preparation This 2015 Urban Water Management Plan (UWMP) was prepared in compliance with the Urban Water Management Planning Act (UWMP Act) of 1983 and the Water Conservation Bill of It includes all information necessary to meet the requirements of the California Water Code (CWC), Division 6, Part 2.6. Basis for Preparing a Plan Urban Water Management Planning Act CWC Section defines an urban water supplier as a supplier, either publicly or privately owned, providing water for municipal purposes either directly or indirectly, to more than 3,000 customers or supplying more than 3,000 acre-feet of water annually. Enacted in 1983, the UWMP Act requires every urban water supplier to prepare and adopt an UWMP at least once every five years in years ending in 0 or 5. The City of Pittsburg Water System, a water retailer, fits the defined criteria and has prepared this UWMP to address all requirements set forth in the CWC Sections through The UWMP Act was created by Assembly Bill (AB) 797, which was signed into law in September Since then, the Act has been amended by AB 2661 (July 1990), AB 1869 (October 1991), and AB 11X (October 1991). Since the 2010 UWMPs were submitted, AB 2067, Senate Bill (SB) 1420, and SB 1036 were passed, further amending reporting requirements associated with the UWMP Act. These changes are intended to encourage increased regional planning and the cooperative management of California s most precious commodity water. As a result, UWMPs have evolved to become: Foundation documents and sources of information for Water Supply Assessments (CWC Section 10613) and Written Verifications of Water Supply (CWC Section ); Long-range water supply planning documents; Source data for the development of regional water plans; Source documents for cities and counties preparing General Plans; Key components of Integrated Regional Water Management Plans; and A condition to qualify for receipt of certain State grant funds. For the City, the benefits of updating the UWMP extend beyond legislative compliance. The regional approach to documenting water-service planning allows the City to evaluate supply reliability goals and water use efficiency, identify opportunities and challenges to maximize the beneficial use of water, and provide an additional public forum for discussion of water resources issues. June
11 Table 2-1: Public Water System Public Water System Number Public Water System Name Number of Municipal Connections 2015 Volume of Water (AF) Supplied City of Pittsburg 18,156 8,772 TOTAL 18,156 8,772 NOTES: Volume of water is equal to the City s treatment plant production and therefore includes unaccounted for water. Regional Planning While the City of Pittsburg is preparing an individual UWMP, as described in Section 2.3, below, rather than participating in the completion of a Regional UWMP, it is cooperating with other agencies to update its 2015 UWMP. This regional cooperation and coordination is discussed in Section 2.5. Individual Planning and Compliance This UWMP is for the City of Pittsburg only and reports solely on the City s service area. Table 2-2: Plan Identification Individual UWMP Regional UWMP Fiscal Year Reporting and Units of Measure The City of Pittsburg is a retailer that reports on a fiscal year basis, starting on July 1 st and ending on June 30 th of every year. This 2015 UWMP reports for FY2015 (July 1 st 2014 to June 30 th 2015) and outlines all volumetric water data in acre-feet (AF). The City is not a wholesale supplier. Type of Agency Table 2-3: Agency Identification Agency is a wholesaler Agency is a retailer Fiscal or Calendar Year UWMP Tables Are in Calendar Years UWMP Tables Are in Fiscal Years If Using Fiscal Years Provide Month and Day that the Fiscal Year Begins (mm/dd) 07/01 Units of Measure Used in UWMP (select from Drop down) Unit Acre Feet June
12 Coordination and Outreach The City of Pittsburg is located within the CCWD service area and obtained approximately 87% of its water supply wholesale from CCWD during CCWD provides untreated surface water, pumped from the Sacramento-San Joaquin Delta (Delta) and delivered through the Contra Costa Canal. The remainder of the City s water supply is obtained from two groundwater wells located within the City boundary. Surface water from CCWD and groundwater from the City s wells are blended at the City s water treatment plant and delivered to customers within the City. Wastewater from the City is treated by Delta Diablo, formerly known as Delta Diablo Sanitation District, or DDSD. Delta Diablo also provides recycled water for industrial and irrigation use within the City s service area Wholesale and Retail Coordination The City coordinated closely with both CCWD and Delta Diablo in preparing this UWMP. In September 2015, the City sent CCWD and Delta Diablo notification letters stating that the 2015 UWMP was under preparation. The notification letters can be found in Appendix B. During UWMP development, Delta Diablo provided data on wastewater treatment and current and projected water recycling. Delta Diablo also reviewed portions of the administrative draft UWMP. CCWD, as the City s wholesaler, provided information on water supply reliability and shared its draft UWMP for the City s use in developing its Plan. The City shared a memorandum with CCWD in December 2015 outlining all of the requested data, such as water demand projections, groundwater use and population projections. This memorandum is included in Appendix C. In this memorandum, the City provided CCWD with projected water demands in five year increments for 20 years, as noted in Table 2-4. Table 2-4: Water Supplier Information Exchange The retail supplier has informed the following wholesale supplier(s) of projected water use in accordance with CWC Wholesale Water Supplier Name Contra Costa Water District Coordination with Other Agencies and Community Coordination with Other Agencies The City has actively participated for many years in integrated water resources planning and IRWM planning for the ECCC IRWM Region, shown in Figure 2-1. June


13 City of Pittsburg 2015 Urban Water Management Plan Figure 2-1: ECCC IRWM Regional Boundary Source: (ECCC, 2015) Water agencies, wastewater agencies, flood control districts, and watershed management groups within the ECCC Region have a long history of cooperative planning. In the early 1990s, the following agencies joined together as the East County Water Management Association and undertook an ECCC Water Supply Management Study, a comprehensive water management plan: June 2016 City of Antioch City of Brentwood Byron-Bethany Irrigation District Town of Discovery Bay Community Services District (formerly Contra Costa County Sanitation District No. 19) Contra Costa County Water Agency Contra Costa Water District Delta Diablo (Sanitation District) Diablo Water District East Contra Costa Irrigation District Ironhouse Sanitary District City of Pittsburg 6
14 This group continues to coordinate on water management issues for the Region, holding regular meetings. In July 2005, the group prepared a Functionally Equivalent Integrated Regional Water Management Plan (IRWMP) for the East Contra Costa Region; tying together several regional water management plans. In 2011, the group was awarded Proposition 84 Planning Grant funding for updating the IRWMP and developing a Groundwater Management Plan and a Salt and Nutrient Management Plan. The ECCC IRWMP was most recently updated in September Information prepared in the City s 2010 UWMP has been incorporated into the ECCC IRWMP, and conversely, water resources planning efforts conducted as part of the IRWM planning process will be reflected in this 2015 Update. Public Participation The City encouraged public participation in development and review of this UWMP. The City held an informational public hearing on the UWMP three weeks prior to the adoption hearing. At the public hearing on May 16, 2016, the City presented a summary of the draft 2015 UWMP, including the urban water use targets and the plan for meeting them, and invited public comment on the Draft UWMP. A Notice of Public Hearing to receive comments on the Draft UWMP was published in the Contra Costa Times, ECCC edition on April 25, 2016 and May 2, 2016, and was posted on the City s website. The Contra Costa Times is a major local newspaper of general circulation in the City s service area. The notice advised the public that copies of the draft 2015 Draft UWMP were available for review on the City s website, as well as at the Pittsburg Public Library and City Clerk s office prior to the hearing, and that written comments could be sent to the City s Director of Water Utilities. Copies of all public outreach materials, including the newspaper publication, are included in Appendix A City and County Notification Contra Costa County was sent a notification letter on September 22, 2015 stating that the City s 2015 UWMP was under preparation. A draft of the 2015 UWMP was also sent to the County along with a notice of intention to adopt. These notifications can be found in Appendix B. The City does not serve water to any other cities in the area. June
15 System Description Service Area Description Pittsburg was established along the Suisun Bay/Delta shoreline as a 10,000-acre land grant from the government of Mexico in Originally named New York of the Pacific, the name was changed to New York Landing during the Gold Rush, and then to Pittsburg in The City is located in the eastern portion of Contra Costa County, about 40 miles northeast of San Francisco. Originally a coal shipping port, the City was founded in 1849, and incorporated in 1903 as a general law city. In the 1940s and early 1950s, the City was a major commercial and industrial center for the County and the eastern ports of the greater San Francisco Bay Area. Pittsburg experienced rapid population growth during the 1970s and 1980s, evolving into a bedroom community for employment centers in west and central Contra Costa County. Today, the City is part of the second largest industrial center in the County and has a population of approximately 68,000. The Pittsburg Water Service Area (Figure 3-1) comprises all of the area within the City limits, around 10,000 gross acres (15.6 square miles). The service area is a subset of the larger Pittsburg Planning Area, which encompasses the city limits and its sphere of influence, a total of 26,960 gross acres (42.1 square miles). Of the larger Planning Area, approximately 37% lies within the City s Service Area. The area outside the City s Service Area is served by Golden State Water Company. The community of Bay Point lies in the Sphere of Influence and encompasses 2,300 gross acres. Bay Point, west of Pittsburg, and other unincorporated northwest areas constitute approximately 10,900 acres (33% of the Planning Area). Wetlands and Suisun Bay/Sacramento River environs account for 6,760 additional acres. The City of Pittsburg and its residents are increasingly focused on quality-of-life issues. Pittsburg has been designated both a Healthy City by California Healthy Cities and Communities Project, and a Tree City U.S.A. There is an active city-wide recycling program, an Environmental Center with a varied program of environmental classes, and an updated General Plan. The City has over 400 acres of parks, a remodeled and expanded 18-hole championship golf course, and a 750-berth marina. Pittsburg lies near the confluence of the San Joaquin and the Sacramento Rivers, on the south shore of Suisun Bay. The northern portion of the City is relatively flat, increasing in elevation as it extends into the southern hills. The hills form the northern tip of the Diablo Range, which extends from Contra Costa County to Santa Clara County. The average city elevation is five feet above mean sea level (MSL), with a general slope rising at a rate of approximately 2% southward to the Contra Costa Canal. South of the Contra Costa Canal are the foothills of Mt. Diablo, and the slope of the land increases to about 8%. Much of the recent development is occurring on the buildable slopes of the foothills to the south. The Pittsburg General Plan (City of Pittsburg, 2010) contains a detailed description of the topography, geology, and soils of the service area. The Pittsburg Water Service Area lies within two major drainage basins, that of Kirker Creek and Willow Creek; both basins discharge into Suisun Bay. The land area within the Kirker Creek drainage basin is primarily comprised of urban uses. The Willow Creek drainage area contains some open areas, but it is also increasingly developed into residential and commercial uses. June

 serving the City of Pittsburg is included in Section 6.5, Wastewater and Recycled Water.")
16 Service Area Boundary The City of Pittsburg Service Area is shown in Figure 3-1 and accounts for the City s potable water service area. The Contra Costa Canal, shown in the figure, conveys raw water from CCWD to its retailers, including the City of Pittsburg. The service area has not changed since the beginning of the baseline period (1990). A description of the Delta Diablo s recycled water distribution system (with figure) serving the City of Pittsburg is included in Section 6.5, Wastewater and Recycled Water. Figure 3-1: City of Pittsburg Service Area Climate The City experiences a Mediterranean climate with hot summers and mild winters. Average summer temperatures range from highs in the upper 90s to lows in the 50s. Winter temperatures range from the 60s to the low 30s. Average precipitation is 13 inches a year, occurring predominantly from November through April. The hot, dry season of May through October, as seen in Table 3-1a, creates a high demand for landscape water. June
17 Month Table 3-1a: Monthly Average Climate Data Summary a Standard Monthly Average ETo (inches) Average Total Rainfall (inches) Average Temperature (degrees Fahrenheit) January February March April May June July August September October November December a Sources of climate date include: the Antioch Pumping Plant #3 weather station (#040232) from , and average evapotranspiration (ETo) data for , for the Brentwood, California station (#47) of the California Irrigation Management Information System Climate Change Multiple studies of climate change impacts on water resources specific to the western United States and California are available. Despite predictions for somewhat less overall precipitation over the long-term, the ECCC IRWM Region, which includes the City of Pittsburg, is also predicted to have more extreme winter storm events. The Region is projected to have more frequent, longer, and more extreme heat waves and longer periods of drought. Additionally, river runoff patterns are anticipated to charge as a result of earlier springtime runoff of the Sierra snowpack, which will have implications for changes to Delta flows and water quality (ECCC, 2015). In recent decades, the mean sea level trend has been an increase of 2.08 millimeters/year at the nearest tidal gauge to the Region (Port Chicago, located in the San Francisco Bay) (ECCC, 2015). Mean sea level is expected to rise by approximately 12.3 to 60.8 centimeters by the year 2050 at the Golden Gate Bridge (ECCC, 2015), a significant increase compared to historical annual increases. The Delta in the northern portion of the ECCC IRWM Region is tidally influenced, and would be affected by rising sea levels, both in terms of Delta flows and water quality. These predicted climatic shifts will have an impact on the Region s water supply (discussed further in Section 6.10), water demand (discussed further in Section 4.5), flooding, water quality (discussed further in Section 6.10), ecosystems and habitats, and hydropower. Flooding Much of the infrastructure in the ECCC Region is at or below mean sea level, while land protected by independently maintained levees are at risk for increased levee failure and flood damage. Levee failures could lead to disruption in service from CCWD or a reduction in water supply reliability, as well as changes to water treatment, and wastewater treatment and disposal. Flooding may increase as a result of climate change as more extreme storms are predicted. In addition, sea level rise resulting from climate change also would increase flooding risks. CCWD has a water intake facility that is at risk if sea level increases significantly. Similarly, Delta Diablo s wastewater treatment plant facilities are located in areas that could be at risk of flooding given sea-level rise. June Max Min
18 Because the Delta is tidally influenced, it would be affected by rising sea levels. A rise in sea level would increase hydrostatic pressure on levees currently protecting low-lying land in the Delta, much of which is already at or below sea level. Many Delta islands have subsided 15 to 25 feet below sea level according to the Contra Costa County Hazard Mitigation Plan Update (ECCC, 2015). These effects threaten to cause potentially catastrophic levee failures that could inundate communities, damage infrastructure, and interrupt water supplies throughout the Region and statewide (ECCC, 2015). Ecosystem and Habitat Vulnerability The Delta is listed as one of the top 10 habitats to save for endangered species in a warming world in a report prepared by the Endangered Species Coalition (ECCC, 2015). The Delta provides habitat for hundreds of species of fish, birds, and other wildlife and enables the migration of Pacific salmon from spawning grounds in the upper reaches of cold-water rivers to the saline oceans and back again (ECCC, 2015). Regional climate-sensitive populations include salmonid species, migratory bird species, and wetland species (ECCC, 2015). Projected climate changes are likely to result in a number of interrelated and cascading ecosystem impacts. At present, most projected impacts are primarily associated with increases in air and water temperatures and include increased stress on fisheries that are sensitive to a warming aquatic habitat. Warmer temperatures can compromise the health and resilience of aquatic and terrestrial species and make it more challenging for them to compete with nonnative species for survival. Competition for habitat and food will intensify with climate change. Further, climate change effects could compound with non-climate stressors, such as land use changes, wildfire, and agriculture, leading to habitat fragmentation at increasing rates, thus contributing to species extinction (ECCC, 2015). Changes in seasonal runoff patterns may place additional stress on native species by affecting, for example, adult and juvenile migrations. Increasing temperatures are likely to increase challenges for providing suitable habitat conditions for salmonid populations. Of specific concern within the Region are Chinook salmon and steelhead, which prefer temperatures of less than 64.4 to 68 degrees Fahrenheit ( F) in mountain streams, although these anadromous fish may tolerate higher temperatures for short periods (ECCC, 2015). Increased water temperatures could reduce the habitat suitability of California rivers for these species (ECCC, 2015). Additionally, warmer air and water temperatures could potentially improve habitat for invasive species that outcompete natives. Invasive species, including various nonnative fish and plant species, are an ongoing issue within the Region. Some invasive species, such as quagga mussels, may additionally impact maintenance of hydraulic structures. Further, climate changes could decrease the effectiveness of measures currently used to control invasive species (ECCC, 2015). Warmer water temperatures also could spur the growth of algae, which could result in eutrophic conditions in lakes and reservoirs, declines in water quality (ECCC, 2015), and changes in species composition. Other warming-related impacts include northward shifts in the geographic range of various species, impacts on the arrival and departure of migratory species, amphibian population declines, and effects on pests and pathogens in ecosystems (ECCC, 2015). Impacts on terrestrial ecosystems have also been observed, including changes in the timing and length of growing seasons, timing of species life cycles, primary production, and species distributions and diversity (ECCC, 2015). Finally, the Region s significant recreational economy (boating, fishing, biking, and hiking) could be affected by changes to the ecosystem and wildlife habitat. Hydropower In general, electricity production from hydroelectric power generation and other sources tend to be affected by weather patterns and temperature changes. Increases in peak energy demands throughout California and decreases in supply may decrease power supply reliability which, in turn, could alter or disrupt water June
19 diversions, water treatment, and wastewater disposal. The western U.S. energy crisis of 2000 and 2001, although not caused by climate change, demonstrated the gravity of the resulting unreliable supply. The portion of the Region s power supplies that come from systems with hydropower generation and hydroelectric generation as part of the utility portfolio is sensitive to potential climatic changes affecting the timing and magnitude of precipitation, runoff, and reservoir water levels. Direct impacts for the ECCC Region may be energy reliability (brown outs) and cost. Water demands and production from conventional power plants located in the ECCC area can be expected to increase if out-of-area hydroelectric production decreases. Energy reliability is especially important for treatment and pumping operations Climate Change Mitigation and Adaptation Strategies The City of Pittsburg, through its involvement with the ECCC IRWM Region in water resources planning, recognizes the importance of considering climate change in water management. Management strategies include both climate change mitigation and adaptation. Mitigation involves actions to reduce greenhouse gas (GHG) emissions, while adaptation involves responding to the effects of climate change. Strategies already in place in the Region include: Consumer education Conservation Water and wastewater management Green buildings GHG reductions Expansion of recycled water systems Community involvement A potential adaptation strategy to increase water supply reliability is to develop infrastructure to interconnect the water supply systems of nearby water agencies, such as that operated by the East Bay Municipal Utility District, to reduce reliance on the Delta. Additionally, increasing recycled water usage would improve water supply reliability since recycled water would offset potable water supplies and is not affected by hydrologic conditions. This would provide additional dry-year reliability for irrigation customers and other industrial users that could utilize recycled water. Pittsburg s and the ECCC IRWM Region s IRWM planning considers climate change adaptation during identification of projects for inclusion in the IRWM Plan and during the project prioritization process. The City will continue to coordinate with the IRWM Region and coordinate with other local agencies to identify and implement climate change mitigation and adaptation strategies. More details on local climate change and mitigation strategies can be found in Chapter 2.9 of the ECCC IRWM Plan Update. Service Area Population and Demographics Although the City of Pittsburg has shown steady population growth over the last 20 years, its future growth will be limited as the availability of open, developable land declines. In 1979, the City had 29,100 residents; by 1986, the population had increased to 41,600, and the City s 2015 population is 67,628. The City s General Plan projects an average annual population growth rate of 1.4% until 2020 and 1.3% beyond that until Population projections for 2020 through 2040, shown in Table 3-1, are based on projections developed by the Association of Bay Area Governments (ABAG) (Pittsburg, 2015). Of the City s 12,259 acres, 435 acres remain vacant and are available for residential development, and 64 acres of land are designated as underutilized (Pittsburg, 2015). As a result, the housing element estimates space for 2,901 to 8,763 new units; however the realistic capacity is identified as 5,000 new units. June
20 Table 3-1: Population Current and Projected Population Served a ,628 72,000 76,500 81,300 86,400 91,600 a Source for 2015 population: Department of Finance January population estimates are based on ABAG projections as described in the City of Pittsburg Housing Element Update, Other Demographic Factors Other demographic factors that can impact water management and planning include, but are not limited to, the existence of seasonal populations, the proportion of single family and multi-family homes in the service area, or large versus small lots. The City does not have a population that fluctuates seasonally due to tourists, agricultural or commercial needs, or for other reasons. The estimated average household size in the City is 3.2 persons per household (Pittsburg, City of Pittsburg Housing Element, 2015). The City s service area consists primarily of residential water users, specifically single family homes. In 2013, single family homes encompassed approximately 77% of the City s housing stock, while multi-family units and mobile homes comprised roughly 20% and 4%, respectively. In 2015, 48% of the City s water use was by single family homes and 12% of the water use by multi-family homes. Based on 2012 estimates, approximately 31% of Pittsburg households are extremely or very low-income (earning 50% or less of the area median income (AMI) for a family of four). Approximately 18% are low income (51% to 80% of AMI) and 21% are moderate income (81% to 120% of AMI) (Pittsburg, City of Pittsburg Housing Element, 2015). In addition, there are disadvantaged communities (DACs) within the City s service area, as defined as having median household incomes (MHIs) less than 80% of the Statewide MHI. When water improvement projects are needed, DACs may not have the economic viability to fund such projects, and therefore may need to seek grant funding. June
21 System Water Use Water demand projections provide the basis for planning for future supplies and infrastructure. This chapter describes the City s historical, current, and projected water use. Historical water use and water treatment plant production records, combined with projections of population, provide the basis for estimating future water demands for the City s water service area. This chapter presents a summary of available demographic and water use data and the resulting projections of future water needs for the City. Records of historical water treatment plant production, groundwater pumping, and metered customer use were obtained from the City s Department of Water Utilities. Water treatment plant production is the volume of groundwater and surface water treated at the City s water treatment plant and conveyed in the distribution system. It includes all water delivered to residential, commercial, and industrial customers, but does not include recycled water. Recycled water is described in more detail in Chapter 6, System Supplies. Daily water demand in the City fluctuates throughout the year, primarily due to seasonal weather changes; water demands are significantly higher in the summer than the winter. Residential use makes up the majority of potable water use within the City (approximately 70%), with commercial, governmental, institutional and industrial uses accounting for approximately 30% of the City s water use. Per capita water use and water use by customer type are discussed in detail later in this chapter. Water Use by Sector The City s water use for 2015 was 8,772 AFY, which was a 13% increase from the 2010 water use of 7,784 AFY. As part of the 2010 UWMP, the City projected that the water use in 2015 would be 9,461 AFY; actual 2015 demand was more than 7% less than the projected 2015 demand. The City s initiatives in decreasing water use to meet 2015 and 2020 urban water use targets as required by SBX7-7 and meeting Statemandated drought restrictions have been the biggest factors in the actual 2015 water demand being less than that projected for the same year in the 2010 UWMP. The City s 2015 water demand of 8,772 AFY equates to a daily per capita water use of 116 GPCD. The City s potable water use in 2015, broken down by use type, is presented in Table 4-1. The City does not use water for groundwater recharge, saline water intrusion barriers, agricultural irrigation, sales/transfers/exchanges to other agencies, wetlands or wildlife habitat, nor does the City convey raw water to any of its customers. June
22 Single Family Use Type Table 4-1: 2015 Demands for Potable and Raw Water Actual (AFY) General Description 2015 Actual Level of Treatment When Delivered Volume Other Hydrant meters 21 Drinking Water Landscape irrigation at parks Other 30 (unmetered) Water treatment plant use (lake Other evaporation at 5 feet per year x 3 25 acres and miscellaneous use) Other Unbilled Unmetered 110 4,214 Multi-Family 1,050 Commercial 478 Industrial 774 Institutional/Governmental 193 Landscape 901 Other Apparent Losses 119 Losses Real Losses 857 TOTAL 8,772 Since the 2015 daily per capita water use (116 GPCD) is less than the revised 2015 and 2020 GPCD targets of 147 GPCD and 131 GPCD, respectively, (see Table 5-1), it is reasonable to assume that the City s future demands can increase proportionally with population increases, while still meeting the 2020 target. The City s projected water demands, broken down by use type, for 2020, 2025, 2030, 2035 and 2040 are shown in Table 4-2. The projections are based on average water use from 2010 to 2012, assuming that average water demand will rebound from current drought restrictions. The City s past water use was investigated to formulate this assumption. Water use during 2014 and 2015 were eliminated from inclusion in the baseline number as not being representative of future water use due to the mandatory conservation requirements was eliminated because it was a dry year, even though it was not considered a drought year at that time. The years prior to 2010 were not considered as the basis for demand projections due to the deflated water demands likely caused by the Great Recession. Average demand between 2010 and 2012 was 127 GPCD, and is assumed to represent average demand in the City from 2020 to Growth is assumed proportional across all customer sectors from 2015 levels and is consistent with the City s projected populations as described in its Housing Element Update, and shown in Table 3-1. The City is not expecting any major industrial growth during the projected planning period. Thus, to calculate demand projections by use type, the average daily per capita water use (126.8 GPCD) was multiplied by the population projection for the appropriate year, converted to AFY, and then multiplied by the percentage of the use type by volume. June
23 Use Type Table 4-2: Demand for Potable Water Projected (AFY) Additional Description Projected Water Use Single Family 4,914 5,220 5,550 5,894 6,252 Multi-Family 1,224 1,301 1,383 1,469 1,558 Commercial Industrial ,020 1,083 1,149 Institutional/Governmental Landscape 1,051 1,117 1,187 1,261 1,338 Other Hydrant meters Other Water treatment plant use (lake evaporation at 5ft per year x 3 acres and misc. use) Other Unbilled Unmetered Other Apparent Losses Losses Real Losses 999 1,062 1,129 1,199 1,272 Notes: TOTAL 10,230 10,868 11,554 12,270 13,017 a The City plans to have all unmetered irrigation accounts metered by 2020, so projected demands from the 2015 Other - Landscape irrigation at parks (unmetered) is captured in the Landscape category for 2020 through Total water demands in the City of Pittsburg, combining potable and recycled water uses, for 2015 and projected forward to 2040 are outlined in Table 4-3. The City does not anticipate supplying any raw water to any of its customers in the future recycled water demand and projections to 2040 are described in detail in Chapter 6, System Supplies. Table 4-3: Total Water Demands (AFY) Potable and Raw Water Demand (from Table 4-1 and Table 4-2) 8,772 10,230 10,868 11,554 12,270 13,017 Recycled Water Demand (from Table 6-4) 6,657 6,757 6,757 6,757 6,757 6,757 TOTAL WATER DEMAND 15,329 16,987 17,625 18,311 19,027 19,774 Distribution System Water Losses Additional Water Uses and Losses System water losses include leaks, meter under-registration, system and hydrant flushing, use for fire protection, and hydrant use for construction. Real and apparent water losses have been quantified with the AWWA water audit and are presented in Table 4-4. Apparent water losses include unauthorized consumption, customer metering inaccuracies and systematic data handling errors. Real water losses comprise all other unaccounted for water. In 2015, water losses were approximately 11% of water treatment plant production. The City continues to take steps to reduce unaccounted for water and system losses through leak detection and repair, and other activities. June
24 Table 4-4: 12 Month Water Loss Audit Reporting (AFY) Reporting Period Start Date (mm/yyyy) Volume of Water Loss 07/ NOTE: Based on correspondence with DWR, water losses reported in Table 4-4 include real and apparent water losses. Water Savings from Codes, Standards, Ordinances, or Transportation and Land Use Plans Water savings from codes, standards and ordinances, known as passive savings, were considered in the demand projections, as well as water demand from lower income residences. The projections assume that the percentage of passive savings and lower income residential demands will not change from 2015 percentage levels and will increase proportionally with population growth. Table 4-5: Inclusion in Water Use Projections Are Future Water Savings Included in Projections? If "Yes" to above, state the section or page number where citations of the codes, ordinances, etc utilized in demand projections are found. Lower Income Residential Demands Included Yes Location in UWMP: Section 4.3 Yes The City collaborates closely with its wholesaler, CCWD, to encourage conservation and sustainable water use through ongoing customer outreach. CCWD offers extensive resources to its wholesale service area customers through its Conservation Program. More details about the CCWD Water Conservation Program and the City s conservation efforts are included in Chapter 9, Demand Management Measures. In addition to active conservation activities implemented through CCWD s Conservation Program, passive conservation is also achieved through state and local efficiency codes. Efficiency codes that require waterefficient fixtures and appliances, grant funding to promote water conservation, residential weather-based irrigation controllers, and efficient landscape practices are expected to achieve additional water use reductions in the City s water service area. The City also maintains a water conservation page ( that provides water conservation resources both general and specific to conditions within Contra Costa County. The site includes links to information regarding both household and irrigation conservation practices, and contains various documents regarding the City s 15% Water Conservation Program, implemented in 2009 in collaboration with CCWD, to address the impacts of a severe drought in the Region. As part of the conservation efforts, the City adopted Resolution No , establishing a Water Conservation Program and issuing a Water Conservation Advisory, informing the residents of water conservation efforts and future conservation plans, and establishing penalties for non-compliance. The City adopted a landscape ordinance on December 20, 2010, which is intended to ensure the conservation of water in irrigated landscaped areas. The ordinance outlines current and standards and requirements for projects creating or rehabilitating landscaping. Estimated Demands for Lower Income Households CWC Section (a) requires suppliers to estimate projected water use for single family and multifamily residential housing needed for lower income households, as identified in the Housing Element of the General Plan for the service area of the supplier. It does not require quantification of current water use June
25 by lower income households. According to the City s current Housing Element Update, (Pittsburg, 2015), an estimated 49% of households in the City are lower-income, defined as having incomes below 80% of the area median income, which includes low, very low, and extremely low income households. Further, per the Housing Element, the City s Regional Housing Need Allocation for 2014 through 2022 for lower income housing is 646 units. The Regional Housing Need Allocation does not break down the housing need by housing type (single family vs. multi-family); therefore, the projected water demand for lower income housing was conservatively estimated based on the average 2015 water demands for single family residential customers. At 0.25 AFY per household 1 and 646 lower income household units, the projected water demand for lower income housing units is 161 AFY in This estimate is considered to be conservative because multifamily residential housing uses less water on a per-dwelling unit than single family housing. This demand is incorporated in overall demand projections in this UWMP by assuming lower income housing grows proportionally to City population growth. Climate Change Impacts to Demand Pittsburg s water use varies by more than 50% seasonally. For example, in 2015, the minimum monthly water use was 454 AF February, increasing to 878 AF in August, suggesting that water demand in the City, in particular for landscape irrigation and industrial purposes, will increase as a result of more frequent, longer, and more extreme heat waves; increased air temperatures; increased atmospheric carbon dioxide levels; changes in precipitation, winds, humidity, atmospheric aerosol and ozone levels; and population growth. The City is part of the second largest industrial center in Contra Costa County, leading to high potable and recycled water demands for industrial processes and cooling. In addition, in response to the current drought, much of the City s water demands are hardened, for example, with water efficient home appliances and expansion of recycled water use for outdoor irrigation. This makes water demand less elastic, because there is less opportunity for further conservation in the future, and thus makes the City more vulnerable to climate change. System Energy Intensity An urban water supplier s energy intensity (EI) of water is the amount of energy (kwh) required for the process of supplying water from the point that it enters a system to the point at which it exits the system per unit volume of water. The amount of energy used for conveyance, treatment, distribution and placement of water in to storage per AF of water was analyzed, and they system s total energy intensity is kwh/af. The City s EI calculations are further explained and outlined in detail in Appendix J. 1 Based on 16,882 single family households with a demand of 4,487 AFY in June
26 SBX7-7 Baselines and Targets The Water Conservation Bill of 2009, also referred to as SBX7-7, requires individual retail water suppliers to set water conservation targets for 2015 and 2020 to support an overall State goal of reducing urban potable per capita water use by 20% by Individual supplier conservation targets must be determined using one of four methods that are founded upon a baseline of use that is calculated using the specific guidelines described in the UWMP Guidebook. This chapter summarizes updated GPCD targets for the City of Pittsburg; SBX7-7 tables are presented in Appendix D. Updated Calculations from 2010 UWMP Summary of Revisions The 2010 UWMP water use baseline and target calculations were based on Department of Finance (DOF) data and calendar years. As required by the UWMP Guidebook, the calculations were updated for the City s 2015 UWMP using Census population data for 1990, 2000 and 2010, rather than the DOF data. Linear interpolation was used to estimate population from 1991 to 1999 and 2001 to In addition, Pittsburg s 2015 UWMP is reporting all data on a fiscal year basis, so the water use calculations were updated to reflect water use by fiscal year (July 1 st to June 30 th ), rather than calendar year used in its 2010 UWMP. Gross water use for each year within the base year range was calculated using DWR s Methodology 1 and was based on production data from the City s Water Treatment Plant. The gross water use is defined in CWC Section (g) as the total volume of water entering the distribution system, excluding recycled water. Pittsburg s gross water use for its water service area was determined based on water production data from its water treatment plant and does not include recycled water. A 10-year baseline period was in both the 2010 UWMP and 2015 UWMP SBX7-7 calculations. The four allowable DWR methods for calculating water use targets are: Target Method 1: 80% of Base Daily Per Capita Water Use Target Method 2: Performance Standards Target Method 3: 95% of the DWR Hydrologic Region Per Capita Use Target Target Method 4: Applying Savings by Water Sector Based on a preliminary evaluation of the four methods, the City utilized Target Method 1 for the revised calculations, the same method used in The calculated targets were compared against DWR s maximum allowable target, which is equal to 95% of the City s 5-year base per capita use. The revised 2020 target meets the maximum allowable target, which would result in a target of 155 GPCD. Table 5-1 summarizes the revised GPCD baselines and targets. Table 5-1: Baselines and Targets Summary Baseline Period Start Years From SBX7-7 Table 1 End Years From SBX7-7 Table 1 Average Baseline GPCD* 2015 Interim Target * Confirmed 2020 Target* 10 year Year *All values are in Gallons per Capita per Day (GPCD) Regional Alliance The baseline and targets described above were calculated based on data for the City of Pittsburg s water service area. In addition, the City participates in a regional alliance, led by CCWD. CCWD s 2015 UWMP June
27 includes a regional alliance analysis in compliance with SBX7-7 requirements, which includes its wholesale municipal customers (cities of Antioch, Pittsburg, Martinez, Golden State Water Company, and Diablo Water District). CCWD s regional analysis is included in Appendix B of CCWD s 2015 UWMP and establishes a regional target of 210 GPCD for The regional analysis baseline calculation included heavy industrial uses in CCWD s service area; however, these heavy industrial uses are not within the City s water service area. For this reason, the City deemed the revised targets, specific to City water use, shown in Table 5-1 to be more appropriate for its planning purposes Compliance Daily per Capita Water Use (GPCD) To calculate the 2015 actual GPCD, the DOF January 2015 population for Pittsburg was used (as stated in Section 3.4) since the service area is contiguous with the City boundaries. The 2015 population for the City of Pittsburg was estimated at 67,628. For water use, the data from 2015 (as outlined in Section 4.1) were utilized for the calculation. Gross water use for 2015 was 8,772 AF (2,858 MG). As shown in Table 5-2, Pittsburg met its 2015 interim target and is also currently below its 2020 target. The City did not adjust its compliance GPCD using weather normalization, economic adjustment or extraordinary events. Actual 2015 GPCD 2015 Interim Target GPCD Extraordinary Events Table 5-2: 2015 Compliance Optional Adjustments to 2015 GPCD From Methodology 8 Economic Adjustment Weather Normalization TOTAL Adjustments Adjusted 2015 GPCD 2015 GPCD (Adjusted if applicable) Did Supplier Achieve Targeted Reduction for 2015? Y/N NA Yes *All values are in Gallons per Capita per Day (GPCD) June
28 System Supplies This chapter describes the current and future water supplies available to the City. Purchased Water The City is within the CCWD service area and purchases Central Valley Project (CVP) water pumped from the Delta by CCWD, its wholesale supplier. CCWD has a contract with the U.S. Bureau of Reclamation (USBR) for 195,000 AFY of CVP water. In March 2005, CCWD renewed its water service contract with the USBR for a period of 40 years, through February The City obtains 85% to 95% of its water supply from CCWD pursuant to a contractual arrangement allowing the City to obtain such quantity of water as is necessary to meet its needs, subject to rationing restrictions in the event of drought or other extraordinary circumstances. CCWD s future supply projections indicate adequate availability of surface water sources delivered through its contract with the USBR, along with other available sources and short-term purchases under normal conditions. The current and projected wholesale supply from CCWD to the City of Pittsburg is presented in Table 6-8 and Table 6-9. More detailed discussion of CCWD s supply reliability is included in Chapter 7, Water Supply Reliability Assessment. Groundwater Groundwater Basin The City overlies the Pittsburg Plain Groundwater Basin, presented as Groundwater Basin Number 2-4 in DWR s Bulletin 118 (DWR, 2004), and extracts groundwater from it using two wells. The basin is bounded by Suisun Bay on the north, by the Tracy Sub-basin of the San Joaquin Valley Groundwater Basin on the east, and by the Clayton Valley Groundwater Basin on the west. The southern boundary of the basin extends inland from the Suisun Bay by approximately one to three miles. It lies within the two major drainage basins of Kirker Creek and Willow Creek, both of which discharge into Suisun Bay. The water-bearing units in the basin are Pleistocene to Recent age alluvium deposits. The Pleistocene deposits consist of consolidated and unconsolidated sediments characterized by expansive clays. The modern alluvial sediments are characterized by soft, water saturated muds, peat and loose sands. The maximum thickness of these deposits is 400 feet. The aquifers in the basin area are hydrologically connected to the Sacramento River. There are limited data regarding the occurrence and movement of groundwater in the basin (DWR, 2004). Pittbsurg Plain groundwater Basin has not been adjudicated Groundwater Management The City published the Pittsburg Plain Groundwater Management Plan (GWMP) in October The GWMP was established to manage and protect groundwater resources within the City and the underlying groundwater basin. The primary objective the GWMP is to provide a long-term strategy to maintain the quality, reliability, and sustainability of groundwater resources within the Pittsburg Plain Groundwater Basin. To accomplish this, the City manages groundwater conjunctively with its surface water resources and supports Basin Management Objectives directed toward the sustainability and optimal use of groundwater supplies. A copy of the executive summary of the Pittsburg Plain GWMP can be found in Appendix H Overdraft Conditions Hydrographs created from DWR well data in the Pittsburg Plain Groundwater Basin indicate that groundwater levels have remained fairly stable over the period of record, with the exception of static water level drops and subsequent recovery associated with the and drought periods. June
29 DWR has not identified that overdraft conditions will occur if present groundwater conditions continue. According to DWR s list of critically overdrafted basins, released on August 6, 2015, Pittsburg Plain Groundwater Basin is not a critically overdrafted groundwater basin. Groundwater levels in the basin have historically been stable because the majority of water demand in areas overlying the basin has been met by surface water (Pittsburg, 2012) Historical Pumping The City has two municipal wells, Rossmoor and Bodega, which together are currently producing about 1,500 AFY. In 2010, the City completed the Bodega Well Pump Station Project, replacing the Ballpark well, which experienced frequent shut downs and performed inconsistently. These relatively shallow wells (approximately 200 feet deep) deliver approximately 600 (Rossmoor) and 1,200 (Bodega) gallons per minute. The total amount of groundwater pumped by the City from the Pittsburg Plain Groundwater Basin in 2015 was 1,180 AFY, as shown in Table 6-1. Table 6-1: Groundwater volume pumped (AFY) Groundwater Type Location or Basin Name Alluvial Basin Pittsburg Plain 1,694 1,883 1,663 1,418 1,180 Surface Water TOTAL 1,694 1,883 1,663 1,418 1,180 The City of Pittsburg relies upon surface water supplies from CCWD; therefore, these are accounted for in Section 6.1, Purchased Water. The City does not utilize any other local surface water resources. Stormwater The City of Pittsburg currently does not have any storm water recovery systems nor use storm water as part of its potable or non-potable supply systems. Wastewater and Recycled Water The Delta Diablo Wastewater Treatment Plant (WWTP) serves the cities of Antioch and Pittsburg and the unincorporated county area of Bay Point. In 2015, Delta Diablo collected 14,169 AF of wastewater, with approximately 49 % of the treated wastewater used for recycled supply for various uses. The remaining treated wastewater is disposed of through a river outfall into the Delta at New York Slough. Since preparation of the 2010 UWMP, the proportion of wastewater used for recycled water supply has increased by 9% (up from 40% in 2010), and it is expected that the amount of recycled water used in the Delta Diablo service area will increase in the future Wastewater Collection and Treatment All of the wastewater that flows in the City s sanitary sewer system is collected and treated at the Delta Diablo WWTP. The WWTP is designed with a Delta outfall for disposal of wastewater that is not recycled. The WWTP provides secondary treatment consisting of the following processes: 1) Primary Treatment 2) Activated Sludge/Trickling Filter 3) Secondary Clarification June
30 Prior to disinfection, treated wastewater to be used for recycled water is sent to the Recycled Water Facility (RWF). Treated wastewater that is not needed for recycled water is disinfected, dechlorinated and discharged to the Delta. The RWF further treats the wastewater to tertiary levels and consists of the following processes: 1) Flocculating Clarification 2) Filtration 3) Disinfection Table 6-2 outlines the wastewater collected and treated within the Delta Diablo service area in Delta Diablo does not have metered wastewater flows broken down by city for its service area, thus wastewater flows for Pittsburg alone are not reported herein. About half of the secondary-treated wastewater treated by Delta Diablo undergoes tertiary treatment at its Recycled Water Facility. Most of this tertiary-treated water is used for cooling water at the Delta and Los Medanos Energy Centers, with a lesser amount used for irrigation at local parks. The power plants return approximately 2 MGD (2,240 AFY) of cooling tower water to the WWTP, where it is combined with secondary-treated wastewater, chlorinated, and dechlorinated prior to discharge to the Delta. Currently, the WWTP has an average dry weather capacity of 19.5 MGD. Delta Diablo is anticipating an increase in the capacity of its WWTP to 19.3 MGD, 22.3 MGD and 25.3 MGD at one-third build-out, two-thirds buildout, and full service area build-out, respectively (Delta Diablo, 2013). Wastewater that is not treated in Delta Diablo s Recycled Water Facility is discharged into the Delta. Delta Diablo s Waste Discharge Requirements (Order No. R , NPDES Permit No ) allow for treated effluent to be discharged into New York Slough through a deep-water outfall, approximately 400 feet from shore. Table 6-3 summarizes the 2015 volumes of wastewater that were treated and discharged, as well as wastewater that was treated and used as recycled water in the Delta Diablo service area. Delta Diablo does not have wastewater flows broken down by city for its service area; therefore, it is not possible to report these same volumes for Pittsburg alone. Recycled water use for the City of Pittsburg alone in 2015 was 6,644 AFY. June
31 Table 6-2: Wastewater generated within Delta Diablo Service Area in 2015 (AFY) Percentage of 2015 service area covered by wastewater collection system 100% Percentage of 2015 service area population covered by wastewater collection system 100% Wastewater Collection Recipient of Collected Wastewater Volume of Name of Wastewater Is WWTP Operation Is WWTP Name of Wastewater Wastewater Volume Metered Wastewater Treatment Agency Treatment Plant Contracted to a Third Located Within Collection Agency or Estimated? Collected in Receiving Collected Name Party? (optional) UWMP Area? 2015 Wastewater Drop Down List Delta Diablo (Sanitation District) Metered 14,169 Total Wastewater Collected from Service Area in 2015: 14,169 Delta Diablo (Sanitation District) Delta Diablo Wastewater Treatment Plant No No Wastewater Treatment Plant Name Delta Diablo Wastewater Treatment Plant Discharge Location Name or Identifier New York Slough Table 6-3: Wastewater Treatment and Discharge within Service Area in 2015 (AFY) Discharge Location Description River outfall in to the Delta Wastewater Discharge ID Number (optional) Method of Disposal Bay or Estuary Outfall Does This Plant Treat Wastewater Generated Outside the Service Area? Yes Treatment Level Secondary Treatment Wastewater Treated 2015 volumes Discharged Treated Wastewater Recycled Within Service Area Recycled Outside of Service Area 14,169 8,215 6,894 0 Total 14,169 8,215 6,894 0 NOTES: 1. Recycled water within service area, wastewater treated and discharged treated wastewater provided is for the Delta Diablo service area, not the Pittsburg service area. 2. Some recycled water provided to power plants comes back to the Delta Diablo Wastewater Treatment Plant as blow-down water and is then discharged. This water is double counted in the Discharged Treated Wastewater Column and the Recycled Within Service Area column in the table above. June


32 6.5.2 Recycled Water System Recycled water connections within the City s service area are the Delta Energy Center, the Los Medanos Energy Center, the Delta View Golf Course, three Pittsburg Unified School District schools, Mt. Diablo Resource Recovery Park, various city parks and street side landscaping. Recycled water is delivered via the recycled water system shown in Figure 6-1. The largest recycled water users receiving recycled water from Delta Diablo are the Delta Energy Center and Los Medanos Energy Center. In 2000, Delta Diablo and CCWD reached an agreement for Delta Diablo to provide recycled water to these energy centers for turbine cooling at the energy facilities. Additional treatment of wastewater to comply with requirements of the California Department of Public Health is performed onsite at a new 12.8 MGD reclamation plant owned and operated by Delta Diablo. In 2015, the Los Medanos Energy Center used 3,113 AFY and the Delta Energy Center used 2,975 AFY of recycled water. Figure 6-1: Recycled Water System Given the large amount of recycled water that was supplied to these industrial facilities and that the City will not be required, even in a back-up role, to supply water for these facilities, these projected uses are not included in the estimated City demand calculations. They are shown as Other recycled water uses in Table 6-4 for informational purposes only. The back-up water supply for these industrial customers is provided by CCWD Recycled Water Beneficial Uses The City supports the further development of irrigation and industrial recycled water uses where available supplies of recycled water, appropriateness of planned use, and economic feasibility coincide. The City utilized recycled water for irrigation purposes (parks and road median landscaping) in the drought of the June
33 early 1990s. Delta Diablo began providing recycled water to the City of Pittsburg s irrigation locations at Central Park and along the 8 th Street, Columbia and Santa Fe Corridors in Since then, recycled water use in the City s service area has continued to increase with added users. Current and projected beneficial use of recycled water, which includes planned connections, are summarized in Table 6-4. Table 6-4: Current and Projected Recycled Water Direct Beneficial Uses (AFY) within Service Area a Name of Agency Producing (Treating) the Recycled Water: Name of Agency Operating the Recycled Water Distribution System: Delta Diablo (Sanitation District) Delta Diablo (Sanitation District) Supplemental Water Added in Source of 2015 Supplemental Water Beneficial Use Type Landscape irrigation (exc golf courses) General Description of 2015 Uses Level of Treatment N.A Tertiary Golf course irrigation Tertiary Industrial use Tertiary 6,089 6,089 6,089 6,089 6,089 6,089 Notes: Total: 6,557 6,757 6,757 6,757 6,757 6,757 a Current and projected water use is based on 2015 fiscal year recycled water use and planned recycled water projects outlined in Table 6-6. In the 2010 UWMP, the City of Pittsburg projected the future use of recycled water based on potential recycled water irrigation projects throughout the City and industrial reuse by the two energy centers. The 2010 UWMP projections for recycled water use in calendar year 2015 was 7,634 AF. This was based on 459 AF of actual irrigation use in 2010 and 6 AF of future recycled water use from the Marina Walk project, which was scheduled to be completed in 2012, in addition to 7,169 AF of industrial reuse. The actual total recycled water use in calendar year 2015 was 7,060 AF, with 449 AF used for irrigation purposes and 6,611 for industrial reuse, as shown in Table 6-5. Demand projections in the 2010 UWMP were formed on a calendar year basis, so the comparison in this table uses 2015 calendar year data for consistency. Although the Marina Walk project came online in 2012 and has since had an average recycled water demand of 5.6 AFY, close to the expected 6 AFY recycled water production volume, actual recycled water use for during calendar year 2015 was lower than projected, primarily due to the lower demand for recycled water by the two energy centers. Table 6-5: 2010 UWMP Use Projection Compared to 2015 Actual a Use type 2010 Projection for 2015 (AFY) 2015 actual use (AFY) Landscape irrigation (excluding golf courses) Golf course irrigation Industrial use 7,169 6,611 Total 7,634 7,060 Notes: a 2015 projection was for calendar year 2015 and was based on 2010 calendar year use. For comparison purposes, 2015 actual use here is reported for calendar year 2015, whereas Table 6-4 actual water use is reported on a fiscal year basis. June
34 6.5.4 Actions to Encourage and Optimize Recycled Water Use Recycled water will continue to be a significant, reliable source of supply in the future. The mechanisms encouraging recycled water use in the City include: Securing funding from local, state, and federal agencies to offset capital costs. Ongoing coordination with Delta Diablo and CCWD. Promoting partnerships to encourage regional and local water recycling projects. Urging regulatory agencies to streamline regulatory requirements. Supporting research that addresses public concerns on recycled water use, develops new technology for cost reduction, and assesses health effects to protect the public. The City does not have any current plans to utilize financial incentives for recycled water use. As recycled water projects are identified, financial incentives may be one action considered to promote the implementation of the recycled water project if the project is feasible and cost-effective. The City will continue to evaluate the potential for grant funding of recycled water projects, and seek opportunities to implement portions of larger projects as they becomes economically feasible. The cost differential between unit costs for recycled water and for potable water is one financial incentive for recycled water. With capital expansion and recycled water distribution costs not included, recycled water costs about $300 per AF from Delta Diablo and treated water from the City costs about $1,400 per AF. Delta Diablo has identified landscape irrigation and industrial cooling as the primary uses of recycled water in its service area. Future recycled water projects are expected to be consistent with these two uses. Planned recycled water connections are outlined in Table 6-6. Table 6-6: Methods to Expand Future Recycled Water Use Name of Action Description Planned Implementation Year Expected Increase in Recycled Water Use (AFY) Parkside Elementary School Irrigation Marina Vista Irrigation Buckley Square Irrigation Landscape along Railroad Avenue Irrigation Law Enforcement Training Center Irrigation Median on 3 rd Avenue & Railroad Avenue Irrigation Bay Harbor HOA Irrigation Desalinated Water Opportunities Total 200 Desalination involves removing salts and impurities from non-potable water (e,g., seawater, brackish surface water or brackish groundwater) using treatment technologies such as reverse osmosis membranes or distillation. After treatment, the water is suitable for drinking water purposes. Desalinated water is not an existing supply for the City. Potential opportunities for desalination supply in the ECCC IRWM Region are being explored on a regional level through the East County Water Management Association (ECWMA), of which the City of Pittsburg is an active participant. To date, the cost of implementing a desalination supply, including brine disposal, has not been cost-effective compared with other available sources. As advancements in technology make desalination a more cost-effective option in coming years, the ECWMA, including the City of Pittsburg, will consider desalination projects as potential supply sources. June
35 Exchanges or Transfers The City does not currently rely upon exchanges or transfers, nor does it anticipate any transfer or exchange opportunities in the future as the City receives the majority of its water supplies under its contract with CCWD and does not maintain the infrastructure necessary to facilitate these opportunities (i.e. the City does not maintain its own surface water intake). This does not, however, preclude CCWD from engaging in any transfer and/or exchange opportunities in the future. Future Water Projects Future Water Supply Projects The City of Pittsburg has no immediate plans to implement water supply projects within its service area. However, CCWD has evaluated the need for and alternatives of future water supply projects to meet the needs of its wholesale customers, including the City, through the completion of its Future Water Supply Study (FWSS). To evaluate alternative ways of meeting future demand in the context of an overall water supply plan, CCWD completed the FWSS, updated most recently in Future supply projects identified in the study included: Recycled water o Refinery Recycled Water Project o Delta Diablo Recycled Water Agreement CCWD Groundwater Project Water Transfers o Spot Market Purchases o Long-Term Water Transfers o Long-term Agricultural Water Exchange Fallowing o Long-term Agricultural Water Exchange Conjunctive Use The evaluation from the FWSS concluded that the options listed in Table 6-7 provide the greatest benefit at lowest unit cost as dry year options. June
36 Table 6-7: Future Water Supply Projects Name of Future Projects or Programs Long-term Transfers Spot Market Purchases Long-term Agricultural Conjunctive Use Long-term Agricultural Fallowing Joint Project with other agencies? Yes Yes Yes Yes CCWD CCWD CCWD CCWD Description CCWD would enter into a long term water transfer agreement for a fixed amount of annual water supplies. CCWD would determine its water supply requirements each year and decide whether to purchase additional supplies. CCWD would partneri with an agricultural partner or irrigation district north of the Delta which has both pre 1914 surface water supplies and access to groundwater supplies. In dry years, the agricultural district would shift its water usage to local groundwater supplies and transfer its surface water allocation to CCWD. CCWD would partner with an agricultural partner, such as a large agricultural water user or irrigation district, to exchange supplies in dry years either by fallowing land or shifting crops to conserve water for other uses. Planned Implementation Year a Expected increase in water supply (AFY) , , , ,000 Notes: a Dry year shortfalls are not projected until the year 2030, and at that time only under multiple dry year conditions Supplemental Sources A seemingly apparent source of water for Pittsburg would be diversion directly from the Delta via a pump station and pipeline to the Pittsburg Water Treatment Plant. However, this is not a feasible option for several reasons: Pittsburg has not established water rights to the San Joaquin/Sacramento Rivers. Permits to withdraw water would be required from the State Water Resources Control Board (SWRCB) as well as other state and federal agencies. Not only would the approval process be lengthy, but also there is no guarantee that the permit would be approved. Water taken from the Delta adjacent to the City is highly saline for at least part of the year and could require extensive treatment (reverse osmosis). The City of Antioch, upstream of the city of Pittsburg, uses water from the Sacramento River only from December to July or August because of water salinity issues. Thus, a year-round supply could be cost prohibitive due to treatment requirements, or the supply would be intermittent. Other possible supplemental sources of water include the tie-in to another major supplier, such as the East Bay Municipal Utility District (EBMUD), or to other local water districts. EBMUD's major transmission line passes through the City of Pittsburg. CCWD has recently completed an emergency intertie with EBMUD. Under the existing water regulations, EBMUD is precluded from providing water directly to Pittsburg. June
37 Neighboring communities that provide water service, such as the City of Antioch, are dependent upon CCWD, similar to the City of Pittsburg. The fact that Antioch can directly draw water from the Delta allows for augmentation of its CCWD source, but under a reduced supply scenario it would be unlikely that Antioch would be able to provide supplemental water to Pittsburg. Summary of Existing and Planned Sources of Water The City s water supplies include local groundwater, recycled water, and purchased surface water from CCWD. Groundwater is pumped from two wells in the central part of the City. Recycled water is produced by Delta Diablo from wastewater collected within its service area and delivered to the cities of Pittsburg and Antioch. Surface water and groundwater are both conveyed to the City s water treatment plant, treated, and then conveyed via the City s potable distribution system to its customers. Table 6-8 outlines the City s 2015 water supply. Water Supply Table 6-8: Water Supplies Actual (AFY) Additional Detail on Water Supply Actual Volume 2015 Water Quality Purchased or Imported Water Purchased from CCWD. 7,591 Drinking Water Groundwater Extracted from Pittsburg Plain Groundwater Basin. 1,180 Drinking Water Recycled Water Produced by Delta Diablo for the City of Pittsburg 6,657 Recycled Water Total 15,428 Table 6-9 presents the estimated projected water supply for the City of Pittsburg. CCWD can meet 100% of the City s projected demands (outlined in Table 4-2) for purchased water under normal year conditions. Available groundwater supply is not expected to change by 2040 and projected available recycled water supplies are based on the City s projected recycled water demands, which the existing Delta Diablo RWF can meet. Water Supply Purchased or Imported Water Additional Detail on Water Supply Table 6-9: Water Supplies Projected (AFY) Projected Water Supply Reasonably Available Volume Reasonably Available Volume Reasonably Available Volume Reasonably Available Volume Reasonably Available Volume 10,230 10,868 11,554 12,270 13,016 Groundwater 1,343 1,343 1,343 1,343 1,343 Recycled Water 6,757 6,757 6,757 6,757 6,757 Total 18,330 18,968 19,654 20,370 21,117 Notes: Purchased Water: Projected water supply provided by CCWD is based on water supply reliability provided by CCWD. CCWD estimates that it can meet 100% of the City s projected demands during normal years. Groundwater: Projected available groundwater supply is based on average groundwater extraction between 1993 and The maximum annual extraction in this period was 2,092 AF in Recycled Water: Projected available recycled water supply is based on 1the City s projected recycled water demand, which the existing Delta Diablo RWF can meet. June
38 Surface Water Climate Change Impacts to Supply Pittsburg s wholesale water supplier, CCWD, is dependent on surface water supplies from the Delta to meet the majority of the City s demand. Water supply from the Delta is already unreliable, and changes in seasonal runoff patterns from climate change are likely to lead to reduced water supply reliability. Changes in precipitation and temperature in the Sierra Nevada Region affect the timing and quantity of tributary flows. This affects the availability of fresh surface water for the Region. Contributing factors include a reduced Sierra snowpack, earlier snowmelt, and extended drought periods punctuated by intense precipitation events. Climate change could result in less storage in upstream CVP/State Water Project (SWP) reservoirs, which in turn could reduce flows into the Delta during the summer and fall. The availability of high-quality freshwater in the Delta is heavily dependent on the operation of CVP/SWP reservoirs; therefore, surface water supply for the Region could be affected by changes in snowpack and upstream reservoir operations. Finally, there is concern that the water supply intake at Mallard Slough could become threatened by climate change-related sea-level rise and would subsequently impact CCWD s ability to reliably deliver its supplies. Groundwater Pittsburg relies on groundwater, blended with surface water, to augment local water supply and increase reliability. Changes in local hydrology could affect natural recharge to the local groundwater aquifers and the quantity of groundwater that could be pumped sustainably over the long term. Decreased inflow from runoff, increased evaporative losses, and warmer and shorter winter seasons can alter natural recharge of groundwater. Furthermore, potential reductions in surface water availability in the Delta, as described above, could lead to more reliance on local groundwater. Increased reliance on groundwater, combined with reduced precipitation and longer, more frequent droughts, could result in groundwater overdraft and water quality impacts. Water Quality A changing climate will likely create challenges for the management of water quality in Pittsburg and affect supplies. Water quality challenges in the Delta and the Pittsburg Plain Groundwater Basin could be exacerbated by climate change. According to the ECCC IRWM Plan Update, these water quality problems include, but are not limited to: Increased salinity in both the groundwater and near-surface water intakes caused by rising sea levels. Increased turbidity and pollutant concentrations, transported by mobilized sediment and caused by higher river and stream flows from increased storm events. In addition, disinfectant byproduct precursors tend to spike during storm events. Higher concentrations of contaminants during droughts, and lower dissolved oxygen (DO) concentrations caused by decreasing precipitation. Increased levels of chloride, bromide, and total organic carbon in Delta water caused by Delta levee failure. Delta levee failure is considered to be at increased risk under climate change conditions. Higher concentrations of bromate in surface waters due to sea level rise and reduced freshwater flows. More algal blooms events from warmer temperatures associated with climate change causing increased taste and odor issues. June
39 Water Supply Reliability Assessment This chapter describes the overall reliability of the City of Pittsburg s water supplies, including water quality characteristics and contingency planning under drought conditions. Constraints on Water Sources This section discusses the reliability of the City s water supplies with respect to water quality and service reliability. Surface water, groundwater, and recycled water quality and service reliability are each discussed in the following sections. While there are water quality challenges associated with each source, the City, CCWD, and Delta Diablo are taking steps to address these challenges and the City does not anticipate decreases in water supply over the UWMP planning horizon due to water quality concerns Surface Water Water Quality The City s primary wholesale water supplier, CCWD, is almost entirely dependent on the Delta for its water supply. The quality in the Delta is deteriorating, despite efforts to improve it. Delta water quality problems are being compounded by increased water use and greater wastewater, storm water and agricultural discharges from statewide development and growth. Unforeseeable or non-quantifiable environmental problems, such as Delta levee failure or sea-level rise, could potentially alter the Region s water supply characteristics and adversely impact service and water quality reliability. A number of projects and programs are being developed, or are in place, to address Delta water quality degradation at the statewide level and through local and regional projects. To ensure that CCWD can meet the increasingly more stringent water quality standards and provide high quality water for its customers, including the City of Pittsburg, CCWD has initiated or is participating in a number of water quality improvement projects. These projects include the following: Middle River Intake (Alternative Intake Project) relocates a portion of CCWD s diversions to a Delta location with higher water quality. Project began operation in July Contra Costa Canal Replacement Project - consists of lining or encasement of approximately four miles of the Contra Costa Canal from the Rock Slough Intake to Pumping Plant No. 1 to hydraulically isolate it from high saline groundwater. Phase 1 was completed in EBMUD-CCWD Intertie - In 2007, the EBMUD-CCWD untreated water interconnection was completed, which connected CCWD s Los Vaqueros Pipeline and the EBMUD s Mokelumne Aqueduct in Brentwood. The intertie enables CCWD to divert up to 3,200 acre-feet per year of its CVP supply at the Freeport diversion facility where water quality is better than at CCWD s Delta Intakes. Los Vaqueros Reservoir Expansion Project Los Vaqueros Reservoir expanded from 100,000 AF to 160,000 AF to provide water supply reliability and water quality benefits. More specific project details can be found in CCWD s 2015 UWMP. Water quality impacts to the CCWD s supply reliability have been considered in the development of projected supplies for the City of Pittsburg. Service Reliability In conformance with CWC Division 5, Part 2.6, Section 10635, CCWD prepared an assessment of its water supply reliability. This analysis was provided to all wholesale municipal customers of CCWD for use in the preparation of their UWMPs. The water supply reliability goal adopted by CCWD s Board of Directors is to meet at least 85% of demand during drought conditions and 100% of demand in normal years. The remaining 15% of demands during June
40 drought conditions would be met by a combination of short-term water purchases and a voluntary shortterm conservation program. The projected water supplies from CCWD are not anticipated to incur supply deficits in normal years due to CCWD s long-term conservation program, existing CVP contract supply, and long-term water transfer agreement with East Contra Costa Irrigation District (ECCID). CCWD entered into an agreement with the ECCID in 2000 to purchase surplus irrigation water from ECCID s service area. CCWD s currently available and planned supplies are sufficient to meet their reliability goals and estimated water demands during normal, single dry and the first two years of a multi-year drought. In later years, several types of drought conditions may result in supply shortfalls. Supply reliability tables provided by CCWD are included in Appendix F. The maximum amount of short-term conservation expected to be necessary by CCWD is 15% of supply. If current drought conditions continue and statewide conservation measures remain in effect, CCWD anticipates that it could meet up to 75% of the City s demands over the next three years Groundwater Water Quality The City obtains approximately 10% to 15% of its water supply from two City-owned wells, the Rossmoor and Bodega wells. Water from these wells can be high in manganese, iron and dissolved solids. Total dissolved solids (TDS) in the Rossmoor Well have been recorded at concentrations of 1,100 mg/l. A maximum concentration of 500 mg/l is recommended for secondary water quality standards (water aesthetics). However, because the water produced from these wells undergoes blending and complete conventional treatment at the City s Water Treatment Plant, the TDS levels are reduced to below the secondary standard. The City conducts regular tests of the water pumped from these two wells in compliance with State of California water quality standards (Administrative Code, Title 22) to make sure that the utilization of this water source is consistent with applicable State water standards. Service Reliability The Bodega well came online in 2010 to replace the Ballpark well, which was frequently shut down for repairs and poor water quality. The City s groundwater supply has proven to be very consistent through variable climatic conditions. There has been no change in groundwater levels reported by DWR in this area as a result of the City s use of the groundwater basin. The City has implemented groundwater monitoring to evaluate groundwater level trends over time to ensure that overdraft conditions (potentially resulting in seawater intrusion) do not occur Recycled Water Water Quality The City s recycled water supply comes from Delta Diablo s RWF. The RWF ensures a consistent water quality standard is met for the City s recycled water supply through compliance with Title 22 standards. Service Reliability Recycled water from Delta Diablo has been a highly reliable and essentially a drought-proof supply. Production capacity at the RWF is affected by the facility s permitted capacity of 12.8 MGD, the use patterns of recycled water customers, Delta Diablo s wastewater treatment plant influent diurnal flow pattern, influent average dry weather flow, and storage/equalization capacity at the RWF. Delta Diablo continues to assess these factors through various measures to ensure the continued reliability of the supply and increase the potential for future recycled water use. June
41 7.1.4 Reliability Factors CWC Section 10631(c)(2) requires water suppliers to describe plans to supplement or replace sources that may not be available at a consistent level of use. As a result of the relative consistency of the City s water supplies, there are no plans at this time to replace or supplement any of the City s supply sources with alternative sources. Table 7-1a summarizes the factors that have the potential to affect the consistency of the City s supply. By continuing to use a combination of groundwater and recycled water, in addition to wholesale supplies from CCWD, the City is making maximum use of its existing resources and minimizing the need to import water from other regions. Table 7-1a: Factors Resulting in Inconsistencies in Supply Water Supply Sources Surface Water - CCWD Wholesale Delta Supply Groundwater - City Wells Recycled Water - Delta Diablo Limitation Quantification Environmental Water Quality Climatic Up to 15% Pumping from reduction Delta can be during dry limited at times years due to fisheries concerns. None anticipated None anticipated None anticipated None anticipated Delta water can be subject to seawater intrusion, high total organic carbon (TOC), and other water quality challenges. Levee failures can also cause water quality problems High TDS and manganese None anticipated Surface supply from the Delta is subject to reductions in dry years and is affected by climate change. Changes in climate could affect natural recharge to the groundwater aquifers. None anticipated Additional Information CCWD manages these challenges using Los Vaqueros Reservoir, which provides water quality and emergency supply reliability The Bodega well replaced the Ballpark well to ensure a more consistent, lower TDS supply of well water. City has an ongoing groundwater monitoring program. The amount of recycled water available to the City is consistent and may increase in the future as water and sewer connections increase. June
42 Reliability by Type of Year CWC Section (c)(1) requires water suppliers to consider supply conditions during an average water year, a single dry water year, and multiple dry water years. This section identifies the historical water years that meet these conditions for drought planning purposes. Consistent with CCWD s water supply analyses, the basis of water year data presented in this section is as follows: Normal (Average) represents a below normal or wetter year on the Sacramento River Hydrologic Region Water Supply Index. Normal year reflects 2004 conditions. Single-year drought reflects 1977 conditions. Multiple-year drought sequence reflects conditions. Table 7-1 summarizes the water supply conditions for the City of Pittsburg s CCWD raw water supply under the conditions described above. Table 7-1: Bases of Water Year Data Year Type Base Year % of avg supply Average Year % Single-Dry Year % Multiple-Dry Years 1st Year % Multiple-Dry Years 2nd Year % - 100% Multiple-Dry Years 3rd Year % - 90% The City has chosen not to complete Table 7-1 for its recycled water and groundwater supplies. Recycled water is considered to be drought-proof and the City s groundwater wells, installed in 1994 and 2010, have not seen production impacted by drought conditions. For the remainder of this chapter, recycled water and groundwater supplies are assumed to stay 100% available during drought conditions (both single and multiple dry years). The City experienced multi-year drought conditions in , , and again in 2013 to the present. Water conservation strategies implemented by the City in partnership with CCWD, during the latest set of multi-year drought conditions, resulted in a reduction in per capita water usage. Based on experiences during the previous drought periods, the City recognizes that it is better to enter into a water shortage alert early, at a minimal level, to establish necessary rationing programs and policies, to gain public support and participation, and to reduce the likelihood of more severe shortage levels later. As the community continues to become more water efficient, it may become more difficult for customers to reduce their water use during water shortages (this is called demand hardening ). Staff does not believe that City customers are yet approaching demand hardening, because there are still potential water efficiency improvements in residential plumbing fixtures, appliances, and landscapes, and in the commercial, industrial, and institutional sectors that have yet to be implemented. However, improved water use efficiency does mean that water supply reserves must be larger and that water shortage responses must be made early to prevent severe economic and environmental impacts. Supply and Demand Assessment For the City s water supply assessment, raw water provided through the Contra Costa Canal, recycled water provided by Delta Diablo and groundwater extracted from the City s two municipal wells were considered. For more information on demand projections used for the demand assessment, please refer to Section4.1, June
43 Projected available groundwater supply is based on average groundwater extraction between 1993 and Projected available recycled water supply is based on Pittsburg s projected recycled water demands, which the existing Delta Diablo RWF can meet. Projected raw water supply is based on percentage of City s total potable water demand CCWD can meet. Table 7-2 compares total supply available in a normal year to projected demand totals, with the difference showing a projected surplus of supply in all normal years during the planning horizon of this UWMP. Table 7-2: Normal Year Supply and Demand Comparison (AFY) Supply totals 18,330 18,968 19,654 20,370 21,117 Demand totals 16,987 17,625 18,311 19,027 19,774 Difference 1,343 1,343 1,343 1,343 1,343 Table 7-3 compares total supply available in a dry year to projected demand totals, with the difference showing a projected surplus of supply in all single dry years during the planning horizon of this UWMP. Table 7-3: Single Dry Year Supply and Demand Comparison (AFY) Supply totals 18,330 18,968 19,654 20,370 21,117 Demand totals 16,987 17,625 18,311 19,027 19,774 Difference 1,343 1,343 1,343 1,343 1,343 Table 7-4 compares total supply available in multiple dry years to projected demand totals. The third year of the multiple dry year period in 2035 and 2040 is the first time the City can expect to see a supply deficit, according to the demand and supply projections and the assumptions developed to formulate these projections. For the analysis, groundwater supply has been assumed to be at the average 1,343 AFY of groundwater extraction between 1993 and 2015, as noted in Table 6-9. However, the maximum annual extraction in this period was 2,092 AF in 2008, so additional groundwater extraction could be used to account for supply deficits in multiple dry years, as necessary. In addition, as discussed in Section 4.1, the GPCD used for the demand projections is based on a rebound from drought restrictions and the economic recession, and future projections do not account for potential decreases in demand resulting from increased savings from passive conservation (that is, the future projections do not account for future increases in the use of water-saving appliances). The City and CCWD have demonstrated in recent years that, during extended dry periods, they can address deficits by reducing demand in their service areas. June
44 Table 7-4: Multiple Dry Years Supply and Demand Comparison (AFY) Supply totals 18,330 18,968 19,654 20,370 21,117 First year Second year Demand totals 16,987 17,625 18,311 19,027 19,774 Difference 1,343 1,343 1,343 1,343 1,343 Supply totals 18,330 18,968 19,654 20,125 20,336 Demand totals 16,987 17,625 18,311 19,027 19,774 Difference 1,343 1,343 1,343 1, Supply totals 17,307 17,881 18,499 18,898 19,164 Third year Demand totals 16,987 17,625 18,311 19,027 19,774 Difference Regional Supply Reliability The City continues to evaluate supply enhancement options, including additional water recycling, conjunctive use, water transfers, and additional imported water supplies through its participation in the ECWMA and collaboration with CCWD. June
45 Water Shortage Contingency Planning Stages of Action The City has developed a four stage rationing plan for implementation during declared water shortages. The rationing plan includes voluntary and mandatory rationing, depending on the causes, severity, and anticipated duration of the water supply shortage. As the retail water purveyor, the City of Pittsburg must provide the minimum health and safety water needs of the community at all times. The water shortage response is designed to provide a minimum of 50% of normal supply during a severe or extended water shortage. Rationing stages may be triggered by a shortage in one water source or a combination of sources. Although an actual shortage may occur at any time during the year, a shortage (if one occurs) can usually be forecasted by the City and/or CCWD by April 1 st of each year. Rationing stages may be triggered by a supply shortage, a natural disaster (e.g., canal failure due to earthquake) or by contamination in one source or a combination of sources. In the worst-case scenario of a 50% reduction of water supplies, the City, in coordination with CCWD, would resolve any potential supply shortfalls through a combination of a short-term conservation program and/or short-term water purchases. Table 8-1 outlines the four stages of water shortage contingency planning in the City of Pittsburg. Table 8-1: Stages of Water Shortage Contingency Planning Stage Percent Supply Reduction Water Supply Condition I Up to 10% Water Alert II 11-20% Water Warning III 21-35% Water Emergency IV 36-50% Water Crisis During Stages I and II, rationing is voluntary, while during Stages III and IV, rationing is mandatory. During Stages I, II, III, and IV, customer water use reduction goals would up to 10%, 11-20%, 21-35%, and 36-50%, respectively. Under normal water supply conditions, potable water production figures are recorded daily at the City s Water Treatment Plant. Totals are reported monthly to the City s Finance Department and the Water Utility Director and incorporated into a water supply report. During a Stage III water shortage, daily production figures are reported to the Water Treatment Plant Supervisor. He/she compares the weekly production to the target weekly production to verify that the reduction goal is being met. Weekly reports are then forwarded to the Water Shortage Response Team (currently consisting of Water Utility Director, Chair and representatives from the Water Treatment Plant, Water Line Maintenance, and Community Development and Finance Departments) and to the City Manager. If reduction goals are not met, the City Manager is notified so that additional actions may be considered by the City Council to address the water shortage. During a Stage IV water shortage, the procedure listed above is followed, if necessary, with the addition of a daily production report to the City Manager. During emergency shortages, production figures are reported to the Chair hourly and to the Water Shortage Response Team daily. Daily reports may also be provided to the City Manager. Prohibition on End Uses The City s Municipal Code includes mandatory prohibitions on the waste of water. The Water Conservation Resolution, adopted by the City in 2015, includes additional prohibitions on non-essential uses of water. In June
46 addition, the City would consider additional prohibitions, as appropriate, given the water shortage situation. Water restrictions and prohibitions in the City of Pittsburg are summarized in Table 8-2. Stage I restrictions against water waste are mandatory; Stage II includes additional mandatory restrictions, and Stages III and IV are mandatory prohibitions. Table 8-2: Restrictions and Prohibitions on End Users Stage Restrictions and Prohibitions to End Users Additional Explanation or Reference (optional) Penalty, Charge, or Other Enforcement? All Stages II III All Stages All Stages All Stages All Stages All Stages All Stages Landscape - Limit landscape irrigation to specific times Landscape - Limit landscape irrigation to specific days Landscape - Limit landscape irrigation to specific days Landscape - Prohibit certain types of landscape irrigation Landscape - Other landscape restriction or prohibition Water Features - Restrict water use for decorative water features, such as fountains Other - Customers must repair leaks, breaks, and malfunctions in a timely manner Other - Require automatic shut off hoses Other - Prohibit use of potable water for washing hard surfaces Irrigation between 11 am and 6 pm is discouraged. Irrigation watering limited to three days per week, unless controlled by a CIMISconnected water controller, and verified by City. Irrigation watering limited to two days per week., unless controlled by a CIMISconnected water controller, and verified by City. Irrigating landscaped areas with water in excess of that minimal amount required to sustain plant life. The application of potable water to outdoor landscapes during and up to within 48 hours after measurable rainfall. The use of water for decorative fountain/pools, except for recycled water approved for such use. Failing to repair a controllable leak of water. Using a hose without an automatic shutoff nozzle. Washing sidewalks, driveways, parking areas, tennis courts, patios, or other exterior paved areas except to alleviate a condition inimical to the public health or safety. No Yes. Municipal Water Code violation penalty - $100 for first, $200 for second, and $300 for third violation within one year. Yes. Municipal Water Code violation penalty - $100 for first, $200 for second, and $300 for third violation within one year. Yes. Municipal Water Code violation penalty - $100 for first, $200 for second, and $300 for third violation within one year. Yes. Municipal Water Code violation penalty - $100 for first, $200 for second, and $300 for third violation within one year. Yes. Municipal Water Code violation penalty - $100 for first, $200 for second, and $300 for third violation within one year. Yes. Municipal Water Code violation penalty - $100 for first, $200 for second and $300 for third violation within one year. Yes. Municipal Water Code violation penalty - $100 for first, $200 for second, and $300 for third violation within one year. Yes. Municipal Water Code violation penalty - $100 for first, $200 for second, and $300 for third violation within one year. June
47 Stage Restrictions and Prohibitions to End Users Additional Explanation or Reference (optional) Penalty, Charge, or Other Enforcement? All Stages Other Permitting water to flow onto a sidewalk, driveway or street, or escape down a gutter, ditch or other service drain. Yes. Municipal Water Code violation penalty - $100 for first, $200 for second and $300 for third violation within one year. Penalties, Charges, Other Enforcement of Prohibitions Any customer violating the regulations and restrictions on water use, under conditions of mandatory rationing, shall receive a written warning for the first such violation. A second violation, and each one thereafter shall constitute a misdemeanor and may be referred to the Contra Costa County District Attorney s office for prosecution pursuant. All Municipal Water Code violations incur a penalty of $100 for the first violation, $200 for second violation and $300 for the third violation within one year. In 2015, in response to the emergency regulations adopted by SWRCB requiring the City to reduce its total water use by 20%, the City adopted Resolution No , establishing a water conservation program, increases to water rates, and necessary restrictions including penalties for excessive use. Water rates for single family residential customers went up to $0.10 per one hundred cubic feet of water (CCF) for the first 8 CCF and to $0.20 per CCF beyond that. Water rates for all other users increases to $0.20 per CCF, regardless of monthly usage. The penalties include punitive action for single family residential customers that use more than 800 gallons per day (which is 32 CCF per billing period) resulting in an excessive use penalty of $25.00 per billing period; single family residential customers that use more than 1,000 gallons per day (which is 40 CCF per billing period) are charged an excessive use penalty of $50.00 per billing period; single family residential customers that use more than 1,250 gallons per day (which is 50 CCF per billing period) are charged an excessive use penalty of $ per billing period; and single family residential customers that use more than 1,500 gallons per day (which is 60 CCF per billing period) are charged an excessive use penalty of $ per billing period. Consumption Reduction Methods The City s contingency planning for a water shortage includes prohibitions on various wasteful and nonessential water uses, such as lawn watering during mid-day hours, washing sidewalks and driveways with potable water, and allowing plumbing leaks to go uncorrected. Table 8-3 outlines the reduction methods that the City implements during the water shortage stages. June
48 Stage Table 8-3: Stages of WSCP - Consumption Reduction Methods Consumption Reduction Methods by Water Supplier Additional Explanation or Reference (optional) All Stages Expand Public Information Campaign Education program. All Stages All Stages All Stages All Stages II, III, IV Offer Water Use Surveys Provide Rebates on Plumbing Fixtures and Devices Provide Rebates for Landscape Irrigation Efficiency Provide Rebates for Turf Replacement Decrease Line Flushing City currently providing water use surveys to 112 irrigators, and CCWD is offering free surveys to residential customers. CCWD provides rebates for efficient plumbing fixtures and devices in Pittsburg. CCWD provides rebates for CIMIScontrolled irrigation systems. CCWD provides rebates for lawn replacements in Pittsburg. II, III, IV Reduce System Water Loss II, III, IV IV II, III, IV Increase Water Waste Patrols Moratorium or Net Zero Demand Increase on New Connections Implement or Modify Drought Rate Structure or Surcharge Water rate increases All Stages Other Demand reduction program All Stages Other Use prohibitions I Other Voluntary Rationing III, IV Other Percentage reduction by customer type, and/or high use penalties IV Other Restrict building permits III, IV Other Mandatory rationing IV Other Per capita allotment by customer type III,IV Other Nonessential use of water prohibited Determining Water Shortage Reductions CWC Section (h,i) requires that the Urban Water Shortage Contingency Plan include a mechanism for determining actual reductions in water use. The City maintains 100% metered accounts; reductions in water use for each user can be determined based on meter readings. In the event of a water shortage, the City will monitor its production meters more frequently for changes in the volumes of water produced at the City s wells and water treatment plant. The City will also monitor water delivered to individual metered service connections for changes in delivered water. Revenue and Expenditure Impacts The City has procedures outlined for the raising of water rates, depending on the City s available reserve fund, as a disincentive against the overuse of water when the water shortage represents a Stage II event. Additional consideration concerning the establishment of water rates to address the revenue shortfall of diminished use will be addressed by the City Council, as necessary, to meet any continuing water shortage June
49 emergency. Decreased water sales during a water shortage could affect the City s ability to fund capital replacement at the level that is necessary to maintain the water system s reliability. Resolution or Ordinance CWC Section 10632(h) requires the inclusion of a draft water shortage contingency resolution in an UWMP. In 2015, the City passed Resolution Water Conservation Program and 2010 Urban Water Management Plan in response to ongoing drought conditions experienced in the State and a request from CCWD to reduce water use by 15%. This resolution defines prohibited non-essential uses and outlines the four water shortage stages and their respective customer reduction goals. In addition, the City passed Resolution Increase Water Rates and Establish Penalties for High Water Use in response to the State s emergency regulations requiring the City to reduce its total water use by 20% for the months of June 2015 through February This resolution defines tiered water rates for residential customers and a flat rate for all other customers, as well as the penalties for excessive use. Both resolutions can be found in Appendix E. Catastrophic Supply Interruption Plan CWC Section 10632(c) requires actions to be undertaken by the water supplier to prepare for, and implement during, a catastrophic interruption of water supplies. A catastrophic event that constitutes a proclamation of a water shortage would be any event, either natural or manmade, that causes a severe shortage of water. Water shortages may result from variations in weather, natural disasters, or unanticipated situations such as systems failures or acts of terrorism. The City has developed its contingency planning in partnership with CCWD. During water shortages, CCWD manages its water supply to ensure it meets the demands of its member agencies. In the event of a supply emergency, the City would increase media attention to the water supply situation during a shortage and increase public water education programs, encouraging property owners to apply for a landscape and interior water use survey, and continue to advertise the importance of customers installing ultra-low flow (ULF) plumbing fixtures. If an earthquake or other form of disaster were to damage the Contra Costa Canal or disrupt the delivery of raw water, the City would utilize: (1) the local groundwater aquifer as a raw water supply, and (2) emergency interties to the City of Antioch and the two interties to CCWD s Multipurpose Pipeline as treated water supplies within the limitations of these sources. Neighboring communities that provide water service, such as the City of Antioch, are as dependent upon CCWD, similar to the City of Pittsburg. The fact that Antioch can directly draw water from the Delta allows for them to augment their CCWD source, but under a reduced supply scenario, it would be unlikely that Antioch would be able to provide supplemental water to Pittsburg. The City s Water System participated in the Seismic and Reliability Improvements Project to evaluate emergency measures for a disruption in water supply. Under those circumstances, the availability of uncontaminated groundwater will be crucial to the City's ability to respond to an extended reduction in surface water supplies. During declared shortages, or when a shortage declaration appears imminent, the City Manager or his/her designee, who serves as chair, activates a City Water Shortage Response Team. The team includes: water, engineering, finance, emergency services, public affairs, and parks and recreation representatives. This team would coordinate its activities with the City Manager s Office, the Contra Costa Consolidated Fire Department, and CCWD. Additional action items that may be pursued in preparing for and responding to a catastrophic water supply interruption could include: Determine what constitutes a proclamation of a water shortage. Stretch existing water storage. June
50 Obtain additional water supplies through short-term water purchases, exchanges or transfers. Develop alternative water supplies. Determine funding for additional and/or alternative water supplies. Contact and coordinate with other agencies. Create an Emergency Response Team/Coordinator. Create a catastrophe preparedness plan. Put employees/contractors on-call. Implement methods to communicate with the public. Plans would be developed to individually meet the needs of each situation. Minimum Supply Next Three Years CWC Section (a)(2) requires an estimate of the minimum annual water supply available during each of the next three water years based on the driest three-year historical sequence for the agency s water supply. The majority of the City s water supply (roughly 85%) is provided by CCWD and subject to reductions under drought conditions. The City s groundwater supply is roughly 10-15% of the City s overall water supply, and recycled water provided by Delta Diablo makes up the remainder. Based on reliability data provided by CCWD, the City s water reliability under multiple dry years in the near term is summarized in Table 8-4. Because groundwater and recycled water are not as susceptible to short-term climatic changes as surface water, the reliability of the groundwater and recycled water supplies over the next three years is assumed to be 100%. CCWD has indicated that 75% of total potable water demand can be met over the next three years with their raw water supply to the City. Table 8-4: Minimum Supply Next Three Years Available Water Supply 17,252 17,544 17,835 June
51 Demand Management Measures This chapter presents a detailed analysis of the Demand Management Measures (DMMs) contained in the updated UWMP Act. A DMM, also known as a Best Management Practice (BMP), is a program designed to maximize the efficient use of water and minimize water waste. This chapter includes a comprehensive description of each DMM identified in the UWMP Guidebook. Also, for each DMM, implementation over the past five years and planned future implementation to achieve water use targets is discussed. The City has, in good faith, attempted to implement and comply with all of the DMMs listed in the 2015 UWMP Guidebook Overview The City of Pittsburg is signatory to the Memorandum of Understanding (MOU) regarding Urban Water Conservation in California and is therefore a member of the California Urban Water Conservation Council (CUWCC). The City collaborates with CCWD in providing various water conservation programs to the Pittsburg community. As a wholesaler, CCWD develops and implements a regional conservation program on behalf of its retail water agencies and their customers. This regional approach enables economies of scale, ensures a consistent message to the public, and assists in the acquisition of grant funding for program implementation. CCWD s Water Conservation Program is designed to achieve reductions in long-term water demand in an environmentally responsible and cost-effective manner. The long-term baseline water savings goal for the Conservation Program is to reduce CCWD-wide demand by approximately 15,200 AF by the year 2060, which is consistent with CCWD s 2015 Future Water Supply Study. The long-term maximum water savings goal for the Conservation Program is to reduce CCWD-wide demand by approximately 32,300 AF by the year Since CCWD started its Water Conservation Program in 1988, the program has evolved considerably. In its early years, the program consisted of single family surveys and showerhead distribution. Starting in 1994, CCWD provided rebates for Ultra Low Flow Toilets (ULFTs) which use 1.6 gallons per flush, and then in 2007, the program was replaced with a High Efficiency Toilet (HET) Rebate Program for toilets that use 1.28 gallons per flush. In 2000, CCWD initiated a successful High Efficiency Clothes Washer Rebate program. The Conservation Program also includes surveys for all customer classes and incentive programs for numerous devices. Both surveys and rebate programs have changed over the years to increase the effectiveness of the program and the sustainability of water savings, and are available throughout the CCWD wholesale and retail service areas. Additionally, in 2009 and currently in 2015, the District implemented a Drought Management Program, which further reduced water consumption by over 20% in recent years. The City s BMP reports and conservation efforts, in collaboration with CCWD, are summarized below for each DMM. These conservation measures are also summarized in Table 8-2 and Table Water Waste Prevention Ordinances The City s Water Waste Prohibition program is on-going. The City s Municipal Code includes mandatory prohibitions on the waste of water including: Permitting water to flow onto a sidewalk, driveway or street, or escape down a gutter, ditch or other service drain. Irrigating landscaped areas with water in excess of the minimal amount required to sustain plant life, as determined by a staff water audit. Failing to repair a controllable leak of water. June
52 Implementation over the Past Five Years Over the past five years, the City has enforced the mandatory prohibitions in its Municipal Code, as summarized in Table 8-2. Most recently, it adopted the Water Conservation Resolution which includes additional prohibitions on non-essential uses of water, including: Washing sidewalks, driveways, parking areas, tennis courts, patios, or other exterior paved areas except to alleviate a condition inimical to the public health or safety. The use of water for decorative fountain/pools, except for recycled water approved for such use. Using a hose without an automatic shutoff nozzle. Outside watering with City-furnished water that results in excessive flooding or runoff into a gutter, drain, walkway or street. Irrigation between 11 am and 6 pm is discouraged. The application of potable water to outdoor landscapes during and up to within 48 hours after measurable rainfall. The serving of drinking water, other than upon request, in eating or drinking establishments, including but not limited to restaurants, hotels, cafes, cafeterias, bars, or other public places where food or drink are served and/or purchased. Additionally, to promote water conservation, operators of hotels and motels are to provide guests with the option of choosing not to have towels and linens laundered daily. The hotels or motels are required to prominently display notice of this option in each guestroom using clear and easily understood language. Planned Implementation to Achieve Water Use Targets The City plans to continue its Water Waste Prohibition program and enforce the more stringent prohibitions established in its 2015 resolution Metering The City has continued to meter all new connections and maintains a 100% coverage of metered accounts throughout its service area. Implementation over the Past Five Years Over the past five years, the City has become fully metered. In addition, automatic meter reading has been implemented across several connections in Pittsburg. As of August 2015, 100% of the City s connections are metered. The City s new service connections are billed volumetrically with meters. As of August February 2016, 8,150 out of 18,200 connections have automatic meter reading. Planned Implementation to Achieve Water Use Targets The City plans to continue metering all new connections and installing automatic meter readers at existing and new connections Conservation Pricing The City has implemented conservation pricing for residential customers and Commercial, Industrial and Institutional (CII) accounts. The City has a tiered rate structure for single family residential customers. Implementation over the Past Five Years In June 2015, in response to the emergency regulations adopted by SWRCB, the City adopted Resolution increasing the water rates for residential customers. For single family residential customers, rates were increased by $0.10 per CCF up to 8 CCF and by $0.20 per CCF for any water usage in excess of 8 June
53 CCF. For all other water users, rates were increased by $0.20 per CCF regardless of usage. Excessive water use penalties include punitive action for single family residential customers. These penalties are outlined in Section 8.3. Planned Implementation to Achieve Water Use Targets The City plans to continue conservation pricing for residential customers and CII accounts Public education and outreach Public education and outreach includes the School Education Program, which was developed in partnership with CCWD s Water Education Program (WEP). The goal of WEP is to teach children the importance of water in our lives. CCWD s WEP educates service-area school students about CCWD s mission to deliver clean, safe water in an environmentally responsible manner. Each year, CCWD s WEP reaches more than 30,000 service-area students and teachers. All of the programs promote and reinforce the following goals: recognizing activities that could affect water quality; understanding the connection between health and water quality; understanding the biodiversity of a watershed; and the importance of water conservation. The City has also developed a Public Information Program in partnership with CCWD. The CCWD Public Affairs Department coordinates with the City Water Utilities Department to promote water conservation messages and programs through a variety of media. Publications, website pages, presentations, booths at community events, direct mail pieces, newsletters, newspaper ads, and water education programs are all tools used to promote water conservation. The City has developed its Conservation Program for CII customers in partnership with CCWD. The CII survey program targets a variety of CII customers. Individual water-using devices are inspected, and customers receive a detailed report listing improvements that can be made to the equipment and to the maintenance of that equipment. Rebates are offered as an incentive to upgrade to more efficient equipment. For those devices for which CCWD does not have a specific rebate, they valuate the savings and provide rebates on a case by case basis. Additionally, in partnership with CCWD, the City is conducting an indoor and outdoor water use survey program that targets both single family and multi-family residential areas. Rebates for water-efficient appliances, such as efficient showerheads, aerators, washers and high efficiency toilets, are offered as an incentive to upgrade to more efficient equipment. Implementation over the Past Five Years Over the past five years the City has provided a periodic water conservation newsletter in addition to hosting booths at local community events. CCWD has conducted 565 residential surveys and 28 CII audits in Pittsburg over the past five years, educating families and business on opportunities for efficient water use. Planned Implementation to Achieve Water Use Targets The City plans to continue its public education and outreach programs at the same level it has over the past five years Programs to assess and manage distribution system real loss The California Legislature has passed a requirement, beginning October 1, 2017, that all retail urban water suppliers must file annually a completed and validated water loss audit. The water audits will be posted online for public viewing. The City has implemented a Water Audit program and plans on continuing this program in the future. The components of the water system audit program include a pre-screening system audit and an active replacement program for leak-prone polybutylene water pipes. Implementation over the Past Five Years The City has been completing AWWA Water Loss Audit Reports since In 2014, Pittsburg experienced 264 AF in water losses and received an AWWA Water Loss Audit Report validity score of 66 June
54 out of 100. In 2015, Pittsburg experienced 1,033 AF in water losses and received an AWWA Water Loss Audit Report validity score of 76 out of 100. Planned Implementation to Achieve Water Use Targets The City plans to continue the water loss audit program Water conservation program coordination and staffing support The City s water conservation coordination is conducted by the Water Utility Director and the City s Administrative Officer. Support is provided by the CCWD Regional Conservation Program. Implementation over the Past Five Years The coordinator s position has been active at the City since 1995 as a shared part-time responsibility between the City s Water Utility Director, Walter Pease (wpease@ci.pittsburg.ca.us), and the City s Administrative Officer, Laura Wright (lwright@ci.pittsburg.ca.us). The majority of the funding for these duties is through CCWD s program and is included in the raw water rates. Chris Dundon (cdundon@ccwater.com) is currently the Water Conservation Coordinator at CCWD. Planned Implementation to Achieve Water Use Targets The City plans to keep the part-time responsibilities of the water conservation coordinators active. CCWD also plans to continue its Regional Conservation Program and maintaining the Water Conservation Coordinator position, available to CCWD and its retail agencies. The City will be continuing to coordinate its water conservation coordination responsibilities with CCWD Other Demand Management Measures The City s program for residential plumbing retrofits has been established in partnership with CCWD. Since 1988, CCWD has been distributing and installing 2.5 gallons per minute (gpm) showerheads to single family and multi-family customers. In 2005, CCWD increased water savings by providing 2.0 gpm showerheads. CCWD continues to test the flow rate of all showerheads at residential surveys and provides 2.0 gpm showerheads as necessary. In addition, CCWD provides faucet aerators to single and multi-family residences. The City s program for high-efficiency washing machine rebates has been established in partnership with CCWD. CCWD initiated a rebate program in 1999 by providing a $75 rebate for high-efficiency clothes washers. Three years later in 2002, CCWD coordinated with other Bay Area water agencies to implement a Bay Area Regional Clothes Washer Rebate Program and hired Electric Gas Industries Association (EGIA) to administer the program, providing a rebate of up to $100 until Appliance dealers throughout the Bay Area provided the same rebate application, making the program easier for salespeople and customers to understand. Then in 2008, the Bay Area water agencies contracted with Pacific Gas & Electric (PG&E) to administer the rebates. This had the added benefit of allowing customers to fill out a single application and to receive both the water agency and PG&E rebate in a single rebate check. CCWD customers received a combined rebate of up to $200. In 2010, the combined rebate was reduced to $100. This change had little effect on participation, improving the overall program s cost effectiveness. The City has also developed a high efficiency toilet (HET) replacement program in partnership with CCWD. CCWD offers customers two ways to receive a rebate for purchasing a qualified WaterSense Certified HETs. Customers can apply for a voucher that will enable them to receive an instant rebate of up to $175 when they purchase a qualifying HET at one of CCWD s participating vendors. Alternatively, customers can apply for a traditional rebate application which allows them to purchase a qualifying HET at any plumbing supplier and then mail in their rebate application to be processed by CCWD. Rebates are provided for all customer classes. June
55 In 2008 the City initiated the installation of a CIMIS-controlled irritation system for 32 landscaped sites that use potable water. These sites represent 67.6 acres (45%) of the acres that are still irrigated by the City using potable water, and over 10% of the irrigation accounts in the City. Additionally, the City s efforts in converting City-owned parks and landscaped areas from potable water to recycled water is ongoing. The City is also converting soccer fields from grass to artificial turf. All City irrigation accounts have automatic meter readings, which allows the City to identify irrigation leaks in a timely manner. In 2015 the City started a water use budgeting program for 112 irrigation accounts, which compares actual water use and what the use should have been based on ETo, and provides a monthly report for the current month and for the past 12 months and 36 months. Implementation over the Past Five Years Over the past five years, CCWD has provided 496 low flow showerheads and 465 faucet aerators in the City of Pittsburg. In addition, CCWD has provided 1,734 washer rebates in Pittsburg since 2010 and 1,856 HET rebates. Finally, CCWD Landscape Rebate Program (LRP) has provided rebates to 50 single family homes in Pittsburg since Planned Implementation to Achieve Water Use Targets CCWD plans to continue its rebate program for domestic water efficient devices and for CIMIS-controlled irrigation systems. June
56 Plan Adoption Submittal and Implementation Inclusion of All 2015 Data The water data provided herein is on a fiscal year basis, extending from July 1, 2014 through June 30, For the purposes of this 2015 UWMP, this document includes all the City s 2015 data. Notice of Public Hearing Contra Costa County, CCWD, and Delta Diablo were notified on September 22, 2015 that the City was amending its 2010 UWMP and preparing a draft 2015 UWMP. The City Council held a public hearing on May 16, 2016 and notified Contra Costa County, CCWD, and Delta Diablo of the location where the draft 2015 UWMP could be viewed, the UWMP revision schedule, and contact information of the UWMP preparer. A public notice, as shown in Appendix A, was provided in the local newspaper to be published in advance of the plan adoption. All notification letters can be found in Appendix B. Table 10-1: County Notification County Name 60 Day Notice Notice of Public Hearing Contra Costa x x NOTES: Public Hearing and Adoption The City Council of the City of Pittsburg adopted the 2015 UWMP at its regular meeting on June 6, However, due to an error in public noticing, this UWMP is scheduled for re-adoption on July 18, 2016 by the City Council. The Resolution of Adoption of the UWMP is included in Appendix G. The City will implement this UWMP in accordance with the requirements established in the Urban Water Management Planning Act of 1983, as amended, and the Water Conservation Act of Plan Submittal Within 30 days of re-adoption, copies of this 2015 UWMP will be provided to: California Department of Water Resources California State Library Pittsburg Public Library Contra Costa County In addition, within 60 days of submittal of the UWMP to DWR, the City will submit its Water Shortage Contingency Plan to Contra Costa County. Supporting documentation that the City submitted the 2015 UWMP to the above listed entities and the Water Shortage Contingency Plan to Contra Costa County, is provided in Appendix I. Public Availability The City s 2015 UWMP has been made available to the public on the City s website at: June
57 References CCWD. (2015). Future Water Supply Study. Delta Diablo. (2013). Recycled Water Master Plan - Final Draft. DOF. (2015). Report E-1: Population Estimates for Cities, Counties, and the State. California Department of Finance, Demographic Research Unit. DWR. (2004). Bulletin 118: San Francisco Bay Hydrologic Region, Pittsburg Plain Groundwater Basin. ECCC. (2015). IRWM Plan Update. Pittsburg, C. o. (2012). Pittsburg Plain Groundwater Management Plan. Pittsburg, C. o. (2015). City of Pittsburg Housing Element. June
58 Appendix A - Public Outreach
59 Proof of newspaper Notice to Adopt to be inserted.

60
61 Appendix B - Notification Letters and Notice of Intention to Adopt
62
63
64
65 Letter notifications of City s intention to adopt to be inserted
66
67
68
69 Appendix C - Pittsburg Water Supply Memorandum
70 Memorandum Pittsburg Water Demand Projections Subject: Pittsburg 2015 UWMP Prepared For: Kim Lin, Contra Costa Water District Prepared by: Frederick Goddard, RMC Water and Environment Reviewed by: Leslie Dumas and Lindsey Wilcox, RMC Water and Environment Date: December 16, 2015 Reference: This memorandum was prepared to provide the Contra Costa Water District (CCWD) with requested information relevant to the City of Pittsburg s (City s) 2015 Urban Water Management Plan (UWMP). This information includes data on current and projected potable and recycled water demands, updated 2020 gallons per capita per day (GPCD) target demand calculations and other supplemental information as requested by CCWD. Potable Water Demands Records of historical water treatment plant production, groundwater pumping, and metered customer use were obtained from the City s Department of Water Utilities. Water treatment plant production is the volume of groundwater and surface water treated at the City s water treatment plant and conveyed in the potable water distribution system. It includes all water delivered to residential, commercial, and industrial customers, but does not include recycled water. Daily water demand in the City fluctuates throughout the year, primarily due to seasonal climate changes. Water demands are significantly higher in the summer than the winter. Residential use makes up the majority of potable water use within the City (approximately 70%), with commercial, governmental, institutional and industrial uses accounting for approximately 30% of the City s water use. Per capita water use and water use by customer type are discussed in detail later in this section. Water Use by Sector The City s water use for 2015 was 8,772 acre-feet (AF), which was a 13% increase from the 2010 water use of 7,784 AF. As part of the 2010 UWMP, the City projected that the water use in 2015 would be 9,461 AF. The actual 2015 demand was more than 7% less than the projected 2015 demand. The City s initiatives in decreasing water use to meet 2015 and 2020 GPCD targets and meeting drought restrictions have been the biggest factor in the decrease in water demand. Since potable water demands in 2015 were GPCD and are lower than the revised 2020 target of GPCD, it is reasonable to assume that the City s future demands will increase proportionally with population increase while still meeting the 2020 target. The City s actual and projected water demands for 2015, 2020, 2025, 2030, 2035 and 2040 are shown in Table 1. Water demands are broken down by customer sector. The projections assume the annual growth in demand from 2015 levels is the same across all customer sectors and is in-line with the City s projected populations as described in its Housing Element Update, The City is not expecting any major industrial growth during the projected planning period.
71 Pittsburg Demand Projections Pittsburg 2015 UWMP Single Family Use Type Table 1: Demand for Potable Water - Actual and Projected General Description of 2015 Uses 2015 Actual Level of Treatment Volume (AF) 2020 (AF) 2025 (AF) 2030 (AF) 2035 (AF) 2040 (AF) Multi-Family Commercial Industrial Institutional/Governmental Landscape Groundwater recharge/storage/banking Long term system storage Saline water intrusion barrier Drinking Agricultural irrigation a Water Wetlands or wildlife habitat Wholesale demand Other Hydrant Other Other Landscape irrigation at parks (unmetered) b Water treatment plant use (lake evaporation at 5ft per year x 3 acres and misc. use) Losses Total 8,772 9,341 9,924 10,550 11,204 11,886 a Agricultural water does not include water that is privately pumped. b The City plans to have all unmetered irrigation accounts metered by 2020, so projected demands have been added under Landscape. December
72 Pittsburg Demand Projections Pittsburg 2015 UWMP Distribution System Water Losses System water losses include leaks, meter under-registration, system and hydrant flushing, use for fire protection, and hydrant use for construction. These system losses are difficult to directly measure, but have been estimated based on the difference between water treatment plant production and metered use. In 2015, water losses were approximately 12% of water treatment plant production. The City continues to take steps to reduce unaccounted for water and system losses. Table 2: Water Loss Summary - Most Recent 12 Month Period Available Reporting Period Start Date (Month/Year) Loss (AF) July/2014 1,086 Water Savings from Codes, Standards, Ordinances, or Transportation and Land Use Plans Table 3: Inclusion in Water Use Projections Passive Savings Included Lower Income Included Yes Yes The City collaborates closely with its wholesaler, CCWD, to encourage conservation and sustainable water use through ongoing customer outreach. CCWD offers extensive resources to its wholesale service area customers through its Conservation Program. CCWD s Water Conservation Program is designed to reduce long-term potable water demands consistent with CCWD s 2015 Future Water Supply Study (FWSS). Total savings in CCWD s service area resulting from active and passive conservation activities are estimated to be 15,200 acre-feet by The following is a summary of key CCWD Conservation Program elements: Conservation surveys for single-family, multi-family, commercial, industrial, institutional, and large landscape customers. Conservation incentives including shower timers, restaurant table tents, smart car wash coupons, and money-saving mulch coupons. Conservation rebates for high-efficiency toilets, high-efficiency clothes washers, smart sprinkler timers, sprinkler and nozzle retrofits, drip retrofits, and pilot water-efficient landscapes. Education and outreach programs including flyers on how to read your meter, lawn and landscape watering schedule, and school education programs. In addition to active conservation activities implemented through CCWD s Conservation Program, passive conservation is also achieved through state and local efficiency codes. Efficiency codes that require efficient fixtures and appliances, grant funding to promote water conservation, residential weather-based irrigation controllers, and efficient landscape practices are expected to achieve additional water use reductions in the City s water service area. The City also maintains a water conservation page ( that provides water conservation resources both general and specific to conditions within Contra Costa County. The site includes links to information regarding both household and irrigation conservation practices and contains various documents regarding the City s 15% Water Conservation Program, December
73 Pittsburg Demand Projections Pittsburg 2015 UWMP implemented in 2009 in collaboration with CCWD, to address the impacts of a severe drought in the region. As part of the conservation efforts, the City adopted Resolution No establishing a Water Conservation Program that includes issuing a Water Conservation Advisory and establishing penalties for non-compliance. The City adopted a landscape ordinance on December 20, Recycled Water Demands The City supports the further development of irrigation and industrial recycled water uses where available supplies of recycled water, appropriateness of planned use, and economic feasibility coincide. Delta Diablo Sanitation District (DDSD) began providing recycled water to the City of Pittsburg s irrigation locations at Central Park and along the 8 th Street, Columbia and Santa Fe Corridors in Annual recycled water demand since 2005 is shown in Table 4. Table 4: Annual Recycled Water Demand Fiscal Year a Recycled Water Demand (AF) a Calendar year recycled water demand data from 2000 to 2010 is available upon request. DDSD has identified landscape irrigation and industrial cooling as the primary uses of recycled water in its service area. Future recycled water projects are expected to be consistent with these two uses. Currently, there are seven new recycled water connections planned to come online between 2016 and 2018, all for landscape irrigation purposes. Some of these sites may be dependent on outside funding, however, for implementation. Current and projected beneficial uses of recycled water are summarized in Table 5. To date, no new recycled water connections have been planned beyond the year December
74 Pittsburg Demand Projections Pittsburg 2015 UWMP Table 5: Current and Projected Recycled Water Direct Beneficial Uses within Service Area Name of Agency Producing (Treating) the Recycled Water: Name of Agency Operating the Recycled Water Distribution System: Delta Diablo Sanitation District Delta Diablo Sanitation District Supplemental Water Added in 2015 / Source of 2015 Supplemental Water Beneficial Use Type Agricultural irrigation General Description of 2015 Uses Level of Treatment NN.A Landscape irrigation (exc golf courses) Tertiary Golf course irrigation Tertiary Commercial use Industrial use Tertiary 6,178 6,178 6,178 6,178 6,178 6,178 Geothermal and other energy production Seawater intrusion barrier Recreational impoundment Wetlands or wildlife habitat Groundwater recharge (IPR) Surface water augmentation (IPR) Direct potable reuse Other - Total: 6,646 6,846 6,846 6,846 6,846 6,846 December
75 Pittsburg Demand Projections Pittsburg 2015 UWMP Updated GPCD Targets The 2010 UWMP water use baseline and target calculations were updated for the 2015 UWMP using U.S. Census population data for 1990, 2000 and Linear interpolation was used to estimate population from 1991 to 1999 and 2001 to Past service area population is shown in Table 6. Table 6: Pittsburg Population Year Service Area Population 47,564 48,441 49,319 50,196 51,074 51,951 52,828 53,706 54,583 55,461 56,338 Year Service Area Population 57,031 57,723 58,416 59,108 59,801 60,494 61,186 61,879 62,571 63,264 Gross water use for each year within the base year range was calculated using California Department of Water Resources (DWR s) Methodology 1 and was based on production data from the City s Water Treatment Plant. The gross water use is defined in California Water Code Section (g) as the total volume of water entering the distribution system excluding recycled water. The City s gross water use for its water service area was determined based on water production data from the water treatment and does not include recycled water. In addition, the City s 2015 UWMP is reporting all data on a fiscal year basis in contrast to the 2010 plan that reported on a calendar year basis, so the water use calculations were updated to reflect water use by fiscal year (July 1 st to June 30 th ). Table 7 summarizes the revised GPCD baselines and targets. Table 7: Baselines and Targets Summary Baseline Period Start Years From SBX7-7 Table 1 End Years From SBX7-7 Table 1 Average GPCD 2015 Interim Target Confirmed 2020 Target 10 year Year The four allowable DWR methods for calculating water use targets are: Method 1: 80% of Base Daily Per Capita Water Use Method 2: Performance Standards Method 3: 95% of the DWR Hydrologic Region Per Capita Use Target Method 4: Applying Savings by Water Sector Based on a preliminary evaluation of the four methods, the City utilized Method 1 for the revised calculations, the same method used in The calculated targets were compared against DWR s maximum allowable target, which is equal to 95% of the City s 5-year base per capita use. The revised 2020 target meets the maximum allowable target, which would result in a target of GPCD Compliance To calculate the 2015 actual GPCD, the California Department of Finance (DOF) January 2015 population for Pittsburg was used since the service area is contiguous with the City boundaries. Current and future population estimates are shown in Table 8 below. The 2015 population for the City was estimated at 67,628. December 2015
76 Pittsburg Demand Projections Pittsburg 2015 UWMP Table 8: Population Current and Projected Year Population Served a 63,264 67,628 72,000 76,500 81,300 86,400 91,600 a Source for 2015 population: Department of Finance January population estimates are based on Association of Bay Area Governments (ABAG) projections as described in the City of Pittsburg Housing Element Update, For water use, data from the Fiscal Year (see Table 1) was utilized for the calculation. Gross water use for FY 2015 was 8,772 AF (2,858 MG). As shown in Table 9, the City met its 2015 interim target before normalization, and is also below its 2020 target. Methodologies for normalization are optional and are yet to be released by DWR. Table 9: 2015 Compliance 2015 Interim Target 2015 Actual GPCD Adjustments Actual as Percent of Target In Compliance? Y/N Methodologies Pending Methodologies Pending Yes 1989 to 2015 Use of Groundwater Wells As requested by CCWD, past annual use of the City s groundwater wells is outlined in Table 10, followed by monthly use since July 2013 in Table 11. Table 10: Annual Well Supply Fiscal Year Well Supply (AF) NA NA NA NA 18 1,534 1,681 1,840 1,953 Fiscal Year Well Supply (AF) 1,421 1,477 1, ,773 Fiscal Year Well Supply (AF) 1,825 2,092 1,188 1,061 1,694 1,883 1,663 1,418 1,181 NA Not Available Table 11: Monthly Well Supply Jul Aug Sep Oct Nov Dec Jan Feb Mar Apr May Jun Well Supply (AF) Well Supply (AF) Well Supply (AF) NA NA NA NA NA NA NA NA Not Available December
77 Appendix D - SBX7-7 Tables
78 SB X7-7 Table 0: Units of Measure Used in UWMP* (select one from the drop down list) Acre Feet *The unit of measure must be consistent with Table 2-3 NOTES: SB X7-7 Table-1: Baseline Period Ranges Baseline 10- to 15-year baseline period 5-year baseline period Parameter Value Units 2008 total water deliveries 11,649 Acre Feet 2008 total volume of delivered recycled water 80 Acre Feet 2008 recycled water as a percent of total deliveries 0.68% Percent Number of years in baseline period 1 10 Years Year beginning baseline period range 1999 Year ending baseline period range Number of years in baseline period 5 Years Year beginning baseline period range 2004 Year ending baseline period range If the 2008 recycled water percent is less than 10 percent, then the first baseline period is a continuous 10-year period. If the amount of recycled water delivered in 2008 is 10 percent or greater, the first baseline period is a continuous 10- to 15- year period. 2 The ending year must be between December 31, 2004 and December 31, The ending year must be between December 31, 2007 and December 31, NOTES: SB X7-7 Table 2: Method for Population Estimates Method Used to Determine Population (may check more than one) 1. Department of Finance (DOF) DOF Table E-8 ( ) and ( ) and DOF Table E-5 ( ) when available 2. Persons-per-Connection Method 3. DWR Population Tool 4. Other DWR recommends pre-review NOTES: DOF data used for 2015 population, Census data for 1990, 2000 and 2010 populations, since City boundaries are the same as service area boundaries. Linear interpolation used for populations fom 1991 to 1999 and 2001 to 2009.
79 SB X7-7 Table 3: Service Area Population Year Population 10 to 15 Year Baseline Population Year ,461 Year ,338 Year ,031 Year ,723 Year ,416 Year ,108 Year ,801 Year ,494 Year ,186 Year ,879 Year 11 Year 12 Year 13 Year 14 Year 15 5 Year Baseline Population Year ,108 Year ,801 Year ,494 Year ,186 Year , Compliance Year Population ,628 NOTES:
80 SB X7-7 Table 4: Annual Gross Water Use * Baseline Year Fm SB X7-7 Table 3 Volume Into Distribution System Fm SB X7-7 Table(s) 4-A Exported Water Change in Dist. System Storage (+/-) Deductions Indirect Recycled Water Fm SB X7-7 Table 4-B Water Delivered for Agricultural Use Process Water Fm SB X7-7 Table(s) 4-D Annual Gross Water Use 10 to 15 Year Baseline - Gross Water Use Year ,106 Year ,113 Year ,742 Year ,431 Year ,808 Year ,977 Year ,227 Year ,753 Year ,574 Year ,648 Year Year Year Year Year year baseline average gross water use 7,159 5 Year Baseline - Gross Water Use Year , ,977 Year , ,227 Year , ,753 Year , ,574 Year , ,648 5 year baseline average gross water use 11, Compliance Year - Gross Water Use , ,772 * NOTE that the units of measure must remain consistent throughout the UWMP, as reported in Table 2-3 NOTES:
81 SB X7-7 Table 4-A: Volume Entering the Distribution System(s) Complete one table for each source. Name of Source Source 1 This water source is: Raw Water from CCWD The supplier's own water source A purchased or imported source Baseline Year Fm SB X7-7 Table 3 Volume Entering Distribution System Meter Error Adjustment * Optional (+/-) Corrected Volume Entering Distribution System 10 to 15 Year Baseline - Water into Distribution System Year ,629 Year ,759 Year ,999 Year ,671 Year ,121 Year ,149 Year ,415 Year ,980 Year ,749 Year ,556 Year Year Year Year Year Year Baseline - Water into Distribution System Year ,149 Year ,415 Year ,980 Year ,749 Year , Compliance Year - Water into Distribution System ,591 * Meter Error Adjustment - See guidance in Methodology 1, Step 3 of Methodologies Document NOTES:
82 SB X7-7 Table 4-A: Volume Entering the Distribution Name of Source Source 2 This water source is: Local Groundwater The supplier's own water source A purchased or imported source Baseline Year Fm SB X7-7 Table 3 Volume Entering Distribution System Meter Error Adjustment * Optional (+/-) Corrected Volume Entering Distribution System 10 to 15 Year Baseline - Water into Distribution System Year ,477 Year ,354 Year Year Year Year Year Year ,773 Year ,825 Year ,092 Year Year Year Year Year Year Baseline - Water into Distribution System Year Year Year ,773 Year ,825 Year , Compliance Year - Water into Distribution System ,181 1,181 * Meter Error Adjustment - See guidance in Methodology 1, Step 3 of Methodologies Document NOTES:
83 SB X7-7 Table 5: Gallons Per Capita Per Day (GPCD) Baseline Year Fm SB X7-7 Table 3 10 to 15 Year Baseline GPCD Service Area Population Fm SB X7-7 Table 3 Annual Gross Water Use Fm SB X7-7 Table 4 Daily Per Capita Water Use (GPCD) Year ,461 10, Year ,338 10, Year ,031 10, Year ,723 10, Year ,416 10, Year ,108 10, Year ,801 10, Year ,494 10, Year ,186 11, Year ,879 11, Year Year Year Year Year Year Average Baseline GPCD 5 Year Baseline GPCD Baseline Year Fm SB X7-7 Table 3 Service Area Population Fm SB X7-7 Table 3 Gross Water Use Fm SB X7-7 Table Daily Per Capita Water Use Year ,108 10, Year ,801 10, Year ,494 10, Year ,186 11, Year ,879 11, Year Average Baseline GPCD 2015 Compliance Year GPCD NOTES: ,628 8,
84 SB X7-7 Table 6: Gallons per Capita per Day Summary From Table SB X7-7 Table Year Baseline GPCD 5 Year Baseline GPCD Compliance Year GPCD 116 NOTES: SB X7-7 Table 7: 2020 Target Method Select Only One NOTES: Target Method Method 1 Method 2 Supporting Documentation SB X7-7 Table 7A SB X7-7 Tables 7B, 7C, and 7D Contact DWR for these tables Method 3 SB X7-7 Table 7-E Method Year Baseline GPCD Method 4 Calculator SB X7-7 Table 7-A: Target Method 1 20% Reduction NOTES: 5 Year Baseline GPCD From SB X7-7 Table Target GPCD SB X7-7 Table 7-F: Confirm Minimum Reduction for 2020 Target Maximum 2020 Target* Calculated 2020 Target Fm Appropriate Target Table Confirmed 2020 Target * Maximum 2020 Target is 95% of the 5 Year Baseline GPCD NOTES:
85 SB X7-7 Table 8: 2015 Interim Target GPCD Confirmed 2020 Target Fm SB X7-7 Table 7-F year Baseline GPCD Fm SB X7-7 Table Interim Target GPCD NOTES: SB X7-7 Table 9: 2015 Compliance Actual 2015 GPCD 2015 Interim Target GPCD Extraordinary Events From Methodology 8 (Optional) Optional Adjustments (in GPCD) Weather Normalization From Methodology 8 (Optional) Economic Adjustment From Methodolo gy 8 (Optional) TOTAL Adjustments Adjusted 2015 GPCD 2015 GPCD (Adjusted if applicable) NA Yes NOTES:The City did not adjust its compliance GPCD using weather normalization, economic adjustment or extraordinaty events. Did Supplier Achieve Targeted Reduction for 2015?
86 Appendix E - Water Conservation Resolutions
87
88
89
90
91
92
93
94 Appendix F - CCWD Supply Reliability Analysis
95
96
97 Appendix G - Resolution of Adoption of UWMP
98 Resolution of 2015 Pittsburg UWMP adoption to be inserted
99 Appendix H - Pittsburg Plain GWMP
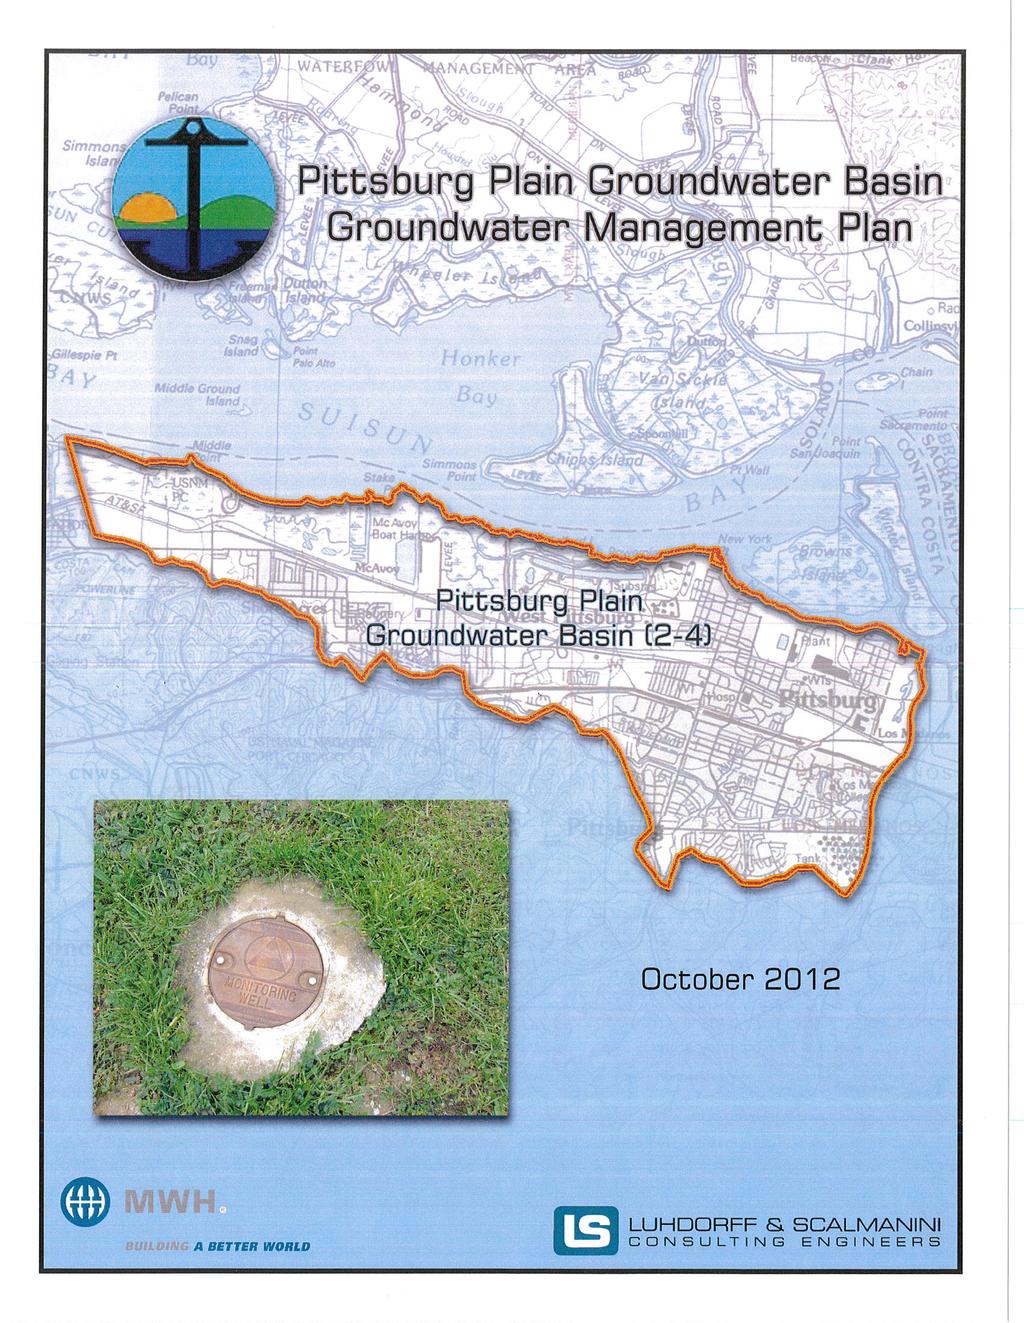
100
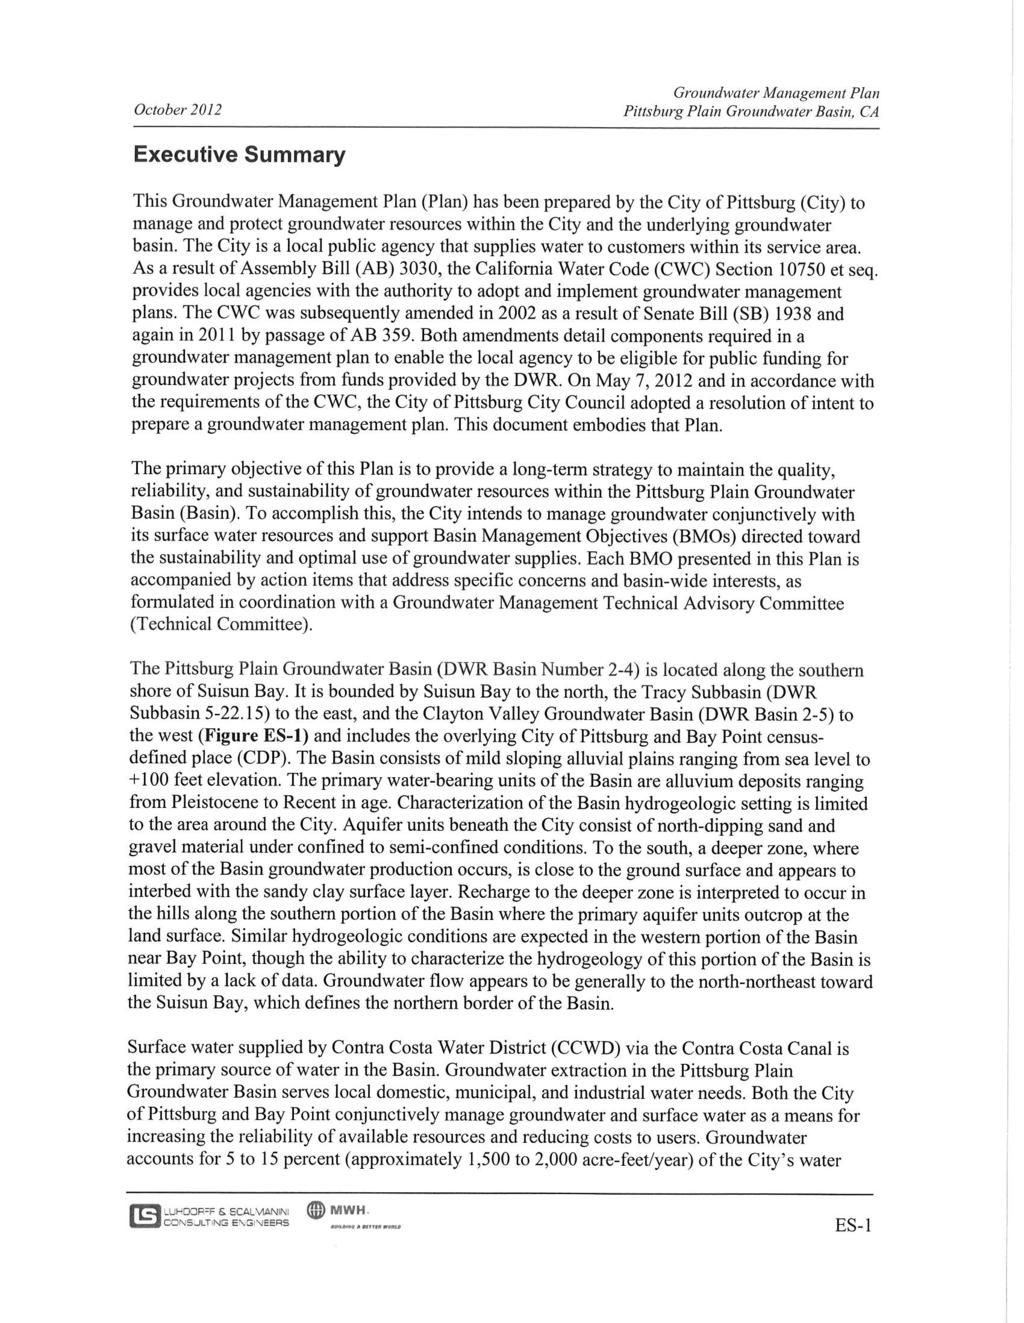
101
102
103

104
105
106
107
108 Appendix I - Supporting Documentation for Submittal of UWMP and WSCP
109 Supporting documentation for proof of submittal of 2015 UWMP to DWR, CA State Library, Pittsburg Public Library and Contra Costa County, and Pittsburg WSCP to Contra Costa County to be inserted
110 Appendix J - System Energy Intensity Analysis

111 DRAFT Technical Memorandum City of Pittsburg 2015 UWMP Subject: Prepared For: Prepared by: Reviewed by: Energy Intensity Walter Pease, City of Pittsburg Fred Goddard and Lindsey Wilcox, RMC Leslie Dumas, RMC and Walter Pease, City of Pittsburg Date: February 22, 2016 Reference: Introduction Appendix O, Energy Intensity, of the 2015 Urban Water Management Plans Guidebook for Urban Water Suppliers (DWR, 2016) provides guidance for estimating energy intensity associated with sources of water used by an urban water supplier. While estimating energy intensity (EI) is an optional portion of an Urban Water Management Plan (UWMP), the City of Pittsburg (City) is aware of the importance of understanding energy usage within its water system and has chosen to estimate EI. The purpose of calculating the City s EI is to: Develop a baseline energy use per acre-foot of treated water delivered by the water system. Aid in identifying energy saving opportunities in the future. Allow for comparing energy use among similar agencies. Water EI is the total amount of energy expended on a per acre-foot (AF) basis to take water from the location the City acquires it to the point of delivery. Thus, EI includes conveyance, extraction, treatment, placing water into and taking it from storage, and distribution. The City s water EI only accounts for the water management processes occurring within its operational control; energy use associated with the distribution of wholesale water to the City s point of diversion is not included. This technical memorandum (TM) describes the City s water EI and how it was calculated. 2 Estimating the City s Energy Intensity (EI) 2.1 Pittsburg s Water System The City purchases 85% to 95% of its water supply from Contra Costa Water District (CCWD) which it diverts as raw water from the Contra Costa Canal. The raw water is pumped from the canal to the City s water treatment plant (WTP) for treatment prior to delivery to the City s local service reservoirs. From the service reservoirs the water is distribute throughout the City via gravity and booster pump stations where necessary. The City also pumps groundwater from the Pittsburg Plain Groundwater Basin from two municipal wells, the Rossmoor Well and Bodega Well. The wells are relatively shallow with depths of approximately 200 feet. Recycled water is delivered within the City s service area by Delta Diablo Sanitation District (DDSD). Because the City does not produce or deliver the recycled water, it is not included in the City s water EI. The following water management processes are accounted for in the City s water EI as described in the following sections. Diversion of raw water from Contra Costa Canal. February